. 2024 Oct 1;15(10):721.
doi: 10.1038/s41419-024-07105-7.

Deciphering the impact of PROM1 alternative splicing on human photoreceptor development and maturation

Affiliations

Deciphering the impact of PROM1 alternative splicing on human photoreceptor development and maturation

Marina Moya-Molina et al. Cell Death Dis. .

Abstract

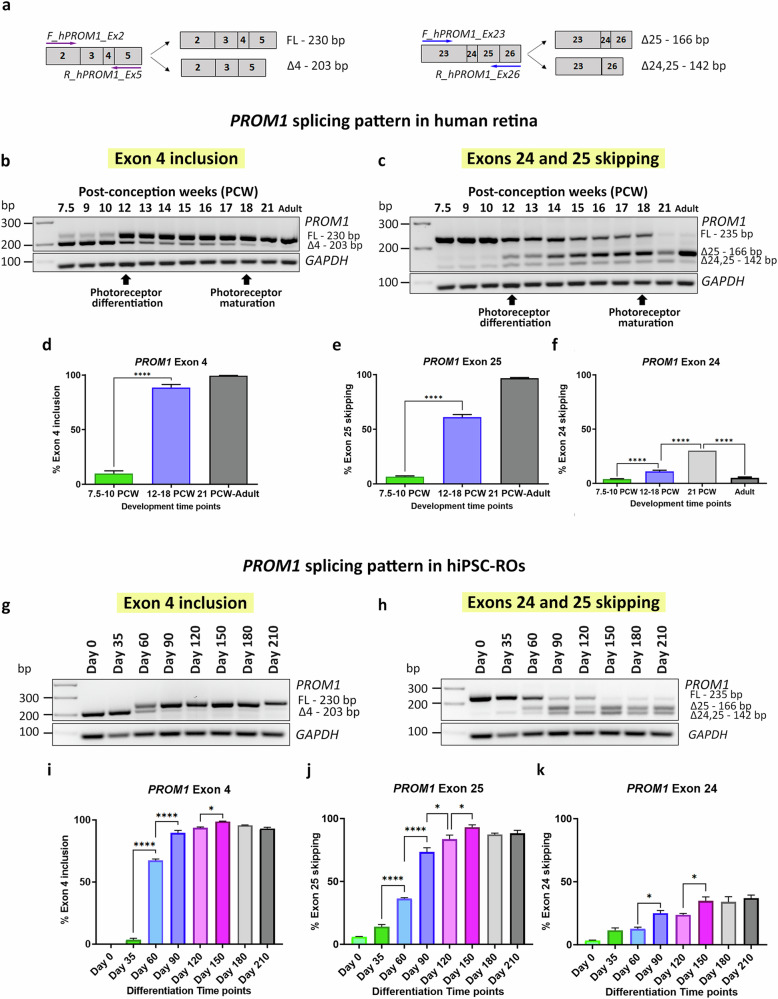
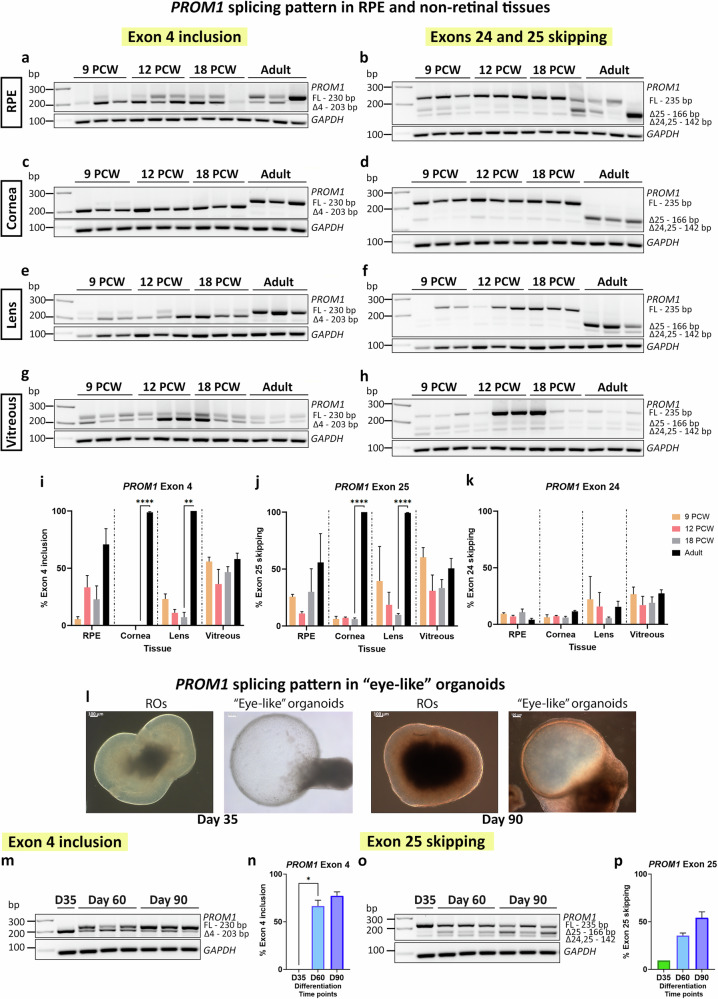
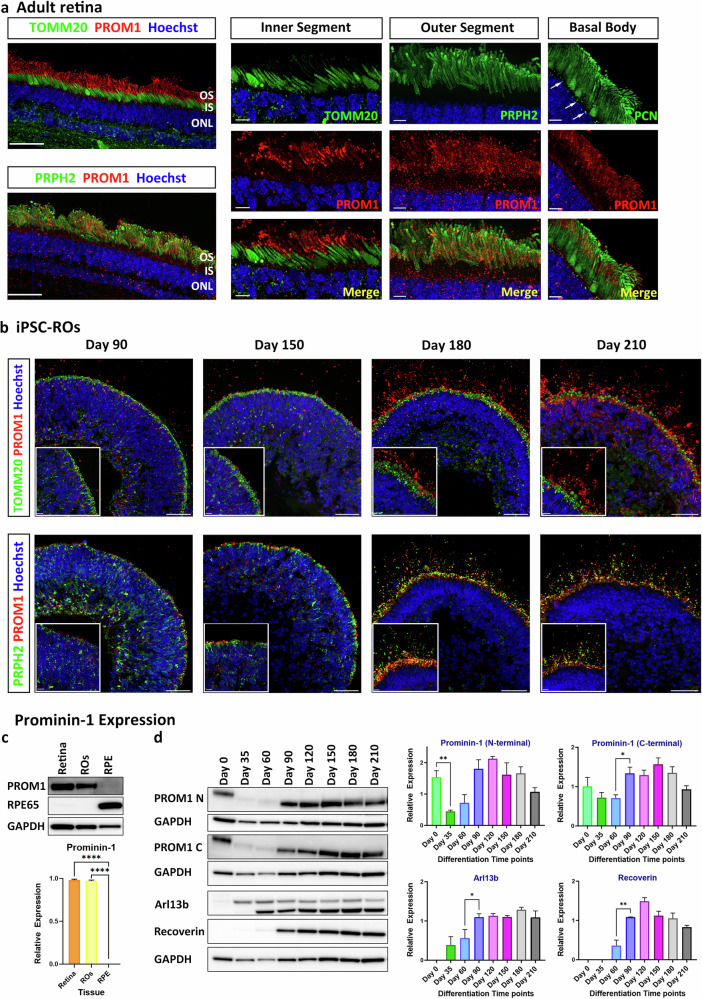
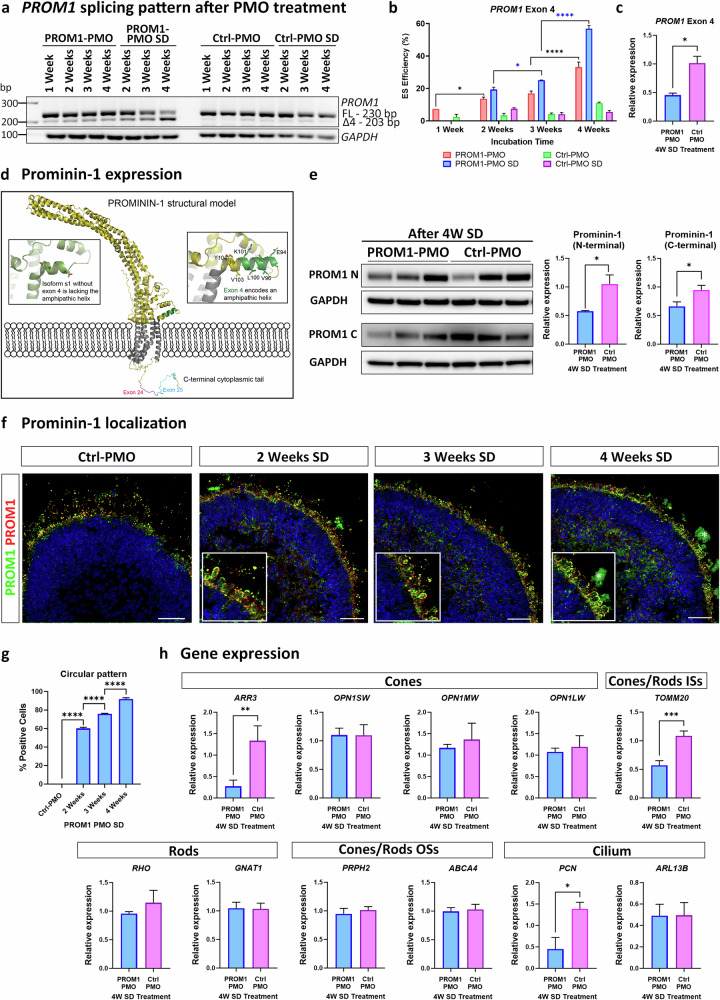
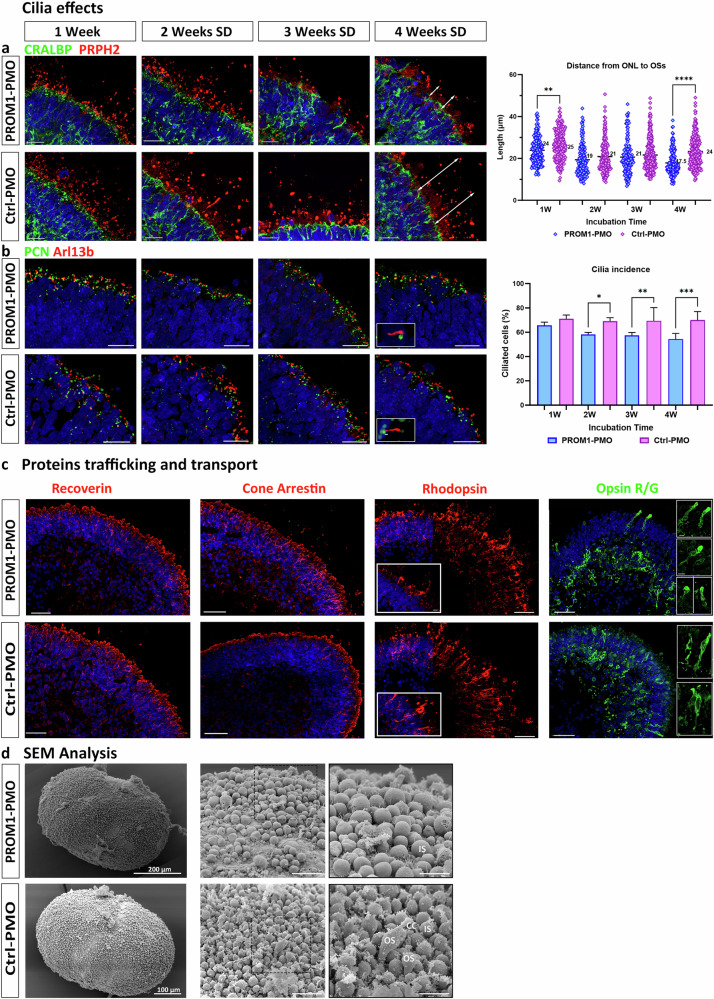
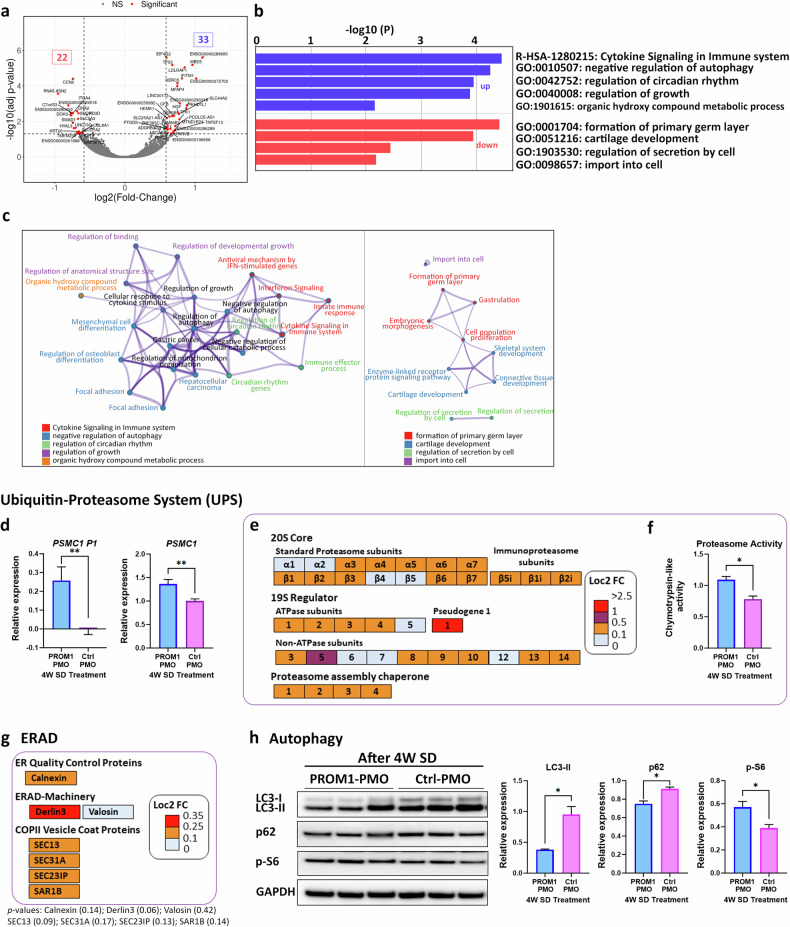
Alternative splicing (AS) is a crucial mechanism contributing to proteomic diversity, which is highly regulated in tissue- and development-specific patterns. Retinal tissue exhibits one of the highest levels of AS. In particular, photoreceptors have a distinctive AS pattern involving the inclusion of microexons not found in other cell types. PROM1 whose encoded protein Prominin-1 is located in photoreceptor outer segments (OSs), undergoes exon 4 inclusion from the 12th post-conception week of human development through adulthood. Exon 4 skipping in PROM1 is associated with late-onset mild maculopathy, however its role in photoreceptor maturation and function is unknown. In this study retinal organoids, a valuable model system, were employed in combination with phosphorodiamidate morpholino oligos (PMOs) to assess the role of exon 4 AS in the development of human retina. Retinal organoids were treated with the PMOs for four weeks after which RT-PCR, western blotting and immunofluorescence analysis were performed to assess exon 4 exclusion and its impact on photoreceptors. The transcriptome of treated ROs was studied by bulk RNA-Seq. Our data demonstrate that 55% skipping of PROM1 exon 4 resulted in decreased Prominin-1 expression by 40%, abnormal accumulation of cones in the basal side of the retinal organoids as well as detectable cone photoreceptor cilium defects. Transcriptomic and western blot analyses revealed decreased expression of cone, inner segment and connecting cilium basal body markers, increased expression of genes associated with stress response and the ubiquitin-proteasome system, and downregulation of autophagy. Importantly, the use of retinal organoids provides a valuable platform to study AS and unravel disease mechanisms in a more physiologically relevant context, opening avenues for further research and potential therapeutic interventions. Together our data indicate that cones may be more sensitive to PROM1 exon 4 skipping and/or reduced Prominin-1 expression, corroborating the pathogenesis of late-onset mild maculopathy.


Conflict of interest statement

The authors declare no competing interests.

Figures

Fig. 1
Fig. 1. PROM1 alternative splicing in retina in vivo and in vitro.
a Schematic representation of the primers used to amplify exon 4 (on the left) and exons 24 and 25 (on the right). bf RT-PCR analysis of PROM1 splicing during human retinal development: b Exon 4 PROM1 and c Exon 25 PROM1 splicing pattern; df Quantification of exon 4 inclusion, exon 25 skipping and exon 24 skipping. Data are shown as mean ± SEM (n = 3–7). Statistical significance was assessed using one-way ANOVA with Sídák’s post hoc test. ****p < 0.0001. gk RT-PCR analysis of PROM1 splicing during hiPSC-ROs differentiation: g Exon 4 PROM1 and h Exon 25 PROM1 splicing pattern; ik Quantification of exon 4 inclusion, exon 25 skipping and exon 24 skipping. Data are shown as mean ± SEM (n = 3). Statistical significance was assessed using one-way ANOVA with Sídák’s post hoc test. *p < 0.05, ****p < 0.0001. FL Full-length product, △4 Exon 4 skipped, △25 Exon 25 skipped, △24,25 Exons 24 and 25 skipped, PCW Post-conception week.
Fig. 2
Fig. 2. PROM1 alternative splicing in RPE and non-retinal tissues.
ak RT-PCR analysis of PROM1 splicing in RPE and non-retinal samples: (a, b) RPE; (c, d) cornea; (e, f) lens and (g, h) vitreous; (ik) Quantification of exon 4 inclusion, exon 25 skipping and exon 24 skipping. Data are shown as mean ± SEM (n = 3). Statistical significance was analysed by one-way ANOVA with Sídák’s post hoc test. **p < 0.01, ****p < 0.0001. lp Study of PROM1 splicing in “eye-like” ROs. l Representative bright-field images showing the morphology of ROs and “eye-like” organoids at days 35 and 90 of differentiation. Scale bars: 100 μm. mp RT-PCR analysis of PROM1 splicing in “eye-like” ROs at three different time points of differentiation: m Exon 4 PROM1 splicing pattern; o Exon 25 PROM1 splicing pattern; n, p Quantification of exon 4 inclusion and exon 25 skipping. Data are shown as mean ± SEM (n = 3). Statistical significance was analysed by one way-ANOVA with Sídák’s post hoc test. *p < 0.05. FL Full-length product, △4 Exon 4 skipped, △25 Exon 25 skipped, △24,25 Exons 24, 25 skipped, PCW Post-conception week.
Fig. 3
Fig. 3. Prominin-1 expression in adult retina and hiPSC-ROs.
a Immunofluorescence analysis of Prominin-1 in adult retina. Two different Prominin-1 antibodies were used: 1st Extracellular loop (E2) Prominin-1 (PROM1, red) antibody in combination with either TOMM20 (green) marking the ISs or PCN marking the basal body of the connecting cilium (white arrows); N-terminal Prominin-1 (PROM1, red) antibody in combination with PRPH2 (green) marking the OSs. b Immunofluorescence analysis of Prominin-1 (PROM1, red) during ROs differentiation in combination with TOMM20 (green) and PRPH2 (green) antibodies. a, b Cell nuclei were stained with Hoechst. Scale bars: 50 μm; 10 μm (magnification). c Representative western blot and quantification analysis showing Prominin-1 expression in human adult retina and RPE samples and ROs at day 180 of differentiation. RPE65 expression was also assessed. GAPDH was used as a loading control. Data represent the mean ± SEM (n = 3). Statistical significance was analysed by one-way ANOVA with Sídák’s post hoc test. ****p < 0.0001. d Representative western blot and quantification analysis showing Prominin-1 expression during ROs differentiation. Both the Prominin-1 N-terminal and C-terminal antibodies were used. Arl13b and recoverin expression were also assessed. GAPDH was used as a loading control. Data represent the mean ± SEM (n = 3). Statistical significance was analysed by one-way ANOVA with Sídák’s post hoc test. *p < 0.05, **p < 0.01. IS inner segment, ONL outer nuclear layer, OS outer segment, PCN pericentrin, PRPH2 peripherin-2.
Fig. 4
Fig. 4. Treatment of hiPSC-ROs at day 180 of differentiation with PROM1-PMO or Ctrl-PMO from 1 to 4 weeks.
a, b RT-PCR analysis and quantification of exon 4 skipping efficiency after PMO treatment. Data are shown as mean ± SEM (n = 3). Statistical significance was assessed using one-way ANOVA with Sídák’s post hoc test. *p < 0.05, ****p < 0.0001. c qRT-PCR analysis showing downregulation in expression of PROM1 transcript with exon 4 after PROM1-PMO treatment. Data are shown as mean ± SEM (n = 3). Statistical significance was assessed using unpaired Student t test. *p < 0.05. d AlphaFold predicted model of Prominin-1 structure. Zoom in on exon 4 (s2 isoform) shows that part of the helix in green which is missing in s1 and connects to the following helix via a loop. e Representative western blot and quantification analysis showing decreased level of Prominin-1 after PROM1-PMO treatment. Both the Prominin-1 N-terminal and C-terminal antibodies were used. GAPDH was used as a loading control. Data are shown as mean ± SEM (n = 3). Statistical significance was assessed using unpaired Student t test. *p < 0.05. f Representative images of ROs treated with Ctrl-PMO for 4 weeks with several doses or with PROM1-PMO from 2 to 4 weeks with several doses. Prominin-1 N-terminal (PROM1, green) and E2 (PROM1, red) antibodies were used. Higher magnification images revealed the circular pattern of Prominin-1 around the ISs after the treatment (*marks background signal). Cell nuclei were stained with Hoechst. Scale bars: 50 μm. g Quantification of circular pattern. Data are shown as mean ± SEM (n = 5 ROs/condition/biological triplicate). Statistical significance was analysed by one-way ANOVA with Sídák’s post hoc test. ****p < 0.0001. h qRT-PCR analysis of cones and rod, ISs, OSs and cilia specific markers after several doses of PROM1-PMO treatment for 4 weeks. Data are shown as mean ± SEM (n = 3). Statistical significance was determined using unpaired Student t-test. *p < 0.05, **p < 0.01, ***p < 0.001. FL Full-length product, △4 Exon 4 skipped, OSs outer segments, ISs inner segments, SD Several Doses, UTC untreated.
Fig. 5
Fig. 5. PROM1 exon 4 skipping effects in cilia and proteins trafficking and transport.
a Representative images of photoreceptors and the OSs after 1 week to 4 weeks of incubation with either PROM1-PMO or Ctrl-PMO. CRALBP antibody (green) was used to mark both the ellipsoid and myoid regions of the ISs and PRPH2 antibody (red) to mark the OSs. Quantification of ONL to OS distance (from CRALBP staining to the tip of PRPH2 staining, as exemplified by the white arrows) is shown on the right, with the average of each condition displayed in the graph. Data are shown as mean ± SEM (n = 3). Statistical significance was analysed by one-way ANOVA with Sídák’s post hoc test. **p < 0.01, ****p < 0.0001. b Representative images of connecting cilium using pericentrin (PCN; green) marking the basal body, and Arl13b (red) marking the axoneme. Inset shows cilium structure. Quantification of ciliation of cells is shown on the right. Data are shown as mean ± SEM (n = 3). Statistical significance was analysed by one-way ANOVA with Sídák’s post hoc test. *p < 0.05, **p < 0.01, ***p < 0.001. a, b Cell nuclei were stained with Hoechst. Scale bars: 20 μm. c Localization of photoreceptor markers in ROs after PROM1/Ctrl-PMO treatment for 4 weeks with several doses. Antibodies were used against recoverin (red); cone arrestin (red); rhodopsin (red) and opsin R/G (green). Higher magnification images showed rods and cones morphology, revealing a bulbous structure in the case of cones after PROM1-PMO treatment. Representative images from 5 ROs/condition/biological triplicate are shown. Cell nuclei were stained with Hoechst. Scale bars: 50 μm; 10 μm (magnification). d Scanning electron microscopy illustrating photoreceptor IS, connecting cilium (CC) and developing OS in ROs after PMO treatment. Scale bars: 20 μm; 10 μm (magnification, black edges images). CC connecting cilium, IS inner segment, OS outer segment, PCN pericentrin, PRPH2 peripherin-2.
Fig. 6
Fig. 6. PROM1 Exon 4 skipping results in upregulation of proteasomal components and downregulation of autophagy.
a Differentiated expressed genes presented as a volcano plot with the −log10 p-value plotted against the log2 FC (PROM1-PMO ROs compared to Ctrl-PMO ROs). Fold-change cut-off was established to 0.585, corresponding to a fold-change of >1.5 and adjusted p-value < 0.05. b Bar graph of GO terms enriched across upregulated (blue) and downregulated (red) input genes due to exon 4 skipping. Overexpressed genes were mapped to infection process and negative regulation of autophagy, whereas downregulated genes were mapped to developmental processes such as formation of the primary germ layer. c Network of enriched terms derived from the upregulated (left diagram) and downregulated (right diagram) genes coloured by cluster ID. Nodes that share the same cluster ID are typically close to each other. Terms with a similarity score >0.3 are linked by an edge (the thickness of the edge represents the similarity score). The network is visualized using Cytoscape. d qRT-PCR analysis of PSMC1 gene and pseudogene expression. Data are shown as mean ± SEM (n = 3). Statistical significance was assessed by unpaired Student t test. **p < 0.01. e PROM1-PMO treatment induced overexpression of several proteasome subunits. The log2FC values are shown on the side of coloured legend, for example orange colour indicates Log2FC > 0.1 and <0.5. f Increased Proteasome Trypsin-like activity in PROM1-PMO ROs compared to control confirming RNA-Seq results. Data are shown as mean ± SEM (n = 3). Statistical significance was assessed by unpaired Student t test. *p < 0.05. g PROM1-PMO treatment induced overexpression of several ERAD-related components such as quality control proteins, machinery-related or COPII vesicle coat proteins. The log2FC values are shown on the side of coloured legend, for example orange colour indicates Log2FC > 0.1 and <0.25. p-values associated with the Log2FC values are displayed underneath the figure. h Representative western blot and quantification analysis of key autophagic components showing downregulation of LC3-II and p62, and upregulation of p-S6 expression in PROM1-PMO treated ROs compared to Ctrl-PMO treated ROs. GAPDH was used as a loading control. Data are shown as mean ± SEM (n = 3). Statistical significance was analysed using unpaired Student t test. *p < 0.05. ERAD endoplasmic-reticulum-associated degradation system, PSMC1 Proteasome 26S subunit ATPase 1, PSMC1P1 Proteasome 26S subunit ATPase 1 pseudogene 1, p-S6 phospho-S6 Ribosomal protein.
Fig. 7
Fig. 7. Prominin-1 interactors found in Y2H assay.
a Schematic representation of Prominin-1 structure and the subdivision into four fragments (E1, E2, E3 and I1) for the Gateway cloning and subsequent screen. Fragment E1: amino acid 2–106; E2: amino acid 180–433; E3: amino acid 504–790; I1: amino acid 814–865. b α-Galactosidase Assay, where transformed yeast cells containing both hybrid plasmids (BD and AD recombinant plasmids) were plated in SD-Leu/-Trp/-His/-Ade (SD-LWHA) media with X-α-gal substrate. MEL1 reporter gene turns X-α-gal substrate into blue coloured end product. c Potential Prominin-1 interactors found in the Y2H screen of human and bovine retinal cDNA libraries. Two prominent protein modules can be distinguished: a module composed by proteins linked to protein transport (in orange), and a module of microtubule-associated proteins (in green). Number of clones = number of colonies growing after library mating, sequence verified; Number of unique clones = number of single clones based on sequence; Library Bait Count = number of times previously identified in a Y2H screen of this library with an unrelated bait protein. The higher the bait count the less likely that it is specific. d Immunofluorescence analysis of SH3GL3 (green) in combination with Prominin-1 (PROM1, red) in adult retina and e in hiPSC-ROs during differentiation. ROs were stained at days 90, 150, 180 and 210 of differentiation. Higher magnification images revealed the close association of SH3GL3 with PROM1 at day 90 (white asterisks) and its specific localization in the ISs at later stages. f Colocalization of SH3GL3 and TOMM20 in the IS in ROs at day 210 of differentiation. df Cell nuclei were stained with Hoechst. Scale bars: 50 μm; 10 μm (magnification).

References

    1. Weisschuh N, Buena-Atienza E, Wissinger B. Splicing mutations in inherited retinal diseases. Progr Retinal Eye Res. 2021;80:100874. - PubMed
    1. Ciampi L, Mantica F, López-Blanch L, Permanyer J, Rodriguez-Marín C, Zang J, et al. Specialization of the photoreceptor transcriptome by Srrm3-dependent microexons is required for outer segment maintenance and vision. PNAS. 2022;119. Available from: 10.1073/pnas.2117090119. - PMC - PubMed
    1. Corbeil D. Prominin-1 (CD133): New Insights on Stem & Cancer Stem Cell Biology. Advances in Experimental Medicine and Biology. New York: Springer Science+Business Media; 2013. 1–255 p. Available from: http://www.springer.com/series/5584.
    1. Shmelkov SV, St.Clair R, Lyden D, Rafii S. AC133/CD133/Prominin-1. Int J Biochem Cell Biol. 2005;37:715–9. - PubMed
    1. Weigmann A, Corbeil D, Hellwig A, Huttner WB. Prominin, a novel microvilli-specific polytopic membrane protein of the apical surface of epithelial cells, is targeted to plasmalemmal protrusions of non-epithelial cells. Proc Natl Acad Sci USA. 1997;94:12425–30. - PMC - PubMed