. 2024 Oct 1;15(10):713.
doi: 10.1038/s41419-024-07115-5.

STAT6/LINC01637 axis regulates tumor growth via autophagy and pharmacological targeting STAT6 as a novel strategy for uveal melanoma

Affiliations

STAT6/LINC01637 axis regulates tumor growth via autophagy and pharmacological targeting STAT6 as a novel strategy for uveal melanoma

Bo Liu et al. Cell Death Dis. .

Abstract

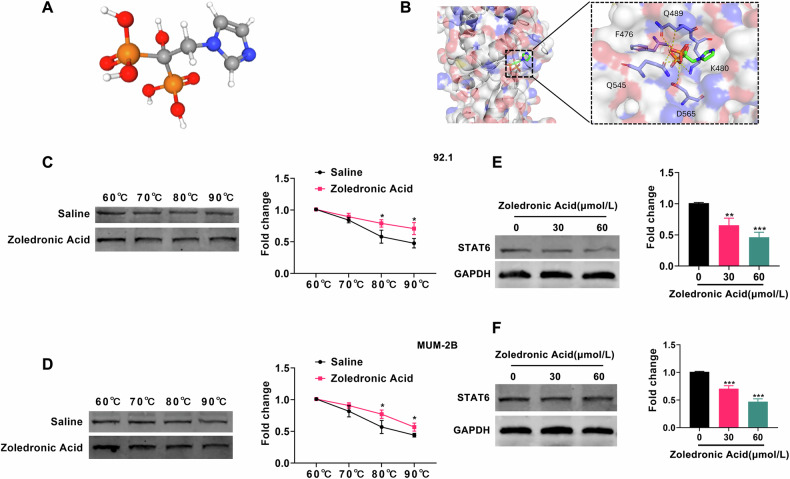
Compelling evidence has revealed a novel function of the STAT pathway in the pathophysiology of uveal melanoma (UM); however, its regulatory mechanisms remain unclear. Here, we analyzed the clinical prognostic value of STAT family genes in UM patients using bioinformatics approaches and found that high STAT6 expression is associated with poor prognosis. Furthermore, cellular experiments and a nude mouse model demonstrated that STAT6 promotes UM progression through the autophagy pathway both in vivo and in vitro. Next, RIP-PCR revealed that STAT6 protein binds to LINC01637 mRNA, which in turn regulates STAT6 expression to promote UM growth. Finally, molecular docking indicated that STAT6 is a target of Zoledronic Acid, which can delay UM tumorigenicity by inhibiting STAT6 expression. Taken together, our results indicate that the STAT6/LINC01637 axis promotes UM progression via autophagy and may serve as a potential therapeutic target for UM.


Conflict of interest statement

The authors declare no competing interests.

Figures

Fig. 1
Fig. 1. Prognostic value of STAT family genes in UM.
A LASSO coefcients profles of 7 STAT family genes; (B) Using the minimum lambda value, LASSO regression with tenfold cross-validation identified 5 prognostic genes; (C) Distribution of STAT family gene model-based risk score; (D) Differences between high-risk and low-risk groups in survival status and survival time; (E) Heatmap of 5 prognostic gene expression profiles in low and high risk groups; (F) Kaplan–Meier survival curves for OS of patients in high and low risk group; (G) Time-dependent ROC analysis the of STAT family gene model.
Fig. 2
Fig. 2. STAT6 promotes the progression of UM in vivo and in vitro.
A, C The expression level of STAT6 mRNA in UM cells following STAT6 knockdown; (B, D) STAT6 knockdown was used to analyze the expression of STAT6 in UM cells through Western blotting; (EH) This analysis examined how the knockdown of STAT6 affected the proliferation, migration, and invasion of UM cells.; (I, K) The level of STAT6 mRNA expression in UM cells that were overexpressing STAT6; (J, L) STAT6 overexpression in UM cells was analyzed by Western blotting.; (MP) A comprehensive analysis of the proliferation, migration, and invasion of UM cells in vitro overexpressing STAT6; (Q) The volume of tumors formed in the LV-NC and LV-STAT6 groups was quantified; (R) The weight of tumors formed in the LV-NC group and the LV-STAT6 group were quantified. S The photographic images of tumors from the LV-NC and LV-STAT6 groups. (Scale bar: 100 µm; Data were presented as the mean ± SD; n = 3–6; *p < 0.05, **p < 0.01, ***p < 0.001).
Fig. 3
Fig. 3. STAT6 promotes the growth of UM cells by inhibiting autophagy.
A, B The expression level of LC3, STAT6, and P62 were analyzed by Western blotting in the LV-NC group and LV-STAT6 group following treatment with either DMSO or rapamycin; (CF) The analysis of proliferation, migration, and invasion of the LV-NC group and LV-STAT6 group was conducted following treatment with either DMSO or rapamycin. (Scale bar: 100 µm; Data were presented as the mean ± SD; n = 3; *p < 0.05, **p < 0.01, ***p < 0.001).
Fig. 4
Fig. 4. LINC01637 binds to STAT6 protein and regulates STAT6 expression.
A, E Relative enrichment of LINC01637 mRNA associated with STAT6 protein was identified by RIP assays. The IgG group was a negative control to preclude nonspecific binding; (B, F) Agarose gel electrophoresis results by using RT-qPCR products from RIP assays; (C, G) The levels of LINC01637 and STAT6 mRNA were measured in UM cells after suppressing LINC01637; (D, H) The levels of LINC01637 and STAT6 mRNA were measured in UM cells that had an increased expression of LINC01637; (I, K) STAT6 in UM cells was analyzed by Western blotting, specifically focusing on the cells with LINC01637 knockdown; (J, L) Results from a Western blotting study of STAT6 in LINC01637-overexpressing UM cells. (Data were presented as the mean ± SD; n = 3; *p < 0.05, **p < 0.01, ***p < 0.001).
Fig. 5
Fig. 5. LINC01637 promotes the progression of UM in vivo and in vitro.
A, C The level of LINC01637 mRNA in UM cells with reduced expression of LINC01637; (B, D) Analysis of the proliferation of UM cells with LINC01637 knockdown by CCK8 assay; (E, G) The level of LINC01637 mRNA in UM cells that have an increased amount of LINC01637; (F, H) Analysis of the proliferation of UM cells overexpressing LINC01637 by CCK8 assay; (I, J) Examination of the migration and invasion of UM cells under LINC01637 knockdown; (K, L) Examination of the migration and invasion of UM cells overexpressing LINC01637; (M) The volume of tumors formed in the LV-NC group and LV-LINC01637 group; (N) The weight of tumors formed in the LV-NC group and LV-LINC01637 group; (O) Photographic images of tumors from the LV-NC group and LV-LINC01637 group; (Scale bar: 100 µm; Data were presented as the mean ± SD; n = 3–6; *p < 0.05, **p < 0.01, ***p < 0.001).
Fig. 6
Fig. 6. LINC01637 promotes the growth of UM by regulating STAT6.
A, B Western blot analysis was performed to examine the expression of STAT6 in the LV-NC group and LV-STAT6 group, which were supplemented with Sh-NC and Sh-LINC01637; (CF) An investigation was conducted to examine the proliferation, migration, and invasion of two groups: the LV-NC group and the LV-STAT6 group. Both groups were supplemented with Sh-NC or Sh-LINC01637; (G) The volume of tumors formed in the LV-STAT6/Sh-NC group and LV-STAT6/Sh-LINC01637 group; (H) The weight of tumors formed in the LV-STAT6/Sh-NC group and LV-STAT6/Sh-LINC01637 group; (I) Photographs of tumors from the LV-STAT6/Sh-NC group and LV-STAT6/Sh-LINC01637 group. (Scale bar: 100 µm; Data were presented as the mean ± SD; n = 3–6; *p < 0.05, **p < 0.01, ***p < 0.001).
Fig. 7
Fig. 7. STAT6 is the drug target of Zoledronic Acid.
A The 3D structural diagram of Zoledronic Acid; (B) The molecular docking simulations of STAT6 with Zoledronic Acid; (C, D) The detection of STAT6 expression in UM cells after saline or Zoledronic Acid treatment at different temperature; (E, F) The detection of STAT6 expression in UM cells after Zoledronic Acid treatment. (Data were presented as the mean ± SD; n = 3; *p < 0.05, **p < 0.01, ***p < 0.001).
Fig. 8
Fig. 8. Zoledronic Acid inhibits the progression of UM via STAT6 pathway.
A, B Western blot analysis was conducted to examine the expression of STAT6 in the LV-NC group and LV-STAT6 group following treatment with either saline or Zoledronic Acid; (CF) An investigation was conducted to assess the proliferation, migration, and invasion in the LV-NC group and LV-STAT6 group following treatment with either saline or Zoledronic Acid; (G) The volume of tumors formed in the LV-STAT6/Control group and LV-STAT6/Zoledronic Acid group; (H) The weight of tumors formed in the LV-STAT6/Control group and LV-STAT6/Zoledronic Acid group; (I) Photographs of tumors from the LV-STAT6/Control group and LV-STAT6/Zoledronic Acid group. (Control: saline; Scale bar: 100 µm; Data were presented as the mean ± SD; n = 3–6; *p < 0.05, **p < 0.01, ***p < 0.001).

References

    1. Carvajal RD, Sacco JJ, Jager MJ, Eschelman DJ, Olofsson Bagge R, Harbour JW, et al. Advances in the clinical management of uveal melanoma. Nat Rev Clin Oncol. 2023;20:99–115. - PubMed
    1. Rantala ES, Hernberg MM, Piperno-Neumann S, Grossniklaus HE, Kivelä TT. Metastatic uveal melanoma: the final frontier. Prog Retin Eye Res. 2022;90:101041. - PubMed
    1. Liu B, Yao X, Shang Y, Dai J. The multiple roles of autophagy in uveal melanoma and the microenvironment. J Cancer Res Clin Oncol. 2024;150:121. - PMC - PubMed
    1. Wespiser M, Neidhardt E, Negrier S. Uveal melanoma: in the era of new treatments. Cancer Treat Rev. 2023;119:102599. - PubMed
    1. Yeşiltaş YS, Oakey Z, Wrenn J, Yeaney G, Brainard J, Lorek B, et al. Uveal melanoma in African Americans: diagnostic challenges. Surv Ophthalmol. 2024;69:190–7. - PubMed

MeSH terms

LinkOut - more resources