. 2024 Oct 1;15(10):715.
doi: 10.1038/s41419-024-07095-6.

GPR56 facilitates hepatocellular carcinoma metastasis by promoting the TGF-β signaling pathway

Affiliations

GPR56 facilitates hepatocellular carcinoma metastasis by promoting the TGF-β signaling pathway

Yiming Luo et al. Cell Death Dis. .

Abstract

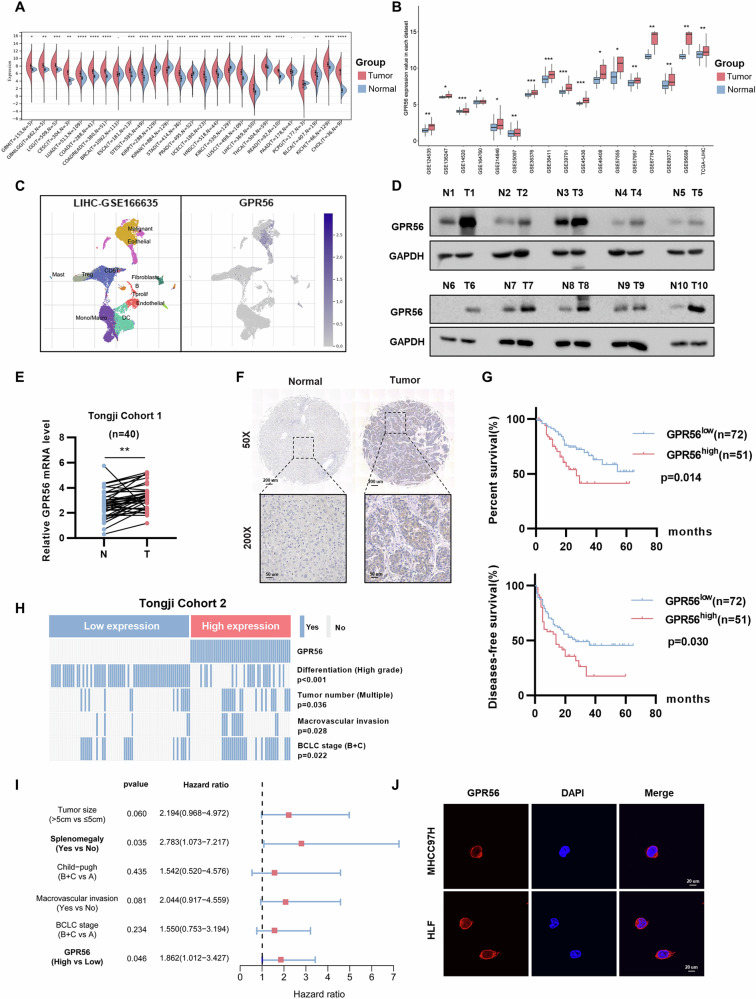
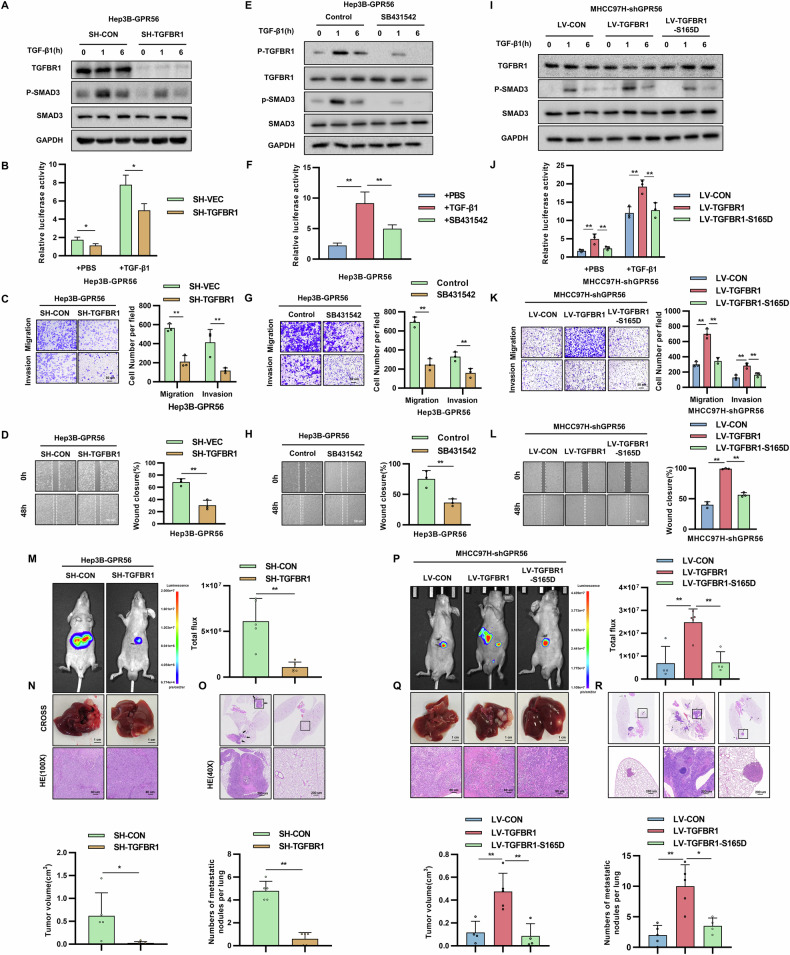
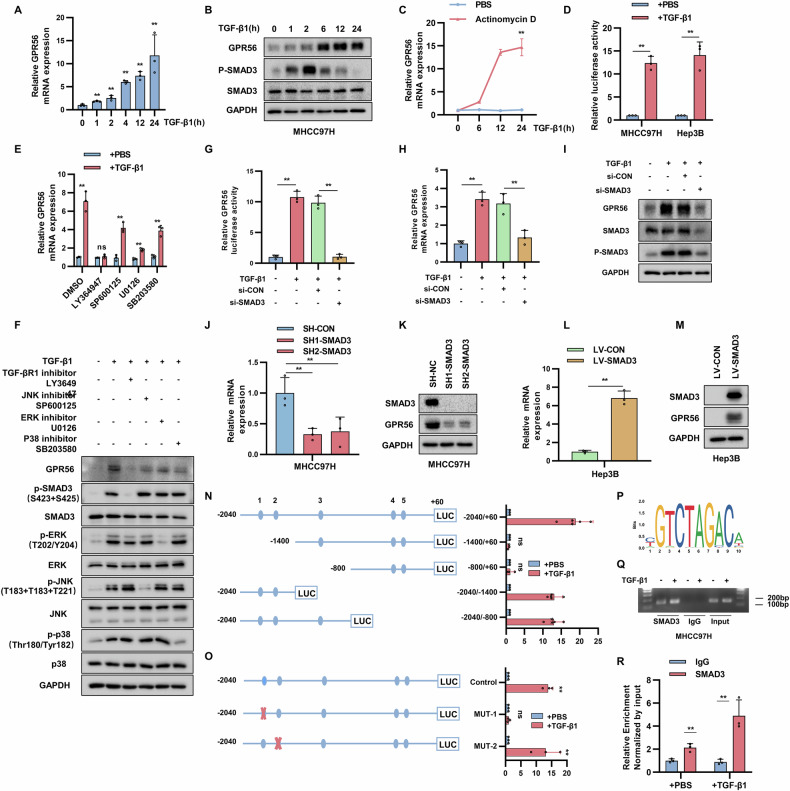
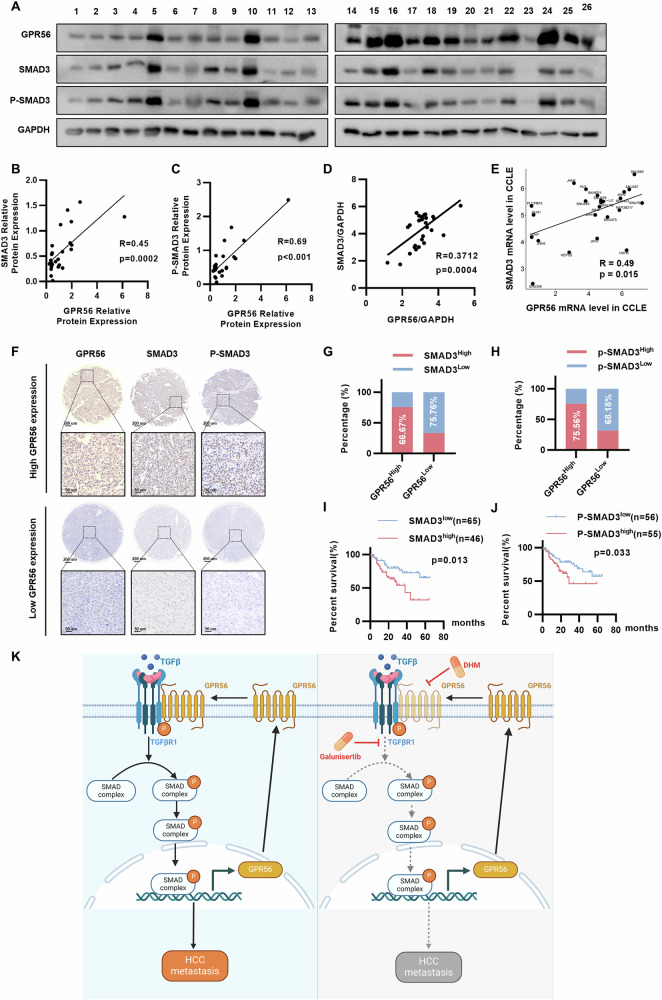
The metastasis of hepatocellular carcinoma (HCC) poses a significant threat to the survival of patients. G protein-coupled receptor 56 (GPR56) has garnered extensive attention within malignant tumor research and plays a crucial role in cellular surface signal transmission. Nonetheless, its precise function in HCC remains ambiguous. Our investigation reveals a notable rise in GPR56 expression levels in human HCC cases, with heightened GPR56 levels correlating with unfavorable prognoses. GPR56 regulates TGF-β pathway by interacting with TGFBR1, thereby promoting HCC metastasis. At the same time, GPR56 is subject to regulation by the canonical cascade of TGF-β signaling, thereby establishing a positive feedback loop. Furthermore, the combination application of TGFBR1 inhibitor galunisertib (GAL) and GPR56 inhibitor Dihydromunduletone (DHM), significantly inhibits HCC metastasis. Interventions towards this signaling pathway could offer a promising therapeutic approach to effectively impede the metastasis of GPR56-mediated HCC.


Conflict of interest statement

The authors declare no competing interests.

Figures

Fig. 1
Fig. 1. Increased GPR56 expression demonstrated a correlation with clinical outcomes among HCC patients.
A The GPR56 expression in pan-cancer. B The expression of GPR56 in 17 datasets of HCC from TCGA and GEO. C Expression of GPR56 in single cell sequencing dataset GSE166635. D, E Protein and mRNA levels of GPR56 in 40 paired HCC samples detected by WB and real-time qPCR. F Representative images of GPR56 IHC staining in normal tissues compared to HCC tissues. Scale bar: 200 µm (up), 50 µm (bottom) (G) Kaplan-Meier diagrams illustrating overall survival (OS) rates and recurrence-free survival (RFS) in different GPR56 expression groups in Tongji cohort. H Chi-square analysis of the relevance of GPR56 expression with differentiation, tumor number, macrovascular invasion and BCLC stage in HCC patients. I Multivariate regression analyses forest plot for HCC patients from the Tongji cohort. J Subcellular localization of GPR56 by immunofluorescence (IF). The representation includes data and error bars, demonstrating the mean ± standard deviation from three separate independent trials. Significance levels are indicated as follows: *p < 0.05, **p < 0.01, ***p < 0.001, and “ns” indicating no statistical significance. The data were analyzed utilizing Student’s t-tests.
Fig. 2
Fig. 2. GPR56 facilitated the metastatic progression of HCC in both in vitro and in vivo.
A, B Representative images (A) and the rate of wound closure (B) from the wound healing assay with MHCC97H and Hep3B. C, D Representative images (C) and number of cells (D) from migration and invasion assays with MHCC97H with MHCC97H and Hep3B. EH Fluorescence images representative of the samples (E), radiance (F), representative HE images (G), and count of lung metastasis nodules (H) from SH-VEC, SH-GPR56, LV-CON and LV-GPR56 groups in tail vein injection metastasis model; scale bar: 2 mm (4×), 200 mm (40×). IN Fluorescence images representative of the samples (I), radiance (J), gross image (K), count of HCC metastasis nodules (L), representative HE images of lung metastasis(M), number of lung metastasis nodules (N) from SH-VEC, SH-GPR56, LV-CON and LV-GPR56 groups in the orthotopic liver model metastasis model; scale bar: 1 cm (K), 200 µm (40×), 80 µm (100×). The representation includes data and error bars, demonstrating the mean ± standard deviation from three separate independent trials. Significance levels are indicated as follows: *p < 0.05, **p < 0.01, ***p < 0.001, and “ns” indicating no statistical significance. The data were analyzed utilizing Student’s t-tests.
Fig. 3
Fig. 3. GPR56 exhibited upregulation of the TGF-β pathway and interaction with TGFBR1.
A KEGG analysis of differentially expressed genes between GPR56 overexpressing cells and control cells. B GSEA analysis of TGF-β pathway grouped by GPR56 expression in TCGA-LIHC. C Relative luciferase activity of SBE in different groups. D, E Expression of p-SMAD2/3 in TGF-β1-stimulated GPR56 knockdown MHCC97H and GPR56 overexpressing Hep3B. F Silver staining of GPR56 overexpressing cells. G The peptide fragment of TGFBR1 identified through mass spectrometric analysis. H Co-immunoprecipitation (Co-IP) and western blot of exogenous proteins GPR56 and TGFBR1 in 293 T cells. I Co-IP and western blot of endogenously proteins GPR56 and TGFBR1 in MHCC97H cells. J Purified recombinant gpr56 shows direct interaction with TGFBR1 in GST pull-down assay. K Representative confocal immunofluorescence images (bar = 5 μm). L Endogenous Co-IP experiments in MHCC97H cells, with or without TGF-β1 treatment for 1 h. M The expression of TGFBR1-pS165 in 293 T cells. The representation includes data and error bars, demonstrating the mean ± standard deviation from three separate independent trials. Significance levels are indicated as follows: *p < 0.05, **p < 0.01, ***p < 0.001, and “ns” indicating no statistical significance. The data were analyzed utilizing Student’s t-tests.
Fig. 4
Fig. 4. GPR56 promoted HCC metastasis by TGFBR1.
Western blot (A), SBE luciferase activity (B), representative images of wound healing experiments (C) and representative images of migration or invasion assays (D) after TGFBR1 knockdown in LV-GPR56 Hep3B cells. EH Western blot (E), SBE luciferase activity (F), representative images of wound healing experiments (G) and representative images of migration or invasion assays (H) in Hep3B cells treated with TGFBR1 phosphorylation inhibitor SB431542. IL Western blot (I), SBE luciferase activity (J), representative images of wound healing experiments (K) and representative images of migration or invasion assays (L) after TGFBR1-WT or TGFBR1-S165D overexpression on the basis of GPR56 knockdown of MHCC97H cells. MO Representative fluorescence images (M), gross image (N), representative HE images of lung metastasis (O) after TGFBR1 knockdown in LV-GPR56 Hep3B cells in the orthotopic liver metastasis model. PR Representative fluorescence images (P), gross image (Q), representative HE images of lung metastasis (R) after TGFBR1-WT or TGFBR1-S165D overexpression on the basis of GPR56 knockdown in the orthotopic liver model metastasis mode comprised of MHCC97H cells. Scale bar: 1 cm (H, K), 200 µm (40×), 80 µm (100×), 50 µm (200×). The representation includes data and error bars, demonstrating the mean ± standard deviation from three separate independent trials. Significance levels are indicated as follows: *p < 0.05, **p < 0.01, ***p < 0.001, and “ns” indicating no statistical significance. The data were analyzed utilizing Student’s t-tests.
Fig. 5
Fig. 5. TGF-β1/SMAD3 pathway regulates GPR56 transcription.
A, B Real-time qPCR analysis and Western blot of GPR56 levels of MHCC97H cells stimulated by TGF-β1. C mRNA levels of GPR56 in MHCC97H cells treated with TGF-β1 (5 ng/mL) combined with actinomycin D (1 mg/mL). D The luciferase activity of MHCC97H and Hep3B cells transfected with pGL4.17-GPR56 (−2040/ + 60) treated with or without TGF-β1. E, F mRNA levels and protein levels of GPR56 in MHCC97H cells treated with TGF-β1 along with various inhibitors. GI Luciferase reporter, real-time qPCR, and Western blot assays were performed to assess GPR56 promoter activity and expression levels. JM Real-time qPCR, and Western blot analysis of GPR56 expression. NO The luciferase activity in 293 T cells transfected with truncated and mutated GPR56 promoter stimulated with TGF-β1. P Schematic of the putative SBE binding motif. Q, R Chromatin immunoprecipitation assays targeting anti-SMAD3, coupled with real-time qPCR in MHCC97H cells with or without TGF-β1. The representation includes data and error bars, demonstrating the mean ± standard deviation from three separate independent trials. Significance levels are indicated as follows: *p < 0.05, **p < 0.01, ***p < 0.001, and “ns” indicating no statistical significance. The data were analyzed utilizing Student’s t-tests.
Fig. 6
Fig. 6. Combined treatment of TGFBR1 inhibitor GAL and GPR56-specific small molecule inhibitor DHM dramatically decreased GPR56-driven HCC metastasis.
A The diagram of combined treatment in node mice. B Representative Gross images. C Tumor volume analysis. D Survival curves of mice in different treatment groups. E Representative Bioluminescence images. F Radiance analysis. G, H Representative HE and p-SMAD3 staining images with result of positive rate. I, J Representative HE images of lung metastasis and number of lung metastasis nodules. Scale bar: 1 cm (B), 200 µm (40×), 20 µm (400×). The representation includes data and error bars, demonstrating the mean ± standard deviation from three separate independent trials. Significance levels are indicated as follows: *p < 0.05, **p < 0.01, ***p < 0.001, and “ns” indicating no statistical significance. The data were analyzed utilizing Student’s t-tests.
Fig. 7
Fig. 7. GPR56 and SMAD3/p-SMAD3 have similar expression characteristics in HCC.
A Western blot of GPR56 and SMAD3/p-SMAD3 in HCC tissues. B, C Correlation analysis between GPR56 and pSMAD3/SMAD3 protein levels. D Correlation analysis between GPR56 and SMAD3 mRNA expression. E Correlation analysis between GPR56 and SMAD3 mRNA levels in HCC cell lines sourced from the Cancer Cell Line Encyclopedia database. F Representative IHC staining images of GPR56, SMAD3 and p-SMAD3 in Tongji cohort. Scale bar: 200 µm (up), 50 µm (bottom). G, H Correlation analysis of GPR56 with SMAD3/p-SMAD3 in Tongji cohort. I, J Kaplan-Meier analysis of SMAD3 or p-SMAD3 expression and overall survival in Tongji cohort. K Schematic diagram of positive feedback loop of GPR56 in the TGF-β pathway in HCC. The representation includes data and error bars, demonstrating the mean ± standard deviation from three separate independent trials. Significance levels are indicated as follows: *p < 0.05, **p < 0.01, ***p < 0.001, and “ns” indicating no statistical significance. The data were analyzed utilizing Student’s t-tests.

References

    1. Llovet JM, Kelley RK, Villanueva A, Singal AG, Pikarsky E, Roayaie S, et al. Hepatocellular carcinoma. Nat Rev Dis Prim. 2021;7:6. - PubMed
    1. Moon AM, Singal AG, Tapper EB. Contemporary epidemiology of chronic liver disease and cirrhosis. Clin Gastroenterol hepatology: Off Clin Pract J Am Gastroenterological Assoc. 2020;18:2650–66. - PMC - PubMed
    1. Principe DR, Doll JA, Bauer J, Jung B, Munshi HG, Bartholin L, et al. TGF-β: duality of function between tumor prevention and carcinogenesis. J Natl Cancer Inst. 2014;106:djt369. - PMC - PubMed
    1. Hata A, Chen YG. TGF-β signaling from receptors to Smads. Cold Spring Harb Perspect Biol. 2016;8:a022061. - PMC - PubMed
    1. Zi Z. Molecular Engineering of the TGF-β Signaling Pathway. J Mol Biol. 2019;431:2644–54. - PubMed

MeSH terms

LinkOut - more resources