. 2024 Oct 1;15(1):8479.
doi: 10.1038/s41467-024-52773-w.

Endosomal fusion of pH-dependent enveloped viruses requires ion channel TRPM7

Affiliations

Endosomal fusion of pH-dependent enveloped viruses requires ion channel TRPM7

Catherine A Doyle et al. Nat Commun. .

Abstract

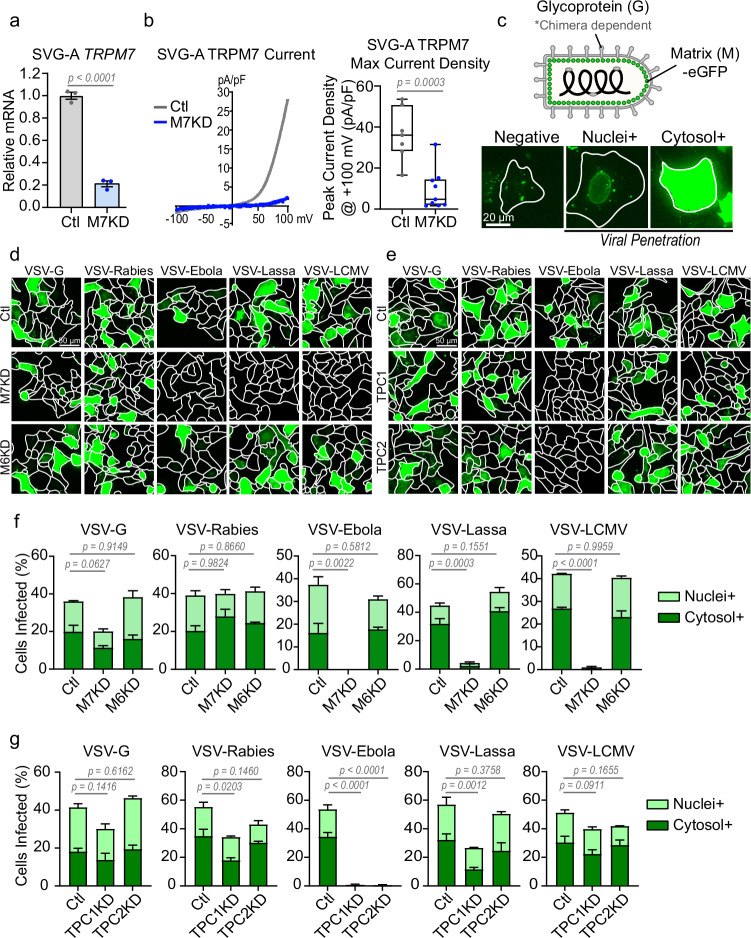
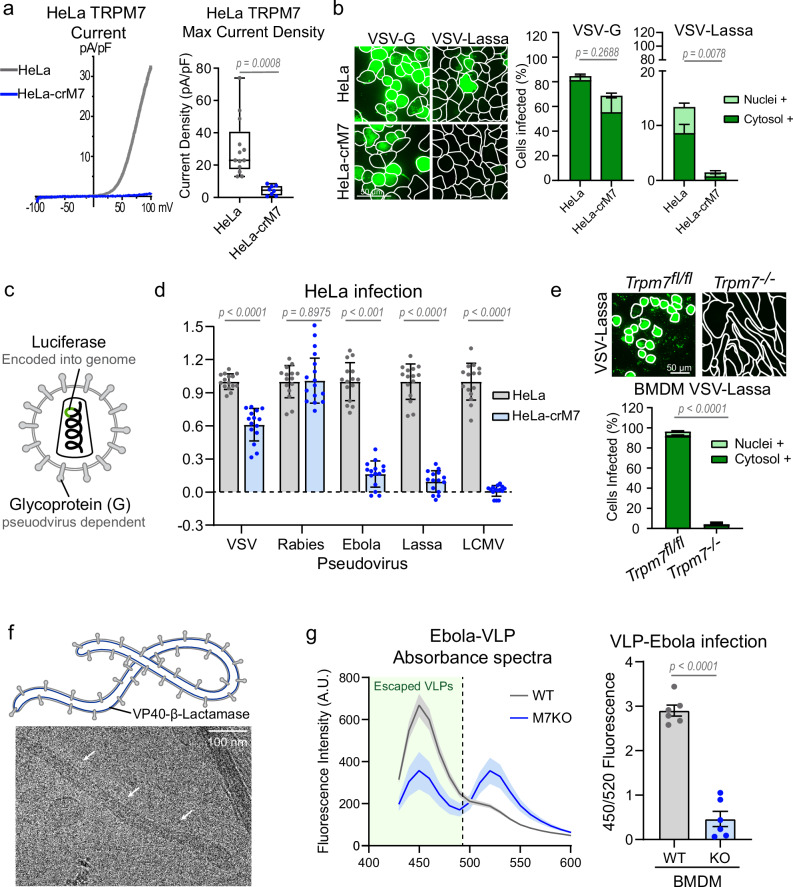
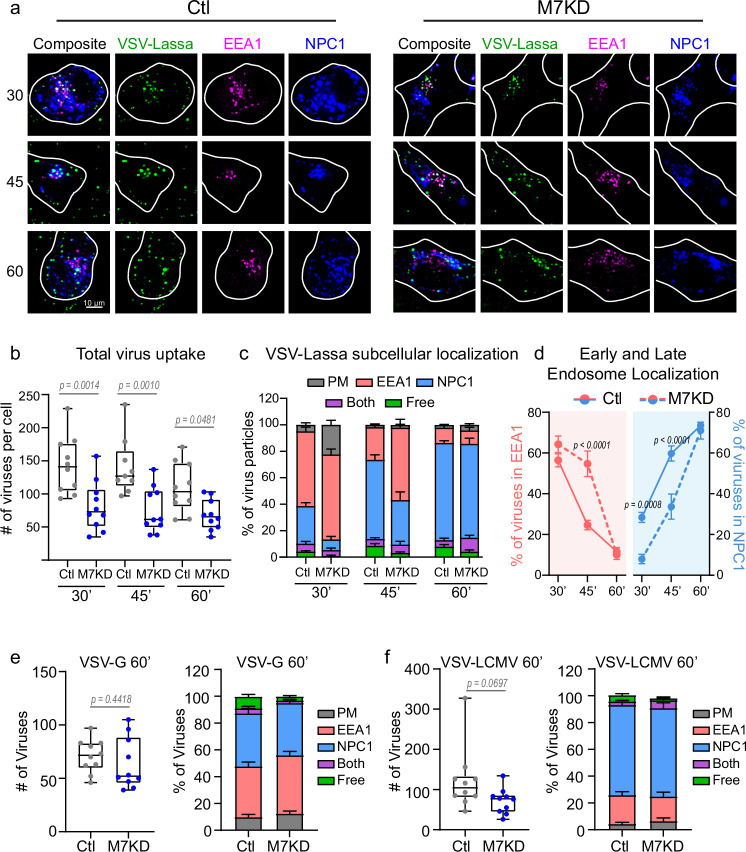
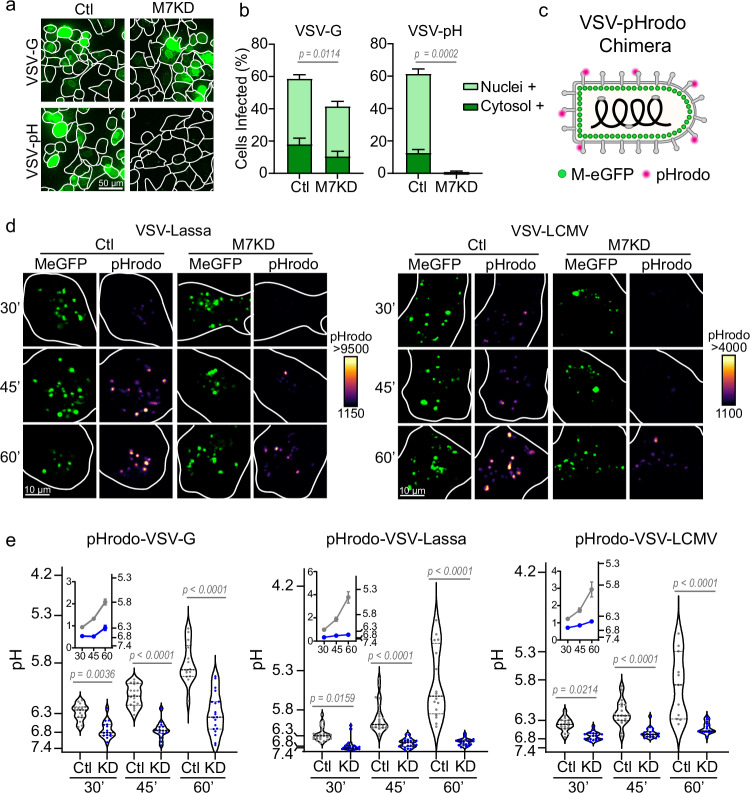
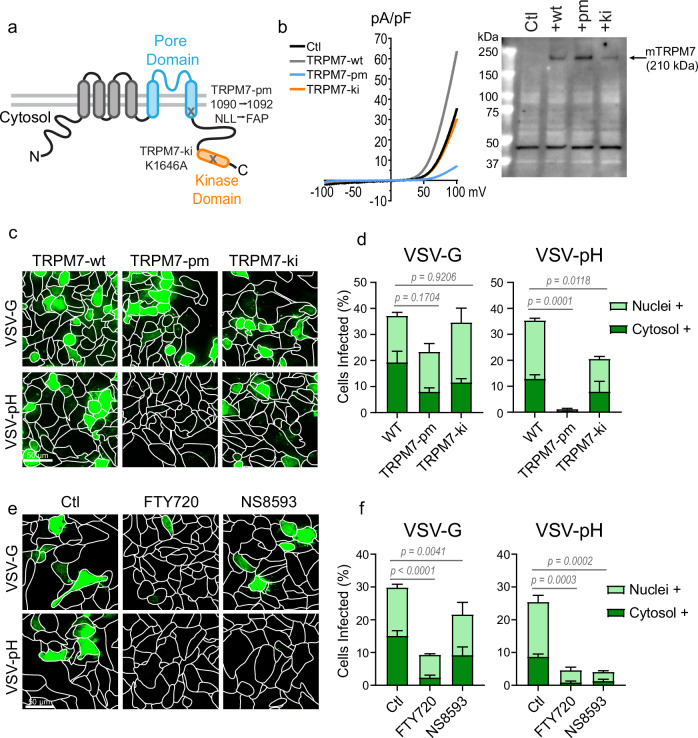
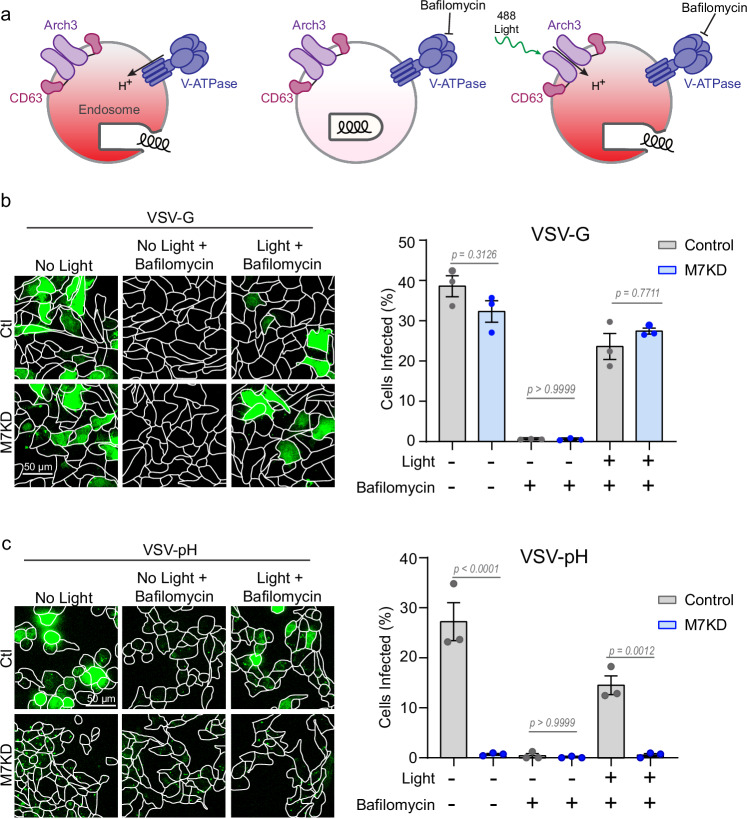
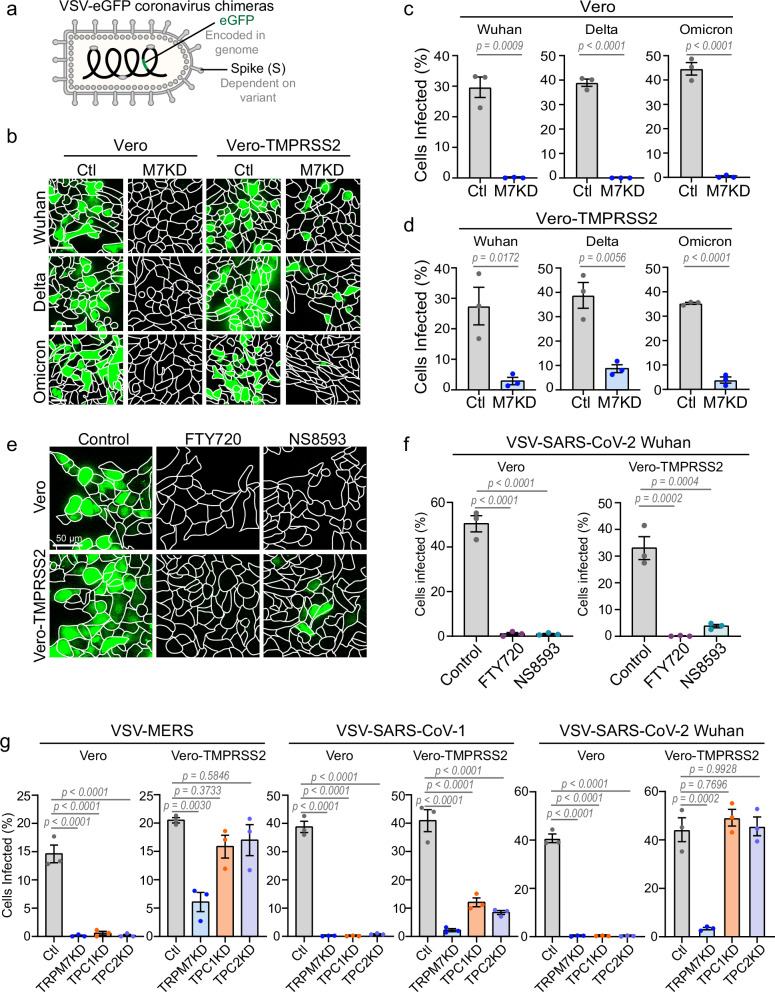
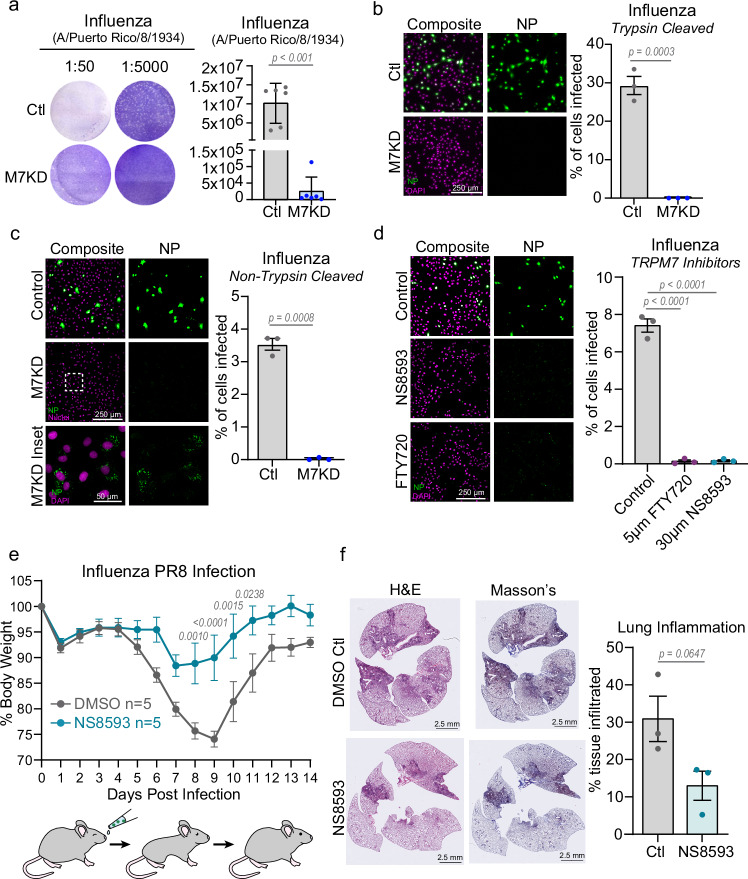
The majority of viruses classified as pandemic threats are enveloped viruses which enter the cell through receptor-mediated endocytosis and take advantage of endosomal acidification to activate their fusion machinery. Here we report that the endosomal fusion of low pH-requiring viruses is highly dependent on TRPM7, a widely expressed TRP channel that is located on the plasma membrane and in intracellular vesicles. Using several viral infection systems expressing the envelope glycoproteins of various viruses, we find that loss of TRPM7 protects cells from infection by Lassa, LCMV, Ebola, Influenza, MERS, SARS-CoV-1, and SARS-CoV-2. TRPM7 ion channel activity is intrinsically necessary to acidify virus-laden endosomes but is expendable for several other endosomal acidification pathways. We propose a model wherein TRPM7 ion channel activity provides a countercurrent of cations from endosomal lumen to cytosol necessary to sustain the pumping of protons into these virus-laden endosomes. This study demonstrates the possibility of developing a broad-spectrum, TRPM7-targeting antiviral drug to subvert the endosomal fusion of low pH-dependent enveloped viruses.


Conflict of interest statement

S.P.J.W. is a consultant for Thylacine Biosciences and receives support from Vir Biotechnology to study the properties of VSV-coronavirus chimeras unrelated to this project. J.S. receives support for research unrelated to this project from Icosavax. The remaining authors declare no competing interests.

Figures

Fig. 1
Fig. 1. Loss of TRPM7 broadly inhibits infection by various VSV-chimeras.
a qRT-PCR of TRPM7 in control non-targeting (gray, Ctl) and TRPM7 (blue, M7KD) siRNA treated SVG-A cells from independent transfections. P values determined by two-tailed Student’s t test. Mean, and SEM plotted, n = 3. b (Left) Representative whole-cell patch-clamp recordings shown as current-voltage (IV) relationship. The IVs of Control (gray) and TRPM7 KD (blue) SVG-A cells are overlayed. (Right) A quantitative summary of peak current densities from individual cells at +100 mV is shown (Ctl n = 7, M7KD n = 9 cells). P values determined by two-tailed Student’s t test. Median, 25th, and 75th quartiles are shown with maximum and minimum. c (Top) Schematic of VSV-chimeras used for viral infection assays. Chimeras express the glycoprotein of the indicated viruses. All viruses express MeGFP fusion protein. (Bottom) Viruses that have penetrated the cytosol release MeGFP which subsequently binds to nuclear pores (nuclei+). As viral genomes are translated, MeGFP accumulates in the cytosol (cytosol+). Cytosol+ and nuclei+ are both representative of successful viral escape from the endosomes into the cytosol. Representative images from two independent experiments are shown. d Representative maximum projection fluorescence microscopy images of viral infection (eGFP) in control (Ctl), TRPM7 knockdown (M7KD), and TRPM6 knockdown (M6KD) SVG-A cells. e Representative maximum projection fluorescence microscopy images of viral infection (eGFP) in control (Ctl), TPC1 knockdown (TPC1KD), and TPC2 knockdown (TPC2KD) SVG-A cells. f Quantification of viral penetration in control, M7KD, and M6KD cells by various VSV-chimeras at 6 hours post-infection. Percentage of nuclei+ (light green) and cytosol+ (dark green) cells together represent total virus-infected cells. Mean and SEM plotted of average infection across three independent infections. P values (one-way ANOVA with Tukey’s multiple comparison test) are respective to total viral infection values. g Quantification of virus penetration in control, TPC1KD, and TPC2KD cells by indicated VSV-chimeras at 6 hours post-infection. Percentage of nuclei+ (light green) and cytosol+ (dark green) cells represent total virus-infected cells. Mean and SEM plotted of average infection across three independent infections. P values (one-way ANOVA with Tukey’s multiple comparison test) are respective to total viral infection values.
Fig. 2
Fig. 2. Loss of TRPM7 protects a variety of cell types from various enveloped viral infections.
a Representative whole cell patch clamp recordings shown as current-voltage (IV) relationship of HeLa (gray) and HeLa-crM7 (blue) wherein Trpm7 was deleted by Crispr-cas9. Quantitative summaries of peak current densities at +100 mV are shown to the right (HeLa n = 13, HeLa-crM7 n = 8). P values determined by two-tailed Student’s t test. Median, 25th, and 75th quartiles are shown, as well as maximum and minimum. b (Left) Representative 20 μm maximum intensity projection of HeLa and HeLa-crM7 cells infected with VSV-G and VSV-Lassa. (Right) Quantification of nuclei+ and cytosol+ infected cells. P values determined by two-tailed Student’s t test of total positive cells. Each experiment is plotted as the average percent infected across multiple fields of view, n = 3. Mean and SEM are plotted. c Schematic of lenti-pseudovirus expressing various enveloped virus glycoproteins. Each pseudovirus genome encodes luciferase. d Relative luciferase luminescence of lenti-pseudovirus infected HeLa cells. Graph shows data points from three independent experiments with five well replicates of HeLa (gray) and HeLa-crM7 (blue). Data points were normalized to average control HeLa luciferase intensity per experiment. P values determined by two-tailed Student’s t test, n = 15. Mean and standard deviation are plotted. e (Left) Representative images of infection Trpm7fl/fl and Trpm7−/− BMDMs with VSV-Lassa. WGA outlines are shown. (Right) Quantification of average percent infected from n = 3 independent experiments. P values determined by two-tailed Student’s t test of total positive cells. Mean and SEM are plotted. f (Top) Schematic of ebola virus-like particle (VLP) expressing membrane-bound VP40 tagged with β-lactamase. (Bottom) Cryo-EM of ebola VLP. White arrows indicate one VLP. The cryo-EM image shown is representative of multiple VLPs observed in two independent sample preparations. g (Left) Spectrum of β-lactamase intensity of WT (gray) and TRPM7 KO (blue) BMDMs at 400 nm excitation. Mean and SEM are plotted. β-lactamase tagged VP40 from cytosolic-penetrated VLPs can cleave CCF-2 AM dye, decreasing FRET 520 nm signal and increasing 450 nm signal. (Right) Average ratio of 450 nm to 520 nm emission is plotted. Two-tailed Student’s t test was used to determine p values. Mean and standard errors are shown. n = 6.
Fig. 3
Fig. 3. Viruses traffic through the endosomal maturation pathway in TRPM7 depleted cells.
a Representative images of VSV-Lassa-MeGFP infected Control (Ctl) and TRPM7 knockdown (M7KD) SVG-A cells. Early endosomes are tagged with EEA1-mScarlet (magenta), late endosomes/lysosomes with NPC1-Halo-JFX647 (blue). Cells were incubated with VSV-Lassa-MeGFP for 20 minutes, washed, and imaged at 30-, 45-, and 60-minutes post-infection. Maximum projection of 1.08 μm is shown. b Box and whisker plot of total number of virus particles detected per cell at each time point in Control (gray) and M7KD (blue) cells at 30-, 45-, and 60-minutes post-infection. Median, quartiles, maximum, and minimum are shown. P values determined by two-way ANOVA with Sidak multiple comparisons test. For control-treated cells at 30, 45, and 60 minutes, N = 10, 9, 10. For all M7KD timepoints, N = 10. Same cells are used for analysis in (c, d). c Average percent of viruses localizing to the cell surface (gray), early endosome (red, EEA1), late endosome (blue, NPC1), or free in cytosol (green) per cell at 30-, 45-, and 60-minutes post-infection. Some viruses localized to endosomes that were EEA1+ and NPC1+ (both, purple). Mean and SEM plotted. d Average percent of viruses per cell in early (red) and late (blue) endosomes. Control cells are represented by solid lines, while M7KD cells are represented with dashed lines. Mean and SEM are shown. P values determined by two-way ANOVA with Sidak multiple comparisons test. e (Left) Box and whisker plot of VSV-G particle uptake at 60 minutes post-infection in Control (gray) and M7KD (blue) cells. Median, quartiles, maximum, and minimum are shown. P values determined by two-tailed Student’s t test. (Right) Subcellular localization in Control and M7KD SVG-A cells at 60 minutes post-infection. n = 10 cells per condition. Mean and SEM plotted. f (Left) Box and whisker plot of total VSV-LCMV viral uptake at 60 minutes post-infection in Control (gray) and M7KD (blue) cells. Median, quartiles, maximum, and minimum are shown. P values determined by two-tailed Student’s t test. (Right) Subcellular localization in Control and M7KD SVG-A cells at 60 minutes post-infection. n = 10 cells per condition. Mean and SEM plotted.
Fig. 4
Fig. 4. TRPM7 regulates viral endosome acidification.
a Representative maximum projections of Control (Ctl) and TRPM7 knockdown (M7KD) SVG-A cells infected by parental VSV-G or the VSV pH-sensitive mutant, VSV-V269H. Cells were fixed 6 hours post-infection. b Quantification of VSV-G and VSV-pH sensitive mutant infection. Percent of Nuclei+ cells are shown in light green and Cytosol+ cells in dark green. P values determined from two-tailed Student’s t test of total positive cells from three independent infection assays. Mean and SEM are plotted. c Schematic of pHrodo-tagged VSV-chimera viruses expressing MeGFP. d Representative images of MeGFP and pHrodo signal time course in Ctl and M7KD SVG-A cells. VSV-Lassa-MeGFP or VSV-LCMV-MeGFP is shown in green. pHrodo signal is shown pseudo-colored based on the intensity spectrum, with black/purple being the lower intensity and yellow being the highest intensity. Images are 2.43 μm maximum projections. e Single particle quantification of the viral endosome pH at 30-, 45-, and 60 minutes following virus incubation. Control (Ctl) cells are shown in gray and TRPM7 knockdown (KD) cells in blue. Each data point represents the average pH of all virus particles detected across a single cell. Violin plots display median (thick dotted line) as well as 25th and 75th quartiles (thin dotted lines). P values are determined by two-way ANOVA with Sidak multiple comparisons test. Inset graphs show mean pH per cell over time with SEM. At 30, 45, and 60 minutes VSV N = 15, 18, 14; Lassa N = 25, 22; 16; LCMV N = 17, 19, 11 for control cells and VSV N = 15, 15, 19; Lassa N = 24, 23, 20; LCMV N = 19, 20, 18 for M7KD cells.
Fig. 5
Fig. 5. Ion channel activity of TRPM7 is required for pH-sensitive virus infection.
a Diagram of TRPM7 domains with annotations of pore mutant (pm) and kinase-inactive (ki) mutations. b (Left) Whole-cell patch-clamp recordings shown as current-voltage (IV) relationship of mouse TRPM7 constructs expressing SVG-A cells. The IV of non-transfected (black), wild-type (TRPM7-wt, dark gray), pore mutant (TRPM7-pm, blue), and kinase-inactive (TRPM7-ki, orange) transfected SVG-A cells are overlayed. (Right) Immunoblot of membrane fraction of non-transfected SVG-A cells (ctl) and cells transfected with mouse TRPM7-wt, -pm, and -ki constructs. Immunoblotting is done with an anti-mouse TRPM7 antibody which does not detect human TRPM7. A non-specific band seen at 45 kDa is used as a loading control. The immunoblot results were reproduced in two independent experiments. c Representative maximum projection (20 μm) images of VSV-G and VSV-pH infections (green) in SVG-A cells ectopically expressing the TRPM7 variants: wild-type (TRPM7-wt), pore mutant (TRPM7-pm), or kinase-inactive (TRPM7-ki). d Quantification of infection in SVG-A cells ectopically expressing TRPM7-wt, TRPM7-pm, and TRPM7-ki variants. Cells were infected with either parental VSV-G or VSV-pH. Percent cytosolic+ (dark green) and nuclei+ (light green) cells are shown. Averages are derived from three independent infections. P values were determined from total cells infected by one-way ANOVA with Tukey’s multiple comparison test. Mean and SEM are plotted. e Representative maximum projection (20 μm) images of VSV-G and VSV-pH infections (green) in SVG-A cells treated with TRPM7 inhibitors FTY720 and NS8593 at 5 µM or 30 µM respectively. The inhibitors were added to the cells 15 minutes prior to infection and are present throughout infection. f Quantification of VSV-G and VSV-pH infection of SVG-A cells in the presence of TRPM7 inhibitors FTY720 (5 μM) and NS8593 (30 μM). Percent cytosolic+ (dark green) and nuclei+ (light green) are shown. Averages are derived from three independent infections. P values were determined from total cells infected by one-way ANOVA with Tukey’s multiple comparison test. Mean and SEM are plotted.
Fig. 6
Fig. 6. TRPM7 modulates proton pumping into the lumen of the viral endosome.
a Diagram showing the use of the optogenetic tool Arch3, a light-activated proton pump that can be used to acidify endosomes in the presence of Bafilomycin. Arch3 fused to CD63 is targeted to late endosome/lysosomes. Normally, the endogenous V-ATPase pumps protons to acidify the endosomal lumen and this enables the virus to escape the endosome (left). When cells are treated with V-ATPase inhibitor Bafilomycin (50 nM), the endosome fails to acidify, and the virus stays in the endosomes (middle). But even in the presence of Bafilomycin, light-mediated activation of Arch3 acidifies the endosome and enables the virus to enter the cytosol (right). b Maximum projections of Arch3-CD63 expressing, Ctl (gray) and TRPM7 knockdown (M7KD, blue) SVG-A cells infected with VSV-G. Cells were treated with Bafilomycin (50 nM) and/or exposed to 15 µWatt 488 nm laser (60 seconds). Quantification of cells positive for infection (green) from three independent infections is shown in the right panel. P values determined by one-way ANOVA with Tukey’s multiple comparison analysis. Mean and SEM is plotted. c Maximum projections of Arch3-CD63 expressing Ctl (gray) and M7KD (blue) SVG-A cells infected with VSV-pH mutant with or without Bafilomycin (50 nM) or light stimulation (15 µWatt 488 nm, 60 seconds). Quantification of total cells positive for infection (green) from three independent infections is shown in the right panel. P values determined by one-way ANOVA with Tukey’s multiple comparison analysis. Mean and SEM is plotted.
Fig. 7
Fig. 7. Loss or inhibition of TRPM7 is protective against SARS-CoV-2 and other coronavirus infection.
a Schematic of VSV-coronavirus chimera construct with genetically encoded eGFP that is transcribed upon infection. Different variant-specific spike proteins were expressed as the envelope glycoprotein. b Maximum projection of cells infected with VSV-SARS-CoV-2-eGFP variants (green). Vero cells +/- TMPRSS2 were transfected with Control (Ctl) and TRPM7 siRNA (M7KD). Cells were then infected with VSV-SARS-CoV-2-eGFP expressing the Spike protein of the Wuhan, Delta, or Omicron variants. Cells were incubated with virus for 8 hours before fixation and imaging. The scale bar at the bottom left of the images is representative of 50 µm for all images across each row. c Quantification VSV-SARS-CoV-2-eGFP variant infections in control (gray) and M7KD (blue) Vero cells. Cells were infected with VSV pseudotyped with Wuhan, Delta, and Omicron spike variants. P values determined by two-tailed Student’s t test. n = 3 independent experiments. Mean and SEM plotted. d Quantification of infection in Vero cells stably overexpressing TMPRSS2 with VSV-SARS-CoV-2-eGFP variants in control (gray) and M7KD (blue) cells. P values determined by two-tailed Student’s t test. n = 3 independent experiments. Mean and SEM is plotted. e Maximum projection (20 μm) of Vero and Vero-TMPRSS2 cells infected with VSV-SARS-CoV-2-eGFP Wuhan strain in the presence of 5 μM FTY720 or 30 μM NS8593. Cells were pretreated with FTY720 and NS8593 for 15 minutes before exposure to virus and throughout the infection assay. f Quantification of VSV-SARS-CoV-2-eGFP infection in Vero and Vero-TMPRSS2 cells in the presence of 5 μM FTY720 (purple) or 30 μM NS8593 (teal) or without drug (gray). P values were determined by one-way ANOVA with Tukey’s multiple comparison test. n = 3 independent experiments. Mean and SEM plotted. g Quantification of infection by VSV-MERS, VSV-SARS-CoV-1, and VSV-SARS-CoV-2 Wuhan variant in Control (Ctl), TRPM7 (M7KD), TPC1 (TPC1KD), and TPC2 (TPC2KD) knockdown Vero cells. Infection assays were performed in parental Vero cells and Vero cells stably overexpressing TMPRSS2. P values determined by one-way ANOVA with Tukey’s multiple comparison test. n = 3 independent experiments. Mean and SEM plotted.
Fig. 8
Fig. 8. Inhibition of TRPM7 ion channel activity protects from Influenza infection in vitro and in vivo.
a Plaque assay of Influenza A/Puerto Rico/8/1934 at two different dilutions. Viruses were propagated in Control (Ctl, gray) or TRPM7 knockdown (M7KD, blue) cells, and plaque assays were performed with parental Vero cells. P values determined by two-tailed Student’s t test. n = 6 independent plaque assays. Mean and standard deviation are plotted. b (Left) First round trypsin-cleaved influenza infection in control and M7KD Vero cells stained for influenza nucleoprotein (NP, green). Individual cells are identified by DAPI staining (Magenta). (Right) Quantification of percent cells infected in Ctl and M7KD vero cells. P values determined by two-tailed Student’s t test. n = 3 independent experiments. Mean and SEM plotted. c (Left) Maximum projection of first round non-trypsin-cleaved influenza infection in control and M7KD Vero cells stained for influenza nucleoprotein. Inset shows viral nucleoprotein retained in intracellular compartments after 8-hour incubation. (Right) Quantification of infection in Ctl and M7KD Vero cells with p values determined by two-tailed Student’s t test. n = 3 independent experiments. Mean and SEM plotted. d (Left) Representative maximum projection images of non-trypsin cleaved influenza infection in Vero cells treated with 5 µM FTY720 or 30 µM NS8593. (Right) Quantification of infection in Vero cells treated with FTY720 or NS8593. P values determined by one-way ANOVA with Tukey’s multiple comparison test. n = 3 independent experiments. Mean and SEM plotted. e Weight of mice treated with 150 Plaque Forming Units (PFU) of Influenza A/Puerto Rico/8/1934. Control (DMSO) mice are shown in gray, and NS8593 treated mice in teal. Virus was nasally administered in 40 µL of PBS containing DMSO or 250 µM NS8593. P values determined by Repeated Measures two-way ANOVA with Sidak multiple comparisons test. f (Left) Histology of lungs from mice treated with Influenza +/− NS8593. Hematoxylin and eosin (H&E) stain as well as Mason’s trichrome stain are shown. (Right) Quantification of tissue area with immune infiltration from H&E staining in Control and NS8593 murine lungs. P values determined by two-tailed Student’s t test. n = 3 lungs from individual mice. Mean and standard deviation are plotted.

References

    1. Mercer, J., Schelhaas, M. & Helenius, A. Virus entry by endocytosis. Annu. Rev. Biochem.79, 803–833 (2010). - PubMed
    1. Yamauchi, Y. & Helenius, A. Virus entry at a glance. J. Cell Sci.126, 1289–1295 (2013). - PubMed
    1. White, J. M. & Whittaker, G. R. Fusion of enveloped viruses in endosomes. Traffic17, 593–614 (2016). - PMC - PubMed
    1. Vigant, F., Santos, N. C. & Lee, B. Broad-spectrum antivirals against viral fusion. Nat. Rev. Microbiol.13, 426–437 (2015). - PMC - PubMed
    1. Wisskirchen, K., Lucifora, J., Michler, T. & Protzer, U. New pharmacological strategies to fight enveloped viruses. Trends Pharm. Sci.35, 470–478 (2014). - PMC - PubMed

Publication types

MeSH terms

Substances

Grants and funding

LinkOut - more resources