. 2024 Oct 1;15(1):8461.
doi: 10.1038/s41467-024-52477-1.

Potentiation of cortico-spinal output via targeted electrical stimulation of the motor thalamus

Affiliations

Potentiation of cortico-spinal output via targeted electrical stimulation of the motor thalamus

Jonathan C Ho et al. Nat Commun. .

Abstract

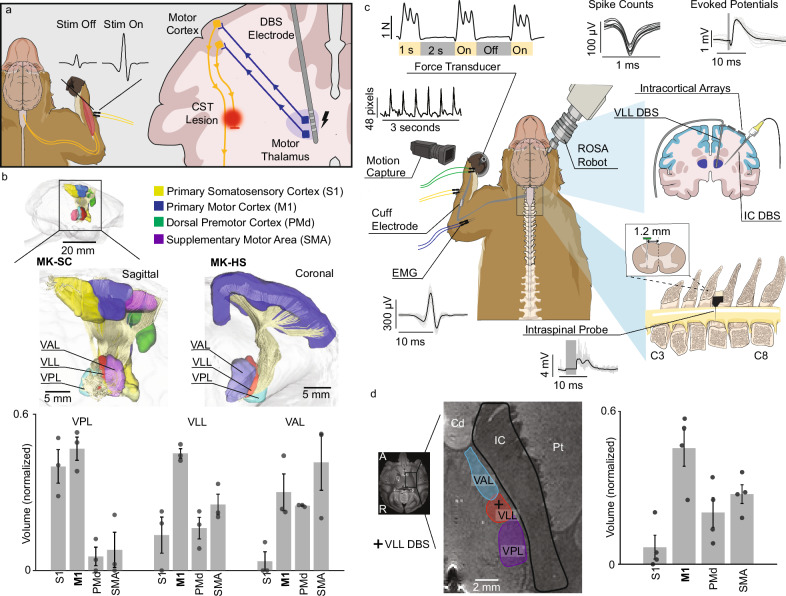
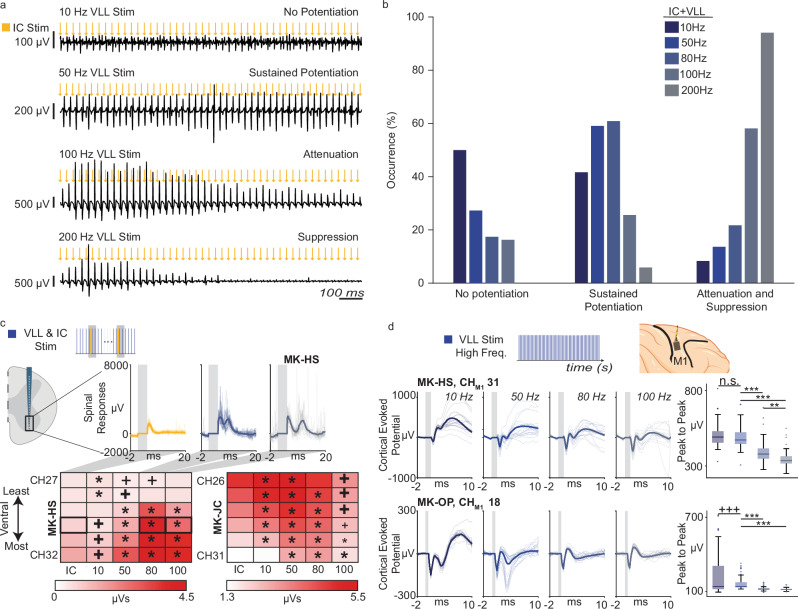
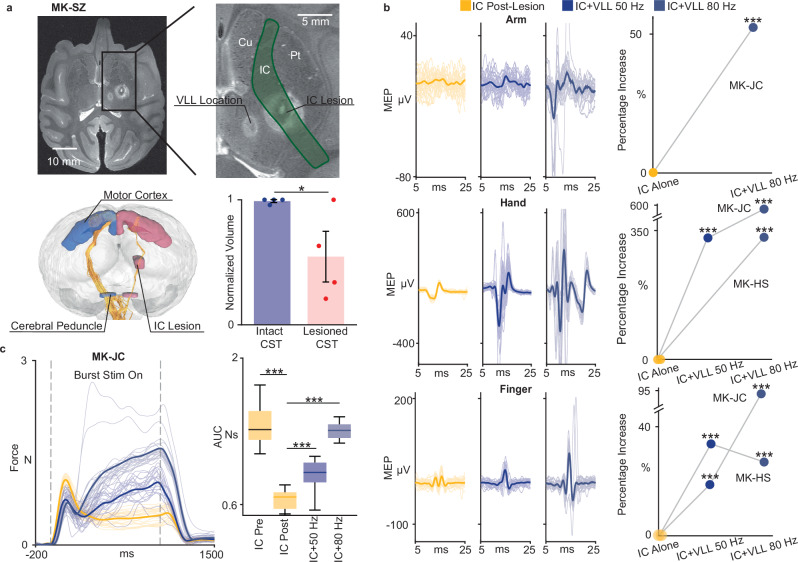
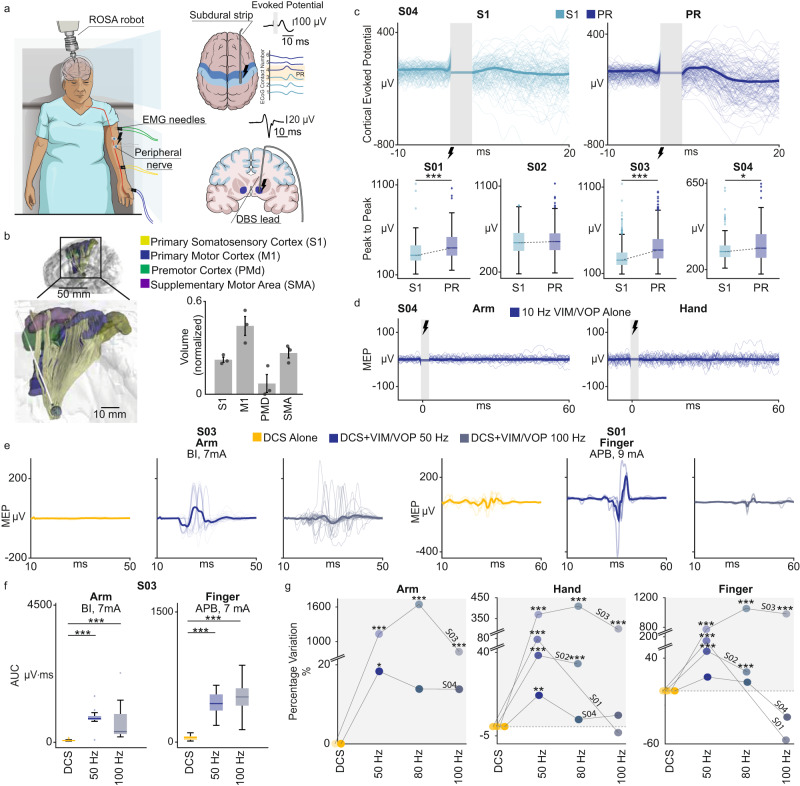
Cerebral white matter lesions prevent cortico-spinal descending inputs from effectively activating spinal motoneurons, leading to loss of motor control. However, in most cases, the damage to cortico-spinal axons is incomplete offering a potential target for therapies aimed at improving volitional muscle activation. Here we hypothesize that, by engaging direct excitatory connections to cortico-spinal motoneurons, stimulation of the motor thalamus could facilitate activation of surviving cortico-spinal fibers thereby immediately potentiating motor output. To test this hypothesis, we identify optimal thalamic targets and stimulation parameters that enhance upper-limb motor-evoked potentials and grip forces in anesthetized monkeys. This potentiation persists after white matter lesions. We replicate these results in humans during intra-operative testing. We then design a stimulation protocol that immediately improves strength and force control in a patient with a chronic white matter lesion. Our results show that electrical stimulation targeting surviving neural pathways can improve motor control after white matter lesions.


Conflict of interest statement

The authors declare no competing interests.

Figures

Fig. 1
Fig. 1. Identification of optimal target of stimulation.
a Schema of our hypothesis: motor thalamus stimulation potentiates motor output by increasing excitability of the motor cortex. The potentiation persists also after a lesion of the CST highlighted in red. b Top: High definition fiber tracking (HDFT) from VPL, VLL, and VAL nuclei (VPL: ventral posterolateral, VLL: ventral laterolateral, VAL: ventral anterolateral) of monkey motor thalamus to cortical regions (n = 3) (S1: primary somatosensory cortex, M1: primary motor cortex, PMd: dorsal pre-motor cortex, SMA: supplementary motor area). Bottom: Volume of thalamocortical projections (mean ± standard error (SE) over 3 animals) from each nucleus to each cortical region normalized by the total volume of fibers projecting from each nucleus. c Acute experimental setup. First, a cuff electrode was implanted around the motor branch of the radial nerve for stimulation. Animals were then implanted with a DBS electrode in the internal capsule (IC) and one in the VLL using the ROSA robot and intracortical arrays over S1 and M1. An intraspinal probe was implanted at the C6 spinal segment to record spinal local field potentials and EMG needle electrodes were inserted in arm, hand, finger and face muscles. A force transducer was placed in the animal’s hand to measure grip force. Finally, a camera recorded the kinematic of the arm and hand. d Left: Example of VLL electrode implant location localized from post-mortem MRI (Cd: Caudate Nucleus, IC: Internal Capsule, Pt: Putamen). Right: Normalized volume HDFT projections from the area of stimulation to cortical regions (mean ± SE over animals, n = 4). Source data for (b and d) are provided as a Source Data file. a, c Were designed by Isabella Bushko.
Fig. 2
Fig. 2. Stimulation of the motor thalamus increases motor cortex excitability.
a Picture (left) and schematic (right) of the implant location of M1 and S1 intracortical arrays. The brain in (a) was created with BioRender.com released under a Creative Commons Attribution-NonCommercial-NoDerivs 4.0 International license. b Top: Example heatmap of average peak-to-peak amplitudes of cortical evoked potentials from VLL stimulation at 10 Hz across all channels over S1 and M1 for MK-HS. Center: Example stimulation triggered averages of cortical evoked potentials over S1 and M1 (n = 40 traces). Bottom: Histogram of peak-to-peak amplitudes across all channels for S1 (light blue) and M1 (dark blue) (n = 48 channels per array). c Top: Example baseline corrected spike count heatmaps in S1 and M1 for MK-HS. Bottom: Average spike counts over time across all channels in S1 and M1 array (n = 48 channels per array). d Top: Example traces of antidromic potentials in M1 from IC stimulation without (yellow) and with (blue) conditioning from a burst of VLL stimulation for MK-HS (n = 40 traces). Boxplot of peak-to-peak amplitude of the antidromic potentials when IC stimulation is conditioned by VLL stimulation at various delays (2, 5, 10, and 50 ms). In the boxplot, the whiskers extend to the maximum spread not considering outliers. Central, top, and bottom lines represent median, 25th, and 75th percentile, respectively. For all (bd), statistical significance was assessed with two-tail bootstrapping with Bonferroni correction: p < 0.05 (*), p < 0.01 (**), p < 0.001(***). Source data for (bd) are provided as a Source Data file.
Fig. 3
Fig. 3. Stimulation of the motor thalamus amplifies motor outputs.
a Average of binned Flexor Digitorum Minimi (FDM) MEPs generated by IC stimulation at 2 Hz paired with continuous VLL stimulation at 50 Hz with gradual ramp-up of amplitude (0–3 mA; bins: 0–0.6 mA, 0.7–1.2 mA, 1.3–1.8 mA, 1.9–2.4 mA, and 2.5–3 mA, each bin included n = 9 responses). b Left panels: MEPs of one arm muscle (n = 40, Biceps, MK-OP), one hand muscle (n = 40, Extensor Digitorum Communis, MK-HS), and one finger muscle (n = 40, Abductor Pollicus Brevis, MK-HS) with IC stim alone and then paired with VLL stimulation at 50 and 80 Hz. Right panels: percentage of increase of AUC of arm, hand, and finger MEPs between IC stimulation alone and paired with VLL stimulation at 50 and 80 Hz. For each monkey, the percentage of increase was calculated over the medians and averaged over all the muscles. See Supplementary Fig. 2 for boxplots for single muscles. (***), (**), or (*) was placed if muscles in each group showed a significant increase (respective to p-values 0.001, 0.01, and 0.05). c Force transducer experimental setup and stimulation parameters (IC: 45–50 Hz burst, 1 s ON, 2 s OFF; VLL: 50 Hz continuous). Example force traces (n = 20) and boxplots of AUC (IC alone, IC with VLL at 50 Hz, and IC with VLL at 100 Hz). For all boxplots, the whiskers extend to the maximum spread not considering outliers, central, top, and bottom lines represent median, 25th, and 75th percentile, respectively. For all (ac), statistical significance was assessed with two-tail bootstrapping with Bonferroni correction: p < 0.05 (*), p < 0.01 (**), p < 0.001(***). Source data for (ac) are provided as a Source Data file.
Fig. 4
Fig. 4. Motor output potentiation is not through current spreading towards CST axons nor through spinal circuits.
a Example of antidromic responses in the spinal cord from VLL stimulation at 10 Hz (n = 30 traces) in MK-OP for three different channels (CH1, 16, and 31) along the multi-channel linear spinal probe. The spinal cord section in (a) was created with BioRender.com released under a Creative Commons Attribution-NonCommercial-NoDerivs 4.0 International license. b Left: Heatmaps of peak-to-peak amplitude of the antidromic responses in the spinal cord at the C6-C7 spinal level with dorsal-ventral alignments for n = 3 animals. The dashed boxes are highlighting the putative intermediate-ventral zone where we see the greatest responses. Right: Boxplots of the antidromic response latency for each animal (n = 656 MK-OP, n = 600 MK-JC, n = 596 MK-HS). c MEPs of the hand (ECR: Extensor Carpi Radialis, 30 traces for each animal) elicited by VLL stim at 50 Hz. d EMG reflexes and boxplots of the AUC of the EMG reflexes of the ECR muscle elicited by radial nerve stimulation and radial nerve paired with continuous VLL stimulation at 50 Hz (30 example traces each). For all boxplots, the whiskers extend to the maximum spread not considering outliers. Central, top, and bottom lines represent median, 25th, and 75th percentile, respectively. For (d), statistical significance was assessed with one-tail bootstrapping with Bonferroni correction, however, in all cases the results were not significant. Source data for (b and d) are provided as a Source Data file.
Fig. 5
Fig. 5. Responses are modulated in a frequency-dependent manner.
a Examples of frequency-dependent modulation of muscular responses. EMG responses were elicited by 2 Hz stimulation of the IC paired with different VLL stimulation frequencies (10, 50, 80, 100, and 200 Hz). b The occurrence of modulation patterns with respect to stimulation frequency. All patterns recorded in all muscles of 3 animals were included in the analysis (n =  24 patterns at 10 Hz, n = 22 patterns at 50 Hz, n = 23 patterns at 80 Hz, n = 43 at 100 Hz, and n = 17 patterns at 200 Hz). c Top: Example of spinal responses in the ventral zone for IC stimulation alone and IC stimulation paired with VLL stimulation at 80 and 100 Hz (n = 30 traces per plot). Bottom: Heatmaps of the AUC calculated from 5 to 10 ms after IC stimulation for all ventral channels (CH 27–32 for MK-HS and CH: 26–31 for MK-JC) for IC stimulation alone and IC stimulation paired with VLL stimulation at 10, 50, 80, and 100 Hz. (*) for significant potentiation and (+) for significant suppression. Regular text represents p < 0.05; whereas bold represents p < 0.001. Statistical significance was tested by comparing IC stimulation alone to all other stimulation conditions for potentiation using one-tailed bootstrapping with Bonferroni correction. d Top: Schematic of the experimental layout for testing frequency dependence within the motor cortex. Bottom: Example traces of the cortical evoked potential responses in the M1 array when stimulating the thalamus at different frequencies (10, 50, 80, and 100 Hz) (n = 30 traces). Boxplots of the peak-to-peak amplitudes of the cortical evoked potentials. Statistical significance for (d) was tested by comparing 50 Hz VLL stimulation to all other stimulation conditions for potentiation using one-tailed bootstrapping with Bonferroni correction: p < 0.05 (*), p < 0.01 (**), p < 0.001(***). For all boxplots, the whiskers extend to the maximum spread not considering outliers. Central, top, and bottom lines represent median, 25th, and 75th percentile, respectively. Source data for (bd) are provided as a Source Data file. The spinal cord and the brain in (c, d) were created with BioRender.com released under a Creative Commons Attribution-NonCommercial-NoDerivs 4.0 International license.
Fig. 6
Fig. 6. Stimulation of the motor thalamus amplifies motor outputs after CST lesions.
a Top panels: T2-weighted post-mortem MRI of IC lesion and VLL location (axial plane). (Cu: Caudate Nucleus, IC: Internal Capsule, Pt: Putamen). Bottom panels: HDFT of the CST in intact and lesioned hemispheres. Volume of cumulative CST (mean ± SE over animals) for both hemispheres normalized over the volume of the intact hemisphere. b Left panels: Example of post-lesion MEPs of one arm muscle (n = 40, BIC: Biceps, MK-JC), one hand muscle (n = 40, ECR: Extensor Communis Radialis, MK-JC), and one finger muscle (n = 40, FDM: Flexor Digitorum Minimi, MK-JC) with IC stim alone and then paired with VLL stimulation at 50 and 80 Hz. Right panels: percentage of increase of arm, hand, and finger MEPs post-lesion between IC stimulation alone and paired with VLL stimulation at 50 and 80 Hz. For each monkey, the percentage of increase was calculated over the medians and averaged over all the muscles. See Supplementary Fig. 5 for boxplots for single muscles. (***), (**), or (*) was placed if muscles in each group showed a significant increase (respective to p-values 0.001, 0.01, and 0.05). c Left panel: Example of force traces (n = 20). Right panel: boxplot of AUC pre- and post-lesion for IC alone, and IC with VLL 50 Hz and VLL 80 Hz. For all boxplots, the whiskers extend to the maximum spread not considering outliers. Central, top, and bottom lines represent median, 25th, and 75th percentile, respectively. For all (ac), statistical significance was assessed with two-tail bootstrapping with Bonferroni correction: p < 0.05 (*), p < 0.01 (**), p < 0.001(***). Source data for (ac) are provided as a Source Data file.
Fig. 7
Fig. 7. Stimulation of the motor thalamus amplifies motor outputs in humans.
a Top: Experimental setup for human intraoperative experiments. Enlargement shows a schematic representing the subdural strip electrode placement over M1 and S1 cortices, and the PR to identify the central sulcus. Needle electrodes were inserted in arm, hand, and finger muscles to record MEPs and superficial electrodes were placed over the median nerve for SSEP. The panel (was designed by Isabella Bushko. b Left: HDFT from the VIM/VOP to cortical regions. Right: Normalized volume (mean ± SE over n = 4 subjects S01-S04) of VIM/VOP projections to each cortical region normalized by the total volume of fibers. c Top: Example traces (n = 122) of cortical evoked potentials elicited by VIM/VOP stimulation recorded over an S1 (left) and M1 (right) contact for S04. Bottom: Boxplots of peak-to-peak amplitude of cortical evoked potentials at S1 and M1 contact. From left to right, subjects S01 to S04 are shown (n = 128, n = 585, n = 601, n = 122 trials, respectively). d Example MEP traces (arm, biceps; hand, flexor; n = 60) with VIM/VOP stimulation alone for S03. e Example MEP traces with DCS alone and DCS paired with VIM/VOP stimulation at 50 and 100 Hz (from left to right). Arm is S03 biceps (n = 48 traces), and fingers are S01 abductor pollicis brevis (n = 16 traces). f Boxplots of AUC for MEPs of the arm and fingers (biceps and abductor pollicis brevis respectively; n = 58) with DCS alone and DCS paired with VIM/VOP stimulation at 50 and 100 Hz. g Scatter plots for arm, hand, and finger muscles of subjects S01-S04, representing the percentage of AUC increase calculated over the means, with respect to DCS alone, for all the different VIM/VOP stimulation frequencies (50, 80, and 100 Hz). For all boxplots, the whiskers extend to the maximum spread not considering outliers. Central, top, and bottom lines represent median, 25th, and 75th percentile, respectively. For all (c, f, g), statistical significance was assessed with two-tail bootstrapping with Bonferroni correction: p < 0.05 (*), p < 0.01 (**), p < 0.001(***). Source data for (b, c, eg) are provided as a Source Data file.
Fig. 8
Fig. 8. Stimulation of the motor thalamus improves voluntary motor control after lesions of the CST.
a Top: Tractography with lesion highlighted in red. Bottom: Amount of lesioned tracts (CBT: corticobulbar tract, DRT: dentatorubrothalamic tract, ML: medial lemniscus). See Supplementary Fig. 10a for lesion segmentation. b Boxplots of peak-to-peak amplitude of cortical EPs over S1 and M1 contact from VIM/VOP stimulation at 10 Hz (number of stimulation pulses: 599). c Left: Example of MEPs with DCS alone and DCS paired with VIM/VOP stimulation at 50 and 100 Hz (number of DCS pulses: 18). Right: boxplots of MEPs AUC with DCS alone and DCS paired with VIM/VOP stimulation. d Schema of the voluntary force control (top) and isometric grip strength (bottom) task. e Bar plot of isometric grip strength without (yellow) and with (blue) VIM/VOP stimulation at 55 Hz (session 1: n = 4, session 2: n = 3). f Left: Example of force traces without (top) and with (bottom) VIM/VOP stimulation. Yellow and blue intensities represent different repetitions. Dashed and dotted lines indicate the ± 5 % of the target force. Right: bar plot of the RMSE of the force (sessions 1 and 2: n = 5, session 3: n = 8). g Left: Example video frames of the weight elevation task for the heavy weight without (top) and with VIM/VOP stimulation (bottom). Right: bar plot of shoulder abduction and elbow extension without and with VIM/VOP stimulation for the three conditions (no and lightweight: n = 10, heavyweight: n = 6). h Bar plot of the arm elevation percentage increase for the three conditions. For all (b, c, eh), statistical significance was assessed with two-tail bootstrapping with Bonferroni correction: p < 0.05 (*), p < 0.01 (**), p < 0.001 (***). For all bar plots, each bar represents the mean, and error bars represent standard deviation over trials. For all boxplots, the whiskers extend to the maximum spread not considering outliers. Central, top, and bottom lines represent median, 25th, and 75th percentile, respectively. Source data for (ac and eh) are provided as a Source Data file.

Update of

Similar articles

Cited by

References

    1. Lemon, R. N. Descending pathways in motor control. Annu. Rev. Neurosci.31, 195–218 (2008). - PubMed
    1. Skolarus, L., Meurer, W., Burke, J., Bettger, J. P. & Lisabeth, L. Effect of insurance status on postacute care among working age stroke survivors. Neurology78, 1590–1595 (2012). - PMC - PubMed
    1. Zaloshnja, E., Miller, T., Langlois, J. A. & Selassie, A. W. Prevalence of long-term disability from traumatic brain injury in the civilian population of the United States, 2005. J. Head. Trauma Rehabil.23, 394–400 (2008). - PubMed
    1. Clayton, E., Kinley-Cooper, S., Weber, R. & Adkins, D. Brain stimulation: neuromodulation as a potential treatment for motor recovery following traumatic brain injury. Brain Res.1640, 130–138 (2016). - PMC - PubMed
    1. Simonetta-Moreau, M. Non-invasive brain stimulation (NIBS) and motor recovery after stroke. Ann. Phys. Rehabil. Med.57, 530–542 (2014). - PubMed

Publication types

LinkOut - more resources