

Contribution of resting-state functional connectivity of the subgenual anterior cingulate to prediction of antidepressant efficacy in patients with major depressive disorder
- PMID: 39353921
- PMCID: PMC11445426
- DOI: 10.1038/s41398-024-03117-1
Contribution of resting-state functional connectivity of the subgenual anterior cingulate to prediction of antidepressant efficacy in patients with major depressive disorder
Abstract
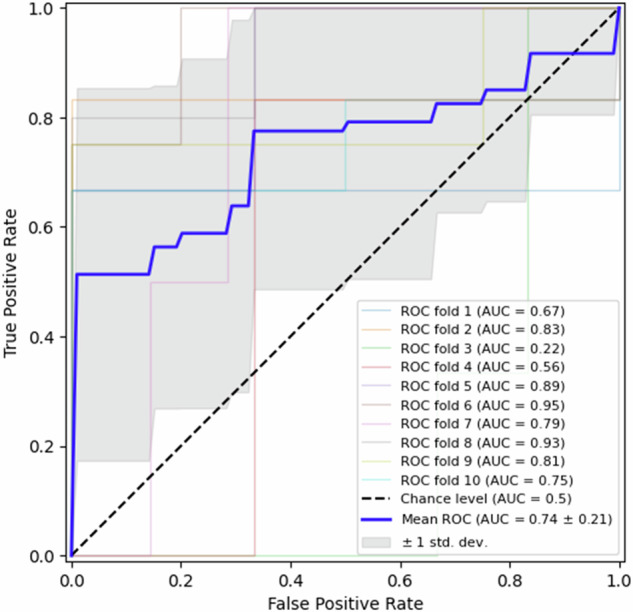
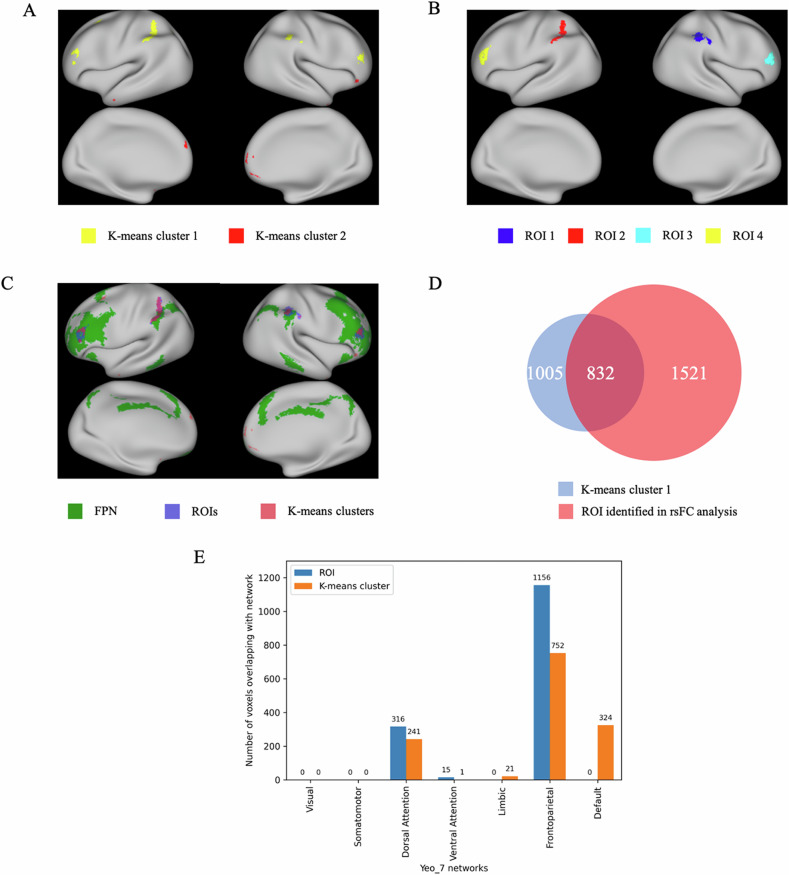
This study investigated how resting-state functional connectivity (rsFC) of the subgenual anterior cingulate cortex (sgACC) predicts antidepressant response in patients with major depressive disorder (MDD). Eighty-seven medication-free MDD patients underwent baseline resting-state functional MRI scans. After 12 weeks of escitalopram treatment, patients were classified into remission depression (RD, n = 42) and nonremission depression (NRD, n = 45) groups. We conducted two analyses: a voxel-wise rsFC analysis using sgACC as a seed to identify group differences, and a prediction model based on the sgACC rsFC map to predict treatment efficacy. Haufe transformation was used to interpret the predictive rsFC features. The RD group showed significantly higher rsFC between the sgACC and regions in the fronto-parietal network (FPN), including the bilateral dorsolateral prefrontal cortex (DLPFC) and bilateral inferior parietal lobule (IPL), compared to the NRD group. These sgACC rsFC measures correlated positively with symptom improvement. Baseline sgACC rsFC also significantly predicted treatment response after 12 weeks, with a mean accuracy of 72.64% (p < 0.001), mean area under the curve of 0.74 (p < 0.001), mean specificity of 0.82, and mean sensitivity of 0.70 in 10-fold cross-validation. The predictive voxels were mainly within the FPN. The rsFC between the sgACC and FPN is a valuable predictor of antidepressant response in MDD patients. These findings enhance our understanding of the neurobiological mechanisms underlying treatment response and could help inform personalized treatment strategies for MDD.
© 2024. The Author(s).
Conflict of interest statement
The authors declare no competing interest.
Figures


Similar articles
-
Predicting the treatment outcomes of major depressive disorder interventions with baseline resting-state functional connectivity: a meta-analysis.BMC Psychiatry. 2025 Apr 7;25(1):340. doi: 10.1186/s12888-025-06728-0. BMC Psychiatry. 2025. PMID: 40197372 Free PMC article.
-
Changes in brain connectivity during a sham-controlled, transcranial magnetic stimulation trial for depression.J Affect Disord. 2018 May;232:143-151. doi: 10.1016/j.jad.2018.02.019. Epub 2018 Feb 21. J Affect Disord. 2018. PMID: 29494898 Free PMC article.
-
Depression-related anterior cingulate prefrontal resting state connectivity normalizes following cognitive behavioral therapy.Eur Psychiatry. 2020 Apr 14;63(1):e37. doi: 10.1192/j.eurpsy.2020.34. Eur Psychiatry. 2020. PMID: 32284075 Free PMC article.
-
Identification of major depressive disorder and prediction of treatment response using functional connectivity between the prefrontal cortices and subgenual anterior cingulate: A real-world study.J Affect Disord. 2019 Jun 1;252:365-372. doi: 10.1016/j.jad.2019.04.046. Epub 2019 Apr 8. J Affect Disord. 2019. PMID: 30999093
-
Distinctive intrinsic functional connectivity alterations of anterior cingulate cortex subdivisions in major depressive disorder: A systematic review and meta-analysis.Neurosci Biobehav Rev. 2024 Apr;159:105583. doi: 10.1016/j.neubiorev.2024.105583. Epub 2024 Feb 15. Neurosci Biobehav Rev. 2024. PMID: 38365137
Cited by
-
Functional Inputs to the Subgenual Cingulate Cortex Distinguish Neurotypical Individuals with Severe and Mild Depressive Problems: Granger Causality and Clustering Analyses.bioRxiv [Preprint]. 2025 Jun 27:2025.06.25.661556. doi: 10.1101/2025.06.25.661556. bioRxiv. 2025. PMID: 40667126 Free PMC article. Preprint.
-
Systematical Comparison Reveals Distinct Brain Transcriptomic Characteristics in Depression Models Induced by Gut Microbiota Dysbiosis and Chronic Stress.Mol Neurobiol. 2025 Jun;62(6):7957-7974. doi: 10.1007/s12035-025-04766-z. Epub 2025 Feb 17. Mol Neurobiol. 2025. PMID: 39960648
-
Examining anterior prefrontal cortex resting-state functional connectivity patterns associated with depressive symptoms in chronic moderate-to-severe traumatic brain injury.Front Neurol. 2025 Mar 28;16:1541520. doi: 10.3389/fneur.2025.1541520. eCollection 2025. Front Neurol. 2025. PMID: 40224311 Free PMC article.
-
Predicting the treatment outcomes of major depressive disorder interventions with baseline resting-state functional connectivity: a meta-analysis.BMC Psychiatry. 2025 Apr 7;25(1):340. doi: 10.1186/s12888-025-06728-0. BMC Psychiatry. 2025. PMID: 40197372 Free PMC article.
References
-
- Voegeli G, Clery-Melin M.L, Ramoz N, Gorwood P. Progress in elucidating biomarkers of antidepressant pharmacological treatment response: a systematic review and meta-analysis of the last 15 years. Drugs. 2017;77:1967–86. - PubMed
MeSH terms
Substances
LinkOut - more resources
Full Text Sources
Medical
Miscellaneous
