. 2024 Oct 2;15(10):723.
doi: 10.1038/s41419-024-07078-7.

Inhibition of poly(ADP-Ribosyl)ation reduced vascular smooth muscle cells loss and improves aortic disease in a mouse model of human accelerated aging syndrome

Affiliations

Inhibition of poly(ADP-Ribosyl)ation reduced vascular smooth muscle cells loss and improves aortic disease in a mouse model of human accelerated aging syndrome

Déborah Cardoso et al. Cell Death Dis. .

Abstract

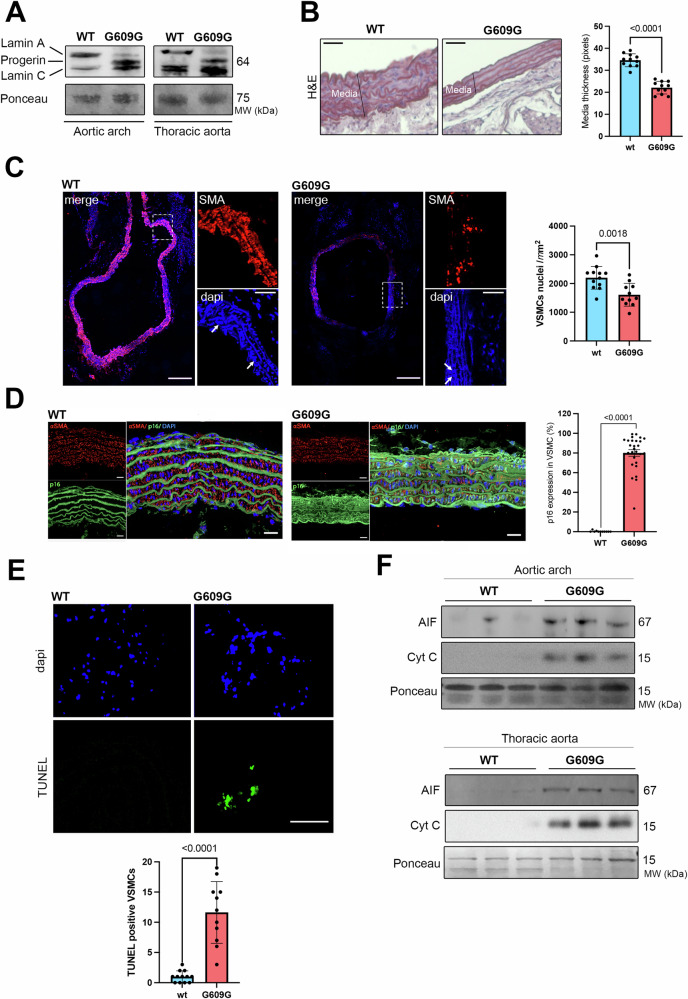
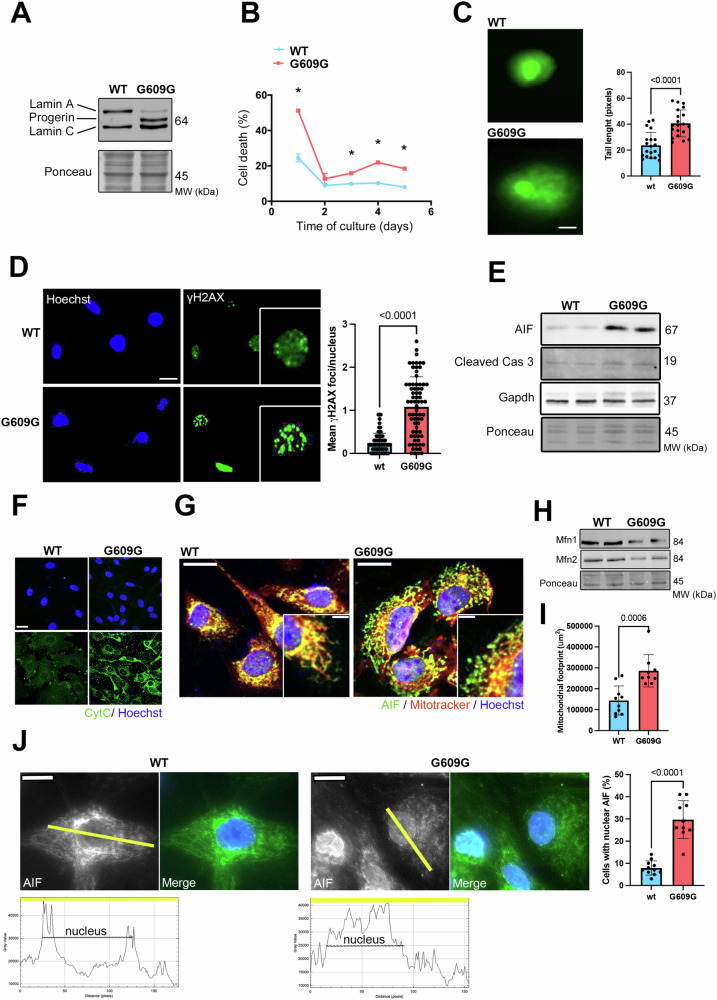
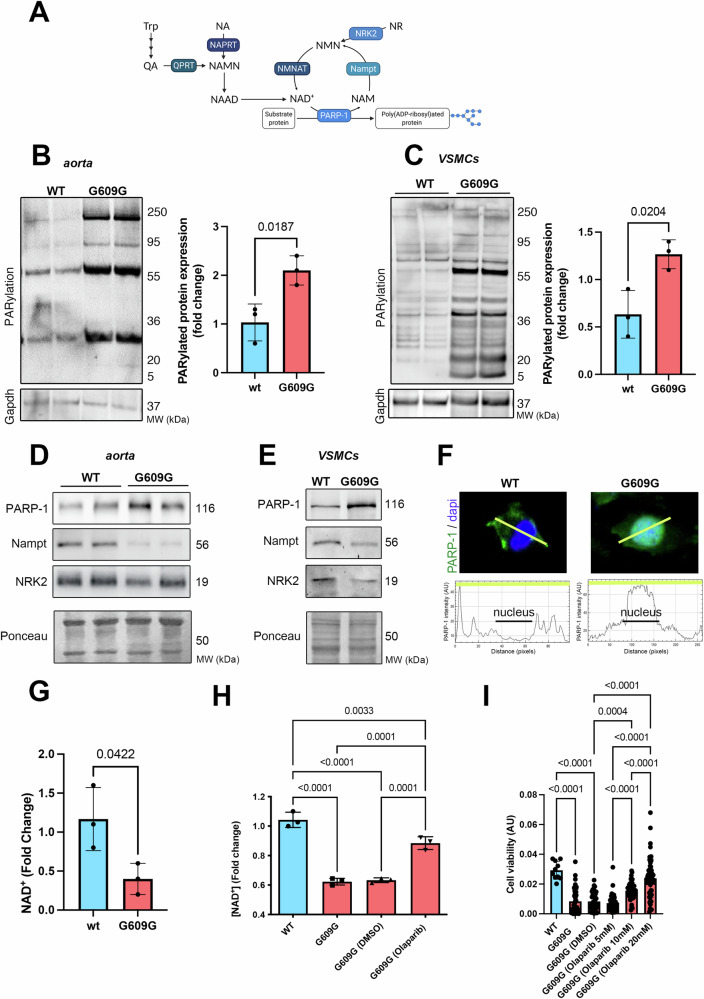
Hutchinson-Gilford progeria syndrome (HGPS) is an extremely rare genetic disorder associated with features of accelerated aging. HGPS is an autosomal dominant disease caused by a de novo mutation of LMNA gene, encoding A-type lamins, resulting in the truncated form of pre-lamin A called progerin. While asymptomatic at birth, patients develop symptoms within the first year of life when they begin to display accelerated aging and suffer from growth retardation, and severe cardiovascular complications including loss of vascular smooth muscle cells (VSMCs). Recent works reported the loss of VSMCs as a major factor triggering atherosclerosis in HGPS. Here, we investigated the mechanisms by which progerin expression leads to massive VSMCs loss. Using aorta tissue and primary cultures of murine VSMCs from a mouse model of HGPS, we showed increased VSMCs death associated with increased poly(ADP-Ribosyl)ation. Poly(ADP-Ribosyl)ation is recognized as a post-translational protein modification that coordinates the repair at DNA damage sites. Poly-ADP-ribose polymerase (PARP) catalyzes protein poly(ADP-Ribosyl)ation by utilizing nicotinamide adenine dinucleotide (NAD+). Our results provided the first demonstration linking progerin accumulation, augmented poly(ADP-Ribosyl)ation and decreased nicotinamide adenine dinucleotide (NAD+) level in VSMCs. Using high-throughput screening on VSMCs differentiated from iPSCs from HGPS patients, we identified a new compound, trifluridine able to increase NAD+ levels through decrease of PARP-1 activity. Lastly, we demonstrate that trifluridine treatment in vivo was able to alleviate aortic VSMCs loss and clinical sign of progeria, suggesting a novel therapeutic approach of cardiovascular disease in progeria.


Conflict of interest statement

The authors declare no competing interests.

Figures

Fig. 1
Fig. 1. Increased aortic cell death in LmnaG609G/G609G mice.
A Representative immunoblots showing lamin A, progerin, and lamin C protein levels in aortic arch and thoracic aorta from LmnaG609G/G609G (G609G) and WT mice. Ponceau was used for normalization. B Representative aorta cross sections from LmnaG609G/G609G and WT mice stained with hematoxylin & eosin (H&E). Scale bar, 20 µm. Graph shows media thickness quantification in LmnaG609G/G609G (n = 12) and WT (n = 11) mice. Bars indicate mean ± standard error of mean and numbers above columns indicate p values. Differences were analyzed by unpaired t test. C Immunostaining of aorta cross sections from LmnaG609G/G609G and WT mice showing smooth muscle actin (SMA) (red) and nuclei stained with Hoechst (blue). The white arrows point to VSMCs nuclei. Left scale bars, 200 μm, and right scale bars, 40 µm. Graph shows VSMCs nuclei quantification in LmnaG609G/G609G (n = 12) and WT (n = 11) mice. Bars indicate mean ± standard error of mean and numbers above columns indicate p values. Differences were analyzed by unpaired t test. D Immunostaining of aorta cross sections from LmnaG609G/G609G (G609G) and WT mice showing α-SMA (red) and p16 (green) showing senescent cells. Nuclei stained with DAPI (blue). Scale bar, 20 µm. Graph shows the percentage of p16 senescent VSMCs in aortic arch quantification in LmnaG609G/G609G (n = 6) and WT (n = 3) mice. Bars indicate mean ± standard error of mean and number above columns indicate p values. Differences were analyzed by unpaired t test. E TUNEL staining of aorta cross sections from LmnaG609G/G609G and WT mice showing apoptotic cells (green). Scale bar, 40 µm. Graph shows TUNEL positive cells quantification in media from LmnaG609G/G609G (n = 12) and WT (n = 11) mice. Bars indicate mean ± standard error of mean and numbers above columns indicate p values. Differences were analyzed by unpaired t test. F Immunoblots showing AIF and Cyt C protein levels in aortic arch and thoracic aorta from LmnaG609G/G609G and WT mice. Ponceau was used for normalization.
Fig. 2
Fig. 2. Increased apoptosis of cultured VSMCs from LmnaG609G/G609Gmice.
A Representative immunoblots showing lamin A, progerin, and lamin C protein levels in isolated VSMCs from LmnaG609G/G609G (G609G) and WT mice. Ponceau was used for normalization. B Percentage of cell death curves of VSMCs from LmnaG609G/G609G (G609G) (n = 3) and WT (n = 3) mice. Differences were analyzed by Kruskal–Wallis test, *p < 0.02. C Images of comets assay for VSMCs from LmnaG609G/G609G (G609G) and WT mice. Scale bars, 10 µm. The graph shows tail length quantification for VSMCs from LmnaG609G/G609G (G609G) (n = 20) and WT (n = 20) mice. Bars indicate mean ± standard error of mean and numbers above columns indicate p values. Differences were analyzed by unpaired t test. D Representative immunostaining of VSMCs from LmnaG609G/G609G (G609G) and WT mice showing γH2Ax foci (green) and nuclei (blue). Scale bars, 10 µm. Graph shows mean of γH2Ax foci per nucleus in VSMCs from LmnaG609G/G609G (G609G) (n = 71) and WT (n = 70) mice. Bars indicate mean ± standard error of mean and numbers above columns indicate p values. Differences were analyzed by unpaired t test. E Representative immunoblots showing AIF and cleaved Cas 3 protein levels in VSMCs from LmnaG609G/G609G (G609G) and WT mice. Ponceau was used for normalization. F Immunostaining of VSMCs from LmnaG609G/G609G (G609G) and WT mice showing cytochrome C (green) staining. Nuclei were stained with Hoechst (blue). Scale bars, 20 µm. G Immunostaining of LmnaG609G/G609G-VSMCs and WT-VSMCs showing AIF (green), mitochondria (red) and nuclei (blue). Upper scale bars, 10 µm and down scale bars, 5 µm. H Representative immunoblots showing Mfn1 an Mfn2 protein levels in VSMCs from LmnaG609G/G609G (G609G) and WT mice. Ponceau was used for normalization. I Quantification of mitochondrial footprint (μm2) in VSMCs from LmnaG609G/G609G (G609G) (n = 9) compared with WT (n = 10). Bars indicate mean ± standard error of mean and numbers above columns indicate p values. Difference was analyzed by unpaired t test. J Representative immunofluorescence micrographs of AIF staining in VSMCs from LmnaG609G/G609G (G609G) (n = 9) and WT (n = 10) mice. The scan line graphs represent the intensity of AIF staining along the yellow lines. Bars indicate mean ± standard error of mean and numbers above columns indicate p values. Differences were analyzed by unpaired t test.
Fig. 3
Fig. 3. Increased global poly(ADP-Ribosylation) participates in altered NAD+ metabolism in LmnaG609G/G609G models.
A Schematic representation of the NAD+ biosynthesis. Trp tryptophan, NA quinolinic acid, QPRT quinolinic acid phosphoribosyltransferase, NAPRT nicotinic acid phosphoribosyltransferase, NMN nicotinamide mononucleotide, NAMN nicotinic acid mononucleotide, NAAD nicotinic acid adenine dinucleotide, NAM nicotinamide, NA nicotinic acid, NR nicotinamide riboside, NAD+ nicotinamide adenine dinucleotide, PARP-1 poly-ADP-ribose polymerase 1. B Representative immunoblot showing total poly(ADP-Ribosyl)ated protein level expression with PAR antibody (Fold change) in aorta from LmnaG609G/G609G mice (n = 3) and WT mice (n = 3). Ponceau was shown as loading control. The bar graphs represent poly(ADP-Ribosyl)ated protein relative expression (mean ± standard error of means and numbers above columns indicate p values) (relative to ponceau). Difference was analyzed by unpaired t test. C Representative immunoblot showing total poly(ADP-Ribosyl)ated protein level expression with PAR antibody (fold change) in VSMCs from LmnaG609G/G609G (G609G) (n = 3) and WT (n = 3) mice. Ponceau was shown as loading control. The bar graphs represent poly(ADP-Ribosyl)ated protein relative expression (mean ± standard error of means and numbers above columns indicate p values) (relative to ponceau). Difference was analyzed by unpaired t test. D Representative immunoblots showing PARP-1, Nampt and NRK2 protein level in aorta from LmnaG609G/G609G mice (n = 3) and WT (n = 3) mice. Ponceau was shown as loading control. E Representative immunoblots showing PARP-1, Nampt and NRK2 protein level in VSMCs from LmnaG609G/G609G (G609G) (n = 3) and WT (n = 3) mice. Ponceau was shown as loading control. F Representative immunofluorescence micrographs of PARP-1 staining in VSMCs from LmnaG609G/G609G (G609G) and WT mice. The scan line graphs represent the intensity of PARP-1 staining along the yellow lines. G Quantification of NAD+ content (fold change) in VSMCs from LmnaG609G/G609G (G609G) (n = 3) and WT (n = 3) mice. Bars indicate mean ± standard error of mean and numbers above columns indicate p values. Difference was analyzed by unpaired t test. H Quantification of NAD+ content (fold change, NAD+, and NADH) in VSMCs from WT (n = 3), and LmnaG609G/G609G (G609G) mice (n = 3) treated (n = 3) or not (n = 3) with Olaparib (5 mM). Bars indicate mean ± standard error of mean and numbers above columns indicate p values. Difference was analyzed by one-way ANOVA followed by Tukey’s multiple comparison test. I Assessment of cell viability of VSMCs from LmnaG609G/G609G (G609G) mice treated or not with Olaparib (5, 10, and 20 mM) (n = 10 bright fields from five independent plates per condition (pooled)). Bars indicate mean ± standard error of mean and numbers above columns indicate p values. Each dot represents the quantification for one microscopy image. Difference was analyzed by one-way ANOVA followed by Tukey’s multiple comparison test.
Fig. 4
Fig. 4. High-throughput screening on iPSC derived VSMCs from HGPS patients allows trifluridine identification for treatment of LmnaG609G/G609G model.
A Representative immunoblots showing lamin A, progerin, lamin C and SMA protein levels in isolated VSMCs derived from HGPS iPSCs patient (HGPS-VSMCs). Ponceau was used for normalization. Immunoblots are associated to a quantification of NAD+ content (fold change, NAD+ and NADH) in HGPS-VSMCs (n = 3) and control-VSMCs (n = 3). Bars indicate mean ± standard error of mean and numbers above columns indicate p values. Differences were analyzed by unpaired t test. B Graph shows NAD+ level (NAD+ and NADH) normalized by the quantity of cells during the different cell passages (n = 3). Bars indicate mean ± standard error of mean. C Scheme of the high-throughput screening performed in iPSC derived VSMCs from HGPS patients. D Activity (NAD+ and NADH) normalized by the cell number expresses in % in DMSO- (control−), FK866− or Olaparib-(control+) treated iPSC derived VSMCs from HGPS patients. Bars indicate mean ± standard error of mean of 16 replicates wells in four independent plates (pooled). E Primary screen cell-based assay. Dot plot representation of the effects of the library compounds on NAD+ (NAD+ and NADH), normalized to negative control and cell viability. F Graphs show dose-response effect of three validated compounds with the activity (red) (NAD+ level normalized by the quantity of cells) and the viability (blue) compared to DMSO treatment. G NAMPT activity after different concentrations (0.1, 1, 10 mM) of pemetrexed disodium, methotrexate or trifluridine treatment (n = 3 for each condition). Bars indicate mean ± standard error of mean and numbers above columns indicate p values. Differences were analyzed by one-way ANOVA. H PARP-1 activity after different concentrations (0.1, 1, 10 mM) of pemetrexed disodium, methotrexate or trifluridine treatment (n = 3 for each condition). Bars indicate mean ± standard error of mean and numbers above columns indicate p values. Differences were analyzed by one-way ANOVA followed by Tukey’s multiple comparison test. I ATP measurement activity per cell after 1 mM of pemetrexed disodium, methotrexate or trifluridine treatment (n = 3 for each condition). Bars indicate mean ± standard error of mean and numbers above columns indicate p values. Differences were analyzed by one-way ANOVA followed by Tukey’s multiple comparison test.
Fig. 5
Fig. 5. TAS-102 treatment restores NAD+ levels and improves aortic disease.
A Quantification of NAD+ content (fold change) in VSMCs from WT and LmnaG609G/G609G (G609G) mice treated with TAS-102 (5 µM) or DMSO (n = 3 per condition). Bars indicate mean ± standard error of mean and numbers above columns indicate p values. Differences were analyzed by one-way ANOVA followed by Tukey’s multiple comparison test. B Graph of body weight of mice throughout 4 weeks of treatment with TAS-102 (n = 10), Olaparib “Control (+)” (n = 10) or DMSO (n = 10). C Top: Representative immunoblots showing PARP-1, expression in the aorta of LmnaG609G/G609G mice treated with Olaparib “Control (+)” and with TAS-102. Ponceau was shown as loading control. Bottom: Immunostaining of the aorta (the media) from LmnaG609G/G609G mice treated or not with TAS-102 showing PARP-1 (green) and nuclei (blue). Scale bars, 50 µm. D Immunostaining of aorta cross sections from LmnaG609G/G609G (G609G) and WT mice showing α-SMA (red) and p16 (green) showing senescent cells. Nuclei stained with DAPI (blue). Scale bar, 20 µm. Graph compares the percentage of p16 senescent VSMCs in aortic arch quantification in LmnaG609G/G609G (G609G) (n = 6) and LmnaG609G/G609G (G609G) treated with TAS-102 (n = 6), Olaparib (n = 5) compared with WT (n = 3) mice. Bars indicate mean ± standard error of mean and number above columns indicate p values. Differences were analyzed by one-way ANOVA test followed by Tukey’s multiple comparison test. E Representative aorta cross sections from LmnaG609G/G609G, WT and LmnaG609G/G609G mice treated with either TAS-102, Olaparib “Control (+)” or DMSO (Control). Scale bar, 50 µm. F Media thickness quantification in LmnaG609G/G609G mice treated with TAS-102, Olaparib “Control (+)”, DMSO and in WT (n = 4 per condition). Quantification performed on different regions of the media (each represented by a dot on the graph). Differences were analyzed by one-way ANOVA followed by Tukey’s multiple comparison test. G Number of VSMCs evaluated by nuclei count in LmnaG609G/G609G mice treated with TAS-102, Olaparib “Control (+)”, DMSO and in WT (n = 4 per condition). Quantification performed on different regions of the media (each represented by a dot on the graph). Differences were analyzed by one-way ANOVA.
Fig. 6
Fig. 6. Schematic representation of the PARP-dependent cell death program activation contributing to the death of aortic VSMCs in HGPS and beneficial effects of TAS-102 treatment.
Created with BioRender.com.

References

    1. De Sandre-Giovannoli A, Bernard R, Cau P, Navarro C, Amiel J, Boccaccio I, et al. Lamin A truncation in Hutchinson-Gilford progeria. Science. 2003;300:2055. - PubMed
    1. Eriksson M, Brown WT, Gordon LB, Glynn MW, Singer J, Scott L, et al. Recurrent de novo point mutations in lamin A cause Hutchinson-Gilford progeria syndrome. Nature. 2003;423:293–8. - PMC - PubMed
    1. Lin F, Worman HJ. Structural organization of the human gene encoding nuclear lamin A and nuclear lamin C. J Biol Chem. 1993;268:16321–6. - PubMed
    1. Nigg EA, Kitten GT, Vorburger K. Targeting lamin proteins to the nuclear envelope: the role of CaaX box modifications. Biochem Soc Trans. 1992;20:500–4. - PubMed
    1. Ibrahim MX, Sayin VI, Akula MK, Liu M, Fong LG, Young SG, et al. Targeting isoprenylcysteine methylation ameliorates disease in a mouse model of progeria. Science. 2013;340:1330–3. - PMC - PubMed

MeSH terms

LinkOut - more resources