. 2024 Oct 1;15(1):8498.
doi: 10.1038/s41467-024-52898-y.

Superior metabolic improvement of polycystic ovary syndrome traits after GLP1-based multi-agonist therapy

Affiliations

Superior metabolic improvement of polycystic ovary syndrome traits after GLP1-based multi-agonist therapy

Miguel A Sánchez-Garrido et al. Nat Commun. .

Abstract

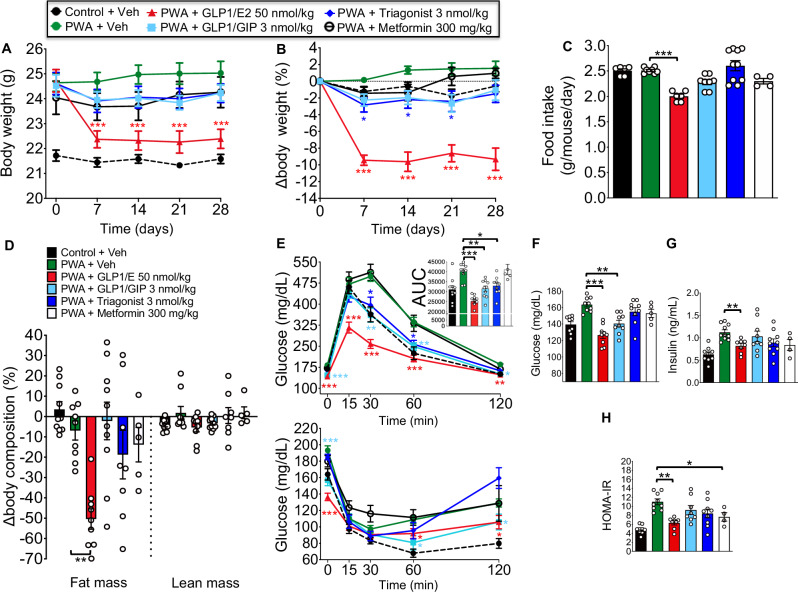
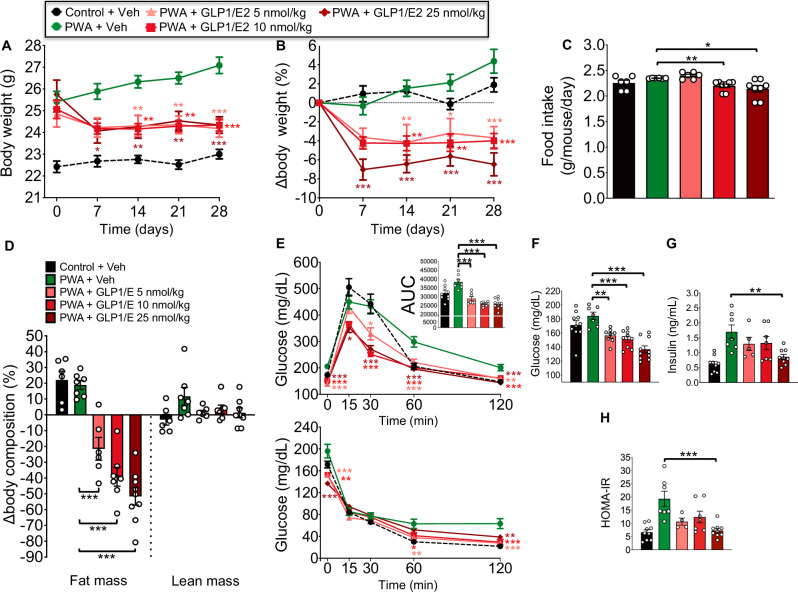
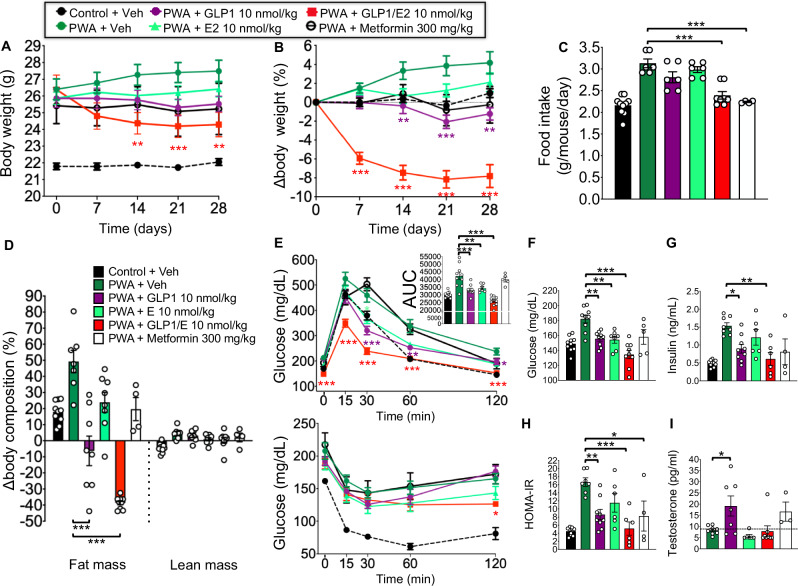
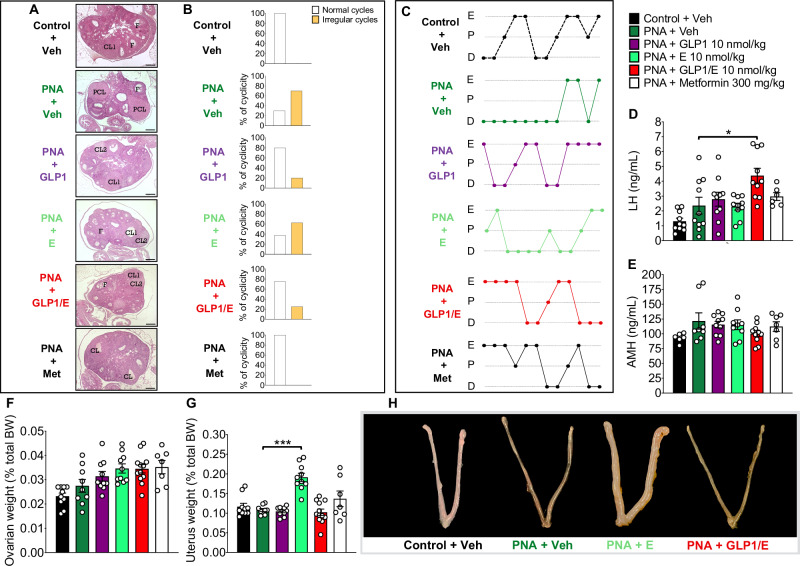
Polycystic ovary syndrome (PCOS) is a heterogeneous condition, defined by oligo-/anovulation, hyper-androgenism and/or polycystic ovaries. Metabolic complications are common in patients suffering PCOS, including obesity, insulin resistance and type-2 diabetes, which severely compromise the clinical course of affected women. Yet, therapeutic options remain mostly symptomatic and of limited efficacy for the metabolic and reproductive alterations of PCOS. We report here the hormonal, metabolic and gonadal responses to the glucagon-like peptide-1 (GLP1)-based multi-agonists, GLP1/Estrogen (GLP1/E), GLP1/gastric inhibitory peptide (GLP1/GIP) and GLP1/GIP/Glucagon, in two mouse PCOS models, with variable penetrance of metabolic and reproductive traits, and their comparison with metformin. Our data illustrate the superior efficacy of GLP1/E vs. other multi-agonists and metformin in the management of metabolic complications of PCOS; GLP1/E ameliorates also ovarian cyclicity in an ovulatory model of PCOS, without direct estrogenic uterotrophic effects. In keeping with GLP1-mediated brain targeting, quantitative proteomics reveals changes in common and distinct hypothalamic pathways in response to GLP1/E between the two PCOS models, as basis for differential efficiency. Altogether, our data set the basis for the use of GLP1-based multi-agonists, and particularly GLP1/E, in the personalized management of PCOS.


Conflict of interest statement

B.F., J.D.D., and B.Y. are former employees of Novo Nordisk. T.D.M. received funding from Novo Nordisk and speaking fees within the last 3 years from Novo Nordisk, Eli Lilly, Astra Zeneca, and Berlin Chemie AG. M.H.T. is a member of the SAB of ERX Pharmaceuticals, Inc. (last SAB meeting in 2019). Since 2018, he has served as the CSO and CEO of Helmholtz Munich (an academic research center with ca. 2500 scientists and staff). Helmholtz Munich is involved in numerous collaborations with a multitude of companies and institutions, worldwide. Cooperation, at times, involves research funding and includes (but are not limited to) interactions with e.g., Novo Nordisk, Boehringer Ingelheim, Roche Diagnostics, Arbormed, SCG Cell Therapy, and others. None of the above funding sources were involved in the preparation of this paper. M.T.S. has participated in the last 3 years in projects from Novo Nordisk and collaborated via grant agreements with the company Oxo-Life Ltd. (Barcelona, Spain), addressing therapeutic strategies for PCOS, although no connection exists between these projects/agreements and the present work. The rest of the authors have no conflict of interest to disclose in relation to the contents of this work.

Figures

Fig. 1
Fig. 1. Metabolic effects of high doses of different GLP1-based multi-agonists in PWA mice.
AH Effects on body weight (A), body weight change (B), food intake (C), body composition (fat and lean mass change) (D), glucose (upper panel) and insulin tolerance (E), fasting glucose (F), serum insulin levels (G), and HOMA-IR index (H) in PWA female mice daily administered with vehicle (saline), GLP1/E (100 nmol/kg), GLP1/GIP (10 nmol/kg), GLP1/GIP/Glucagon triagonist (10 nmol/kg) or metformin (300 mg/kg) during 28 days. In order to assess integral glucose levels in the glucose tolerance test, the area under the curve (AUC) was calculated using the trapezoidal rule. Data were presented as mean ± SEM. Group codes: Control + Veh (C); PWA + Veh (P); PWA + GLP1/E (G/E); PWA + GLP1/GIP (G/G); PWA + Triagonist (T); PWA + Metformin (M). For each panel, sample sizes (n) were as follows: A: C = 10; P = 10; G/E = 11; G/G = 11; T = 11; M = 10; B: C = 10; P = 10; G/E = 11; G/G = 11; T = 11; M = 9; C: C = 8; P = 8; G/E = 6; G/G = 12; T = 12; M = 9; D: C = 9; P = 9; G/E = 11; G/G = 11; T = 12; M = 9; E: (GTT) C = 9; P = 9; G/E = 11; G/G = 11; T = 12; M = 9; (ITT) C = 10; P = 9; G/E = 11; G/G = 11; T = 12; M = 9; F: C = 9; P = 9; G/E = 11; G/G = 10; T = 10; M = 9; G: C = 9; P = 9; G/E = 9; G/G = 10; T = 12; M = 9; H: C = 9; P = 7; G/E = 9; G/G = 9; T = 9; M = 8. Statistically significant differences were assessed by one-way ANOVA followed by Tukey’s multiple comparison tests to analyze the effects of compound intervention vs. vehicle administration in PWA mice. For reference purposes, control non-androgenized mice are included (black bars and dashed lines). Asterisks indicate statistical significance *P < 0.05, **P < 0.01, ***P < 0.001. Source data are provided as a Source Excel Data file (see Data availability).
Fig. 2
Fig. 2. Metabolic effects of high doses of different GLP1-based multi-agonists in PNA mice.
AH Effects on body weight (A), body weight change (B), food intake (C), body composition (fat and lean mass change) (D), glucose (upper panel) and insulin tolerance (E), fasting glucose (F), serum insulin levels (G), and HOMA-IR index (H) in PNA female mice daily administered with vehicle (saline), GLP1/E (100 nmol/kg), GLP1/GIP (10 nmol/kg), GLP1/GIP/Glucagon triagonist (10 nmol/kg), or metformin (300 mg/kg) during 28 days. In order to assess integral glucose levels in the glucose tolerance test, the area under the curve (AUC) was calculated using the trapezoidal rule. Data were presented as mean ± SEM. Group codes: Control + Veh (C); PNA + Veh (P’); PNA + GLP1/E (G/E); PNA + GLP1/GIP (G/G); PNA + Triagonist (T); PNA + Metformin (M). For each panel, sample sizes (n) were as follows: A: C = 9; P’ = 10; G/E = 9; G/G = 8; T = 9; M = 7; B: C = 9; P’ = 10; G/E = 9; G/G = 8; T = 9; M = 7; C: C = 8; P’ = 10; G/E = 9; G/G = 8; T = 8; M = 6; D: C = 9; P’ = 10; G/E = 8; G/G = 7; T = 9; M = 7; E: (GTT) C = 9; P’ = 10; G/E = 9; G/G = 8; T = 9; M = 7; (ITT) C = 9; P’ = 10; G/E = 9; G/G = 5; T = 6; M = 6; F: C = 9, P’ = 10; G/E = 9; G/G = 6; T = 9; M = 7; G: C = 9; P’ = 10; G/E = 9; G/G = 7; T = 9; M = 6; H: C = 9; P’ = 10; G/E = 9; G/G = 6; T = 9; M = 4. Statistically significant differences were assessed by one-way ANOVA followed by Tukey’s multiple comparison tests to analyze the effects of compound intervention vs. vehicle administration in PNA mice. For reference purposes, control non-androgenized mice are included (black bars and dashed lines). Asterisks indicate statistical significance *P < 0.05, **P < 0.01, ***P < 0.001. Source data are provided as a Source Excel Data file (see Data availability).
Fig. 3
Fig. 3. Metabolic effects of lower doses of different GLP1-based multi-agonists in PWA mice.
AH Effects on body weight (A), body weight change (B), food intake (C), body composition (fat and lean mass change) (D), glucose (upper panel) and insulin tolerance (E), fasting glucose (F), serum insulin levels (G), and HOMA-IR index (H) in PWA female mice daily administered with vehicle (saline), GLP1/E (50 nmol/kg), GLP1/GIP (3 nmol/kg), GLP1/GIP/Glucagon triagonist (3 nmol/kg) or metformin (300 mg/kg) during 28 days. In order to assess integral glucose levels in the glucose tolerance test, the area under the curve (AUC) was calculated using the trapezoidal rule. Data were presented as mean ± SEM. Group codes: Control + Veh (C); PWA + Veh (P); PWA + GLP1/E (G/E); PWA + GLP1/GIP (G/G); PWA + Triagonist (T); PWA + Metformin (M). For each panel, sample sizes (n) were as follows: A: C = 11; P = 10; G/E = 10; G/G = 10; T = 10; M = 5; B: C = 11; P = 10; G/E = 10; G/G = 10; T = 10; M = 5; C: C = 6; P = 8; G/E = 6; G/G = 8; T = 10; M = 4; D: C = 10; P = 9; G/E = 9; G/G = 10; T = 8; M = 5; E: (GTT & ITT) C = 11; P = 10; G/E = 10; G/G = 10; T = 10; M = 5; F: C = 9; P = 9; G/E = 9; G/G = 9; T = 9; M = 5; G: C = 9; P = 10; G/E = 8; G/G = 9; T = 10; M = 4; H: C = 7; P = 9; G/E = 8; G/G = 8; T = 9; M = 4. Statistically significant differences were assessed by one-way ANOVA followed by Tukey’s multiple comparison tests to analyze the effects of compound intervention vs. vehicle administration in PWA mice. For reference purposes, control non-androgenized mice are included (black bars and dashed lines). Asterisks indicate statistical significance *P < 0.05, **P < 0.01, ***P < 0.001. Source data are provided as a Source Excel Data file (see Data availability).
Fig. 4
Fig. 4. Metabolic effects of lower doses of different GLP1-based multi-agonists in PNA mice.
AH Effects on body weight (A), body weight change (B), food intake (C), body composition (fat and lean mass change) (D), glucose (upper panel) and insulin tolerance (E), fasting glucose (F), serum insulin levels (G), and HOMA-IR index (H) in PNA female mice daily administered with vehicle (saline), GLP1/E (50 nmol/kg), GLP1/GIP (3 nmol/kg), GLP1/GIP/Glucagon triagonist (3 nmol/kg) or metformin (300 mg/kg) during 28 days. In order to assess integral glucose levels in the glucose tolerance test, the area under the curve (AUC) was calculated using the trapezoidal rule. Data were presented as mean ± SEM. Group codes: Control + Veh (C); PNA + Veh (P’); PNA + GLP1/E (G/E); PNA + GLP1/GIP (G/G); PNA + Triagonist (T); PNA + Metformin (M). For each panel, sample sizes (n) were as follows: A: C = 11; P’ = 10; G/E = 10; G/G = 11; T = 10; M = 9; B: C = 11; P’ = 10; G/E = 9; G/G = 11; T = 10; M = 7; C: C = 10; P’ = 8; G/E = 8; G/G = 10; T = 6; M = 8; D: C = 10; P’ = 10; G/E = 8; G/G = 11; T = 10; M = 6; E: (GTT) C = 8; P’ = 8; G/E = 8; G/G = 8; T = 9; M = 8; (ITT) C = 10; P’ = 10; G/E = 10; G/G = 11; T = 10; M = 9; F: C = 10; P’ = 9; G/E = 8; G/G = 10; T = 10; M = 8; G: C = 8; P’ = 8; G/E = 10; G/G = 9; T = 8; M = 7; H: C = 7; P’ = 7; G/E = 8; G/G = 9; T = 8; M = 5. Statistically significant differences were assessed by one-way ANOVA followed by Tukey’s multiple comparison tests to analyze the effects of compound intervention vs. vehicle administration in PNA mice. For reference purposes, control non-androgenized mice are included (black bars and dashed lines). Asterisks indicate statistical significance *P < 0.05, **P < 0.01, ***P < 0.001. Source data are provided as a Source Excel Data file (see Data availability).
Fig. 5
Fig. 5. Metabolic effects of very low doses of GLP1/E in PWA mice.
AH Effects on body weight (A), body weight change (B), food intake (C), body composition (fat and lean mass change) (D), glucose (upper panel) and insulin tolerance (E), fasting glucose (F), serum insulin levels (G), and HOMA-IR index (H) in PWA female mice daily administered with vehicle (saline) or GLP1/E (5, 10, and 25 nmol/kg) during 28 days. In order to assess integral glucose levels in the glucose tolerance test, the area under the curve (AUC) was calculated using the trapezoidal rule. Data were presented as mean ± SEM. Group codes: Control + Veh (C); PWA + Veh (P); PWA + GLP1/E5 nmol/kg (G/E5); PWA + GLP1/E10 nmol/kg (G/E10); PWA + GLP1/E25 nmol/kg (G/E25). For each panel, sample sizes (n) were as follows: A: C = 10; P = 7; G/E5 = 8; G/E10 = 8; G/E25 = 10; B: C = 9; P = 7; G/E5 = 8; G/E10 = 8; G/E25 = 9; C: C = 6; P = 6; G/E5 = 6; G/E10 = 8; G/E25 = 8; D: C = 6; P = 7; G/E5 = 6; G/E10 = 7; G/E25 = 9; E: (GTT) C = 9; P = 8; G/E5 = 8; G/E10 = 9; G/E25 = 10; (ITT) C = 10; P = 8; G/E5 = 9; G/E10 = 8; G/E25 = 10; F: C = 10; P = 7; G/E5 = 8; G/E10 = 9; G/E25 = 10; G: C = 9; P = 7; G/E5 = 5; G/E10 = 7; G/E25 = 9; H: C = 9; P = 7; G/E5 = 4; G/E10 = 7; G/E25 = 9. Statistically significant differences were assessed by one-way ANOVA followed by Tukey’s multiple comparison tests to analyze the effects of compound intervention vs. vehicle administration in PWA mice. For reference purposes, control non-androgenized mice are included (black bars and dashed lines). Asterisks indicate statistical significance *P < 0.05, **P < 0.01, ***P < 0.001. Source data are provided as a Source Excel Data file (see Data availability).
Fig. 6
Fig. 6. Short-term metabolic effects of GLP1-based multi-agonists in PWA mice.
AG Effects on body weight change (A), food intake (B), body weight-correlated average energy expenditure (C), total locomotor activity (D), and respiratory quotient (E) in PWA female mice daily treated with vehicle, GLP1/E (10 nmol/kg), GLP1/GIP (10 nmol/kg), triagonist (10 nmol/kg), during 3 days. In addition, representative images and mean interscapular temperature (F, G) of the different experimental groups are shown. Data were presented as mean ± SEM. Group codes: Control + Veh (C); PWA + Veh (P); PWA + GLP1/E (G/E); PWA + GLP1/GIP (G/G); PWA + Triagonist (T). For each panel, sample sizes (n) were as follows: A: C = 10; P = 10; G/E = 10; G/G = 10; T = 9; B: C = 10; P = 10; G/E = 8; G/G = 10; T = 8; C: C = 10; P = 8; G/E = 10; G/G = 7; T = 9; D: C = 10; P = 10; G/E = 10; G/G = 10; T = 10; E: C = 10; P = 10; G/E = 10; G/G = 10; T = 10; G: C = 4; P = 5; G/E = 4; G/G = 5; T = 5. Statistically significant differences were assessed by one-way ANOVA followed by Tukey’s multiple comparison tests to analyze the effects of compound intervention vs. vehicle administration in PWA mice. For reference purposes, control non-androgenized mice are included (black bars and dashed lines). Asterisks indicate statistical significance *P < 0.05, **P < 0.01, ***P < 0.001 compared to PWA + Veh. Number sign indicate statistical significance #P < 0.05, # #P < 0.01, compared to PWA + Triagonist. Source data are provided as a Source Excel Data file (see Data availability).
Fig. 7
Fig. 7. Metabolic and endocrine effects of equivalent doses of GLP1, E, or GLP1/E in PWA mice.
AI Effects on body weight (A), body weight change (B), food intake (C), body composition (fat and lean mass change) (D), glucose (upper panel) and insulin tolerance (E), fasting glucose (F), serum insulin levels (G), HOMA-IR index (H), and serum testosterone concentrations (I) in PWA female mice daily administered with vehicle (saline), GLP1 (10 nmol/kg), estrogen (E, 10 nmol/kg), GLP1/E (10 nmol/kg), or metformin (300 mg/kg) during 28 days. In order to calculate integral glucose levels in the glucose tolerance test, the area under the curve (AUC) was calculated using the trapezoidal rule. Data were presented as mean ± SEM. Group codes: Control + Veh (C); PWA + Veh (P); PWA + GLP1 (G); PWA + E (E); PWA + GLP1/E (G/E); PWA + Metformin (M). For each panel, sample sizes (n) were as follows: A: C = 10; P = 9; G = 9; E = 8; G/E = 9; M = 5; B: C = 10; P = 9; G = 9; E = 8; G/E = 9; M = 4; C: C = 10; P = 6; G = 6; E = 6; G/E = 8; M = 4; D: C = 10; P = 7; G = 8; E = 8; G/E = 9; M = 4; E: (GTT) C = 10; P = 10; G = 9; E = 7; G/E = 10; M = 5; (ITT) C = 10; P = 9; G = 8; E = 8; G/E = 9; M = 5; F: C = 10; P = 9; G = 9; E = 7; G/E = 9; M = 5; G: C = 10; P = 8; G = 9; E = 6; G/E = 6; M = 4; H: C = 10; P = 7; G = 9; E = 6; G/E = 6; M = 4; I: P = 8; G = 7; E = 6; G/E = 8; M = 3. Statistically significant differences were assessed by one-way ANOVA followed by Tukey’s multiple comparison tests to analyze the effects of compound intervention vs. vehicle administration in PWA mice. For reference purposes, values from control non-androgenized mice are also included (black bars and dashed lines). Asterisks indicate statistical significance *P < 0.05, **P < 0.01, ***P < 0.001. Source data are provided as a Source Excel Data file (see Data availability).
Fig. 8
Fig. 8. Metabolic and endocrine effects of equivalent doses of GLP1, E, or GLP1/E in PNA mice.
AI Effects on body weight (A), body weight change (B), food intake (C), body composition (fat and lean mass change) (D), glucose (upper panel) and insulin tolerance (E), fasting glucose (F), serum insulin levels (G), HOMA-IR index (H), and serum testosterone concentrations (I) in PNA female mice daily administered with vehicle (saline), GLP1 (10 nmol/kg), estrogen (E, 10 nmol/kg), GLP1/E (10 nmol/kg), or metformin (300 mg/kg) during 28 days. In order to calculate integral glucose levels in the glucose tolerance test, the area under the curve (AUC) was calculated using the trapezoidal rule. Data were presented as mean ± SEM. Group codes: Control + Veh (C); PNA + Veh (P’); PNA + GLP1 (G); PNA + E (E); PNA + GLP1/E (G/E); PNA + Metformin (M). For each panel, sample sizes (n) were as follows: A: C = 10; P’ = 10; G = 10; E = 10; G/E = 11; M = 7; B: C = 10; P’ = 10; G = 10; E = 10; G/E = 11; M = 7; C: C = 10; P’ = 8; G = 8; E = 8; G/E = 6; M = 8; D: C = 10; P’ = 10; G = 9; E = 8; G/E = 12; M = 5; E: (GTT) C = 10; P’ = 10; G = 10; E = 10; G/E = 12; M = 8; (ITT) C = 10; P’ = 9; G = 8; E = 7; G/E = 9; M = 7; F: C = 10; P’ = 10; G = 10; E = 10; G/E = 12; M = 7; G: C = 8; P’ = 10; G = 8; E = 9; G/E = 11; M = 6; H: C = 8; P’ = 9; G = 8; E = 8; G/E = 8; M = 6; I: P’ = 8; G = 9; E = 10; G/E = 10; M = 7. Statistically significant differences were assessed by one-way ANOVA followed by Tukey’s multiple comparison tests to analyze the effects of compound intervention vs. vehicle administration in PNA mice. For reference purposes, values from control non-androgenized mice are included (black bars and dashed lines). Asterisks indicate statistical significance *P < 0.05, **P < 0.01, ***P < 0.001. Source data are provided as a Source Excel Data file (see Data availability).
Fig. 9
Fig. 9. Effects of equivalent doses of GLP1, E, or GLP1/E on reproductive indices in PNA mice.
AH Representative images of ovarian histology (A), percentage of ovarian cyclicity (B), individual profiles of ovarian cyclicity (C), circulating LH levels (D), serum anti-Mullerian hormone (AMH) concentration (E), ovarian and uterus weights (F, G), and representative images of uterus in PNA female mice (H), daily treated with vehicle, GLP1 (10 nmol/kg), estrogen (10 nmol/kg), GLP1/E (10 nmol/kg), or metformin (300 mg/kg) during 28 days. Data were presented as mean ± SEM. Group codes: Control + Veh (C); PNA + Veh (P’); PNA + GLP1 (G); PNA + E (E); PNA + GLP1/E (G/E); PNA + Metformin (M). For each panel, sample sizes (n) were as follows: A, B: C = 5; P’ = 5; G = 5; E = 5; G/E = 5; M = 5; C: C = 10; P’ = 9; G = 10; E = 10; G/E = 12; M = 7; D: C = 10; P’ = 10; G = 10; E = 10; G/E = 10; M = 6; E: C = 6; P’ = 8; G = 10; E = 9; G/E = 10; M = 7; F, G: C = 10; P’ = 9; G = 10; E = 10; G/E = 12; M = 7. Statistically significant differences were assessed by one-way ANOVA followed by Tukey’s multiple comparison tests to analyze the effects of compound intervention vs. vehicle administration in PNA mice. For reference purposes, values from control non-androgenized mice are included (black bars and dashed lines). Asterisks indicate statistical significance *P < 0.05, **P < 0.01, ***P < 0.001. CL corpus luteum, PCL persistent corpus luteum, F follicle, E estrus, P proestrus, D diestrus. Scale bars correspond to 200 μm. Source data are provided as a Source Excel Data file (see Data availability).
Fig. 10
Fig. 10. Effects of treatment with GLP1/E on hypothalamic proteome in PWA and PNA mice.
A Heatmaps display the normalized intensity of protein expression across different conditions. The clustering method used is Ward, and the distance measured is Euclidean. The left heatmap compares PWA + Vehicle (control) against PWA + GLP1/E (treatment), and the right heatmap compares PNA + Vehicle (control) against PNA + GLP1/E (treatment). B Volcano plots illustrate the differential protein levels between treatment and control conditions. A two-sided, unpaired t-test was used to compare the two groups to assess significant differences in their means. The left plot shows PWA + Vehicle vs. PWA + GLP1/E, while the right plot shows PNA + Vehicle vs. PNA + GLP1/E. Proteins with significant differential expression (FDR threshold 0.1) are highlighted, with upregulated proteins in red and downregulated ones in blue. C Random Forest out-of-bag (OOB) error shows OOB error plots from Random Forest analysis for PWA (left) and PNA (right) conditions. The overall error, as well as errors for each specific condition (PWA+Vehicle, PWA + GLP1/E, PNA + Vehicle, and PNA + GLP1/E), are shown, indicating the model’s performance and classification accuracy across different numbers of trees. D Variable Importance from Random Forest plots showing the mean decrease accuracy of the most important proteins identified by Random Forest analysis. The left panel represents the PWA condition, and the right panel represents the PNA. Proteins are ranked based on their importance in distinguishing between the control and treatment groups. E Boxplots depicting the expression levels of the most significant proteins identified by Random Forest analysis. The three boxplots on the left show representative normalized concentrations for PWA condition (RABGGTA, SRSF4, and NCEH1), while the right set of three boxplots shows similar results for PNA (CPOX, CAMK2B, and BCAP31). For each protein, normalized expression levels are compared between Vehicle (green) and GLP1/E treatment (red) groups. The X-axis denotes the experimental groups (i.e., vehicle or GLP1/E), while the Y-axis corresponds to the normalized protein concentrations. The boxes represent the interquartile range (IQR) of the normalized values, spanning from the 25th percentile (Q1) to the 75th percentile (Q3), with the median indicated by horizontal lines. The yellow diamond denotes the mean value. The whiskers extend to the minimum and maximum values within the data distribution. F Selected enriched pathways upregulated and downregulated in PWA and PNA mice after intervention with GLP1/E are represented in bar graphs. The statistical test used was the hypergeometric test, adjusted using FDR. The x-axis displays the −log10 of the adjusted P value. Group codes: PWA + Veh (P); PWA + GLP1/E (P + G/E); PNA + Veh (P’); PNA + GLP1/E (P’ + G/E). Sample sizes (n) were as follows: A: (Left panel) P = 8; P + G/E = 8; (Right panel) P’ = 8; P’ + G/E = 6; B: (Left panel) P = 8; P + G/E = 8; (Right panel) P’ = 8; P’ + G/E = 8; C: (Left panel) P = 8; P + G/E = 8; (Right panel) P’ = 8; P’ + G/E = 8; D: (Left panel) P = 8; P + G/E 8; (Right panel) P’ = 8; P’ + G/E = 8; E: (Left panel) P = 8; P + G/E = 8, (Right panel) P’ = 8; P’ + G/E = 8; F: (Left panel) P = 8; P + G/E = 8; (Right panel) P’ = 8; P’ + G/E = 8. MS proteomics data have been deposited to the ProteomeXchange Consortium via the PRIDE partner repository (see Data availability).

References

    1. Wang, R. et al. First-line ovulation induction for polycystic ovary syndrome: an individual participant data meta-analysis. Hum. Reprod. Update25, 717–732 (2019). - PubMed
    1. Kakoly, N. S. et al. Ethnicity, obesity and the prevalence of impaired glucose tolerance and type 2 diabetes in PCOS: a systematic review and meta-regression. Hum. Reprod. Update24, 455–467 (2018). - PubMed
    1. Ding, T. et al. The prevalence of polycystic ovary syndrome in reproductive-aged women of different ethnicity: a systematic review and meta-analysis. Oncotarget8, 96351–96358 (2017). - PMC - PubMed
    1. Franks, S. Assessment and management of anovulatory infertility in polycystic ovary syndrome. Endocrinol. Metab. Clin. North Am.32, 639–651 (2003). - PubMed
    1. Sanchez-Garrido, M. A. & Tena-Sempere, M. Metabolic dysfunction in polycystic ovary syndrome: pathogenic role of androgen excess and potential therapeutic strategies. Mol. Metab.35, 100937 (2020). - PMC - PubMed

Publication types