. 2024 Oct 2;15(1):8519.
doi: 10.1038/s41467-024-53002-0.

CHIP ameliorates nonalcoholic fatty liver disease via promoting K63- and K27-linked STX17 ubiquitination to facilitate autophagosome-lysosome fusion

Affiliations

CHIP ameliorates nonalcoholic fatty liver disease via promoting K63- and K27-linked STX17 ubiquitination to facilitate autophagosome-lysosome fusion

Hyunjin Rho et al. Nat Commun. .

Erratum in

Abstract

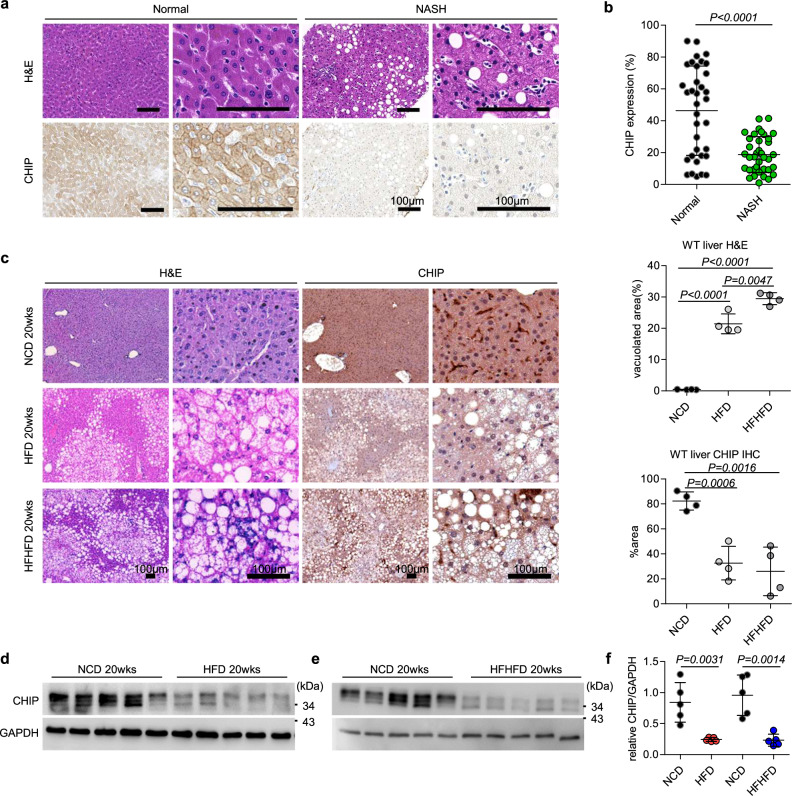
The fusion of autophagosomes and lysosomes is essential for the prevention of nonalcoholic fatty liver disease (NAFLD). Here, we generate a hepatocyte-specific CHIP knockout (H-KO) mouse model that develops NAFLD more rapidly in response to a high-fat diet (HFD) or high-fat, high-fructose diet (HFHFD). The accumulation of P62 and LC3 in the livers of H-KO mice and CHIP-depleted cells indicates the inhibition of autophagosome-lysosome fusion. AAV8-mediated overexpression of CHIP in the murine liver slows the progression of NAFLD induced by HFD or HFHFD feeding. Mechanistically, CHIP induced K63- and K27-linked polyubiquitination at the lysine 198 residue of STX17, resulting in increased STX17-SNAP29-VAMP8 complex formation. The STX17 K198R mutant was not ubiquitinated by CHIP; it interfered with its interaction with VAMP8, rendering STX17 incapable of inhibiting steatosis development in mice. These results indicate that a signaling regulatory mechanism involving CHIP-mediated non-degradative ubiquitination of STX17 is necessary for autophagosome-lysosome fusion.


Conflict of interest statement

The authors declare no competing interests.

Figures

Fig. 1
Fig. 1. The expression of CHIP is down-regulated in the liver specimens of NASH patients and liver tissues of mice fed high-fat diet (HFD) or high-fat, high-fructose diet (HFHFD).
Immunohistochemical detection of CHIP protein in human normal and nonalcoholic fatty liver specimens. a Representative immunohistochemical staining images for CHIP in formalin-fixed paraffin-embedded (FFPE) liver tissues. H&E staining of FFPE human liver samples diagnosed as normal and NASH are shown at top of the image. Scale bar shown is 100 µm. b A dot plot of CHIP expression in human liver samples (Normal, n = 35; NASH, n = 37). CHIP expression was significantly lower in NASH specimens compared to normal liver tissues. Mice were fed a NCD, HFD, or HFHFD for 20 weeks (n = 5). c Representative images of liver sections stained with H&E and anti-CHIP antibody as indicated. df Western blotting and quantification of the liver samples. Data are presented as individual data points, mean ± SD is assessed by unpaired two-tailed t-test. NCD, normal chow diet; HFD high-fat diet, HFHFD high-fat high-fructose diet.
Fig. 2
Fig. 2. CHIP promotes the lipophagy pathway by facilitating autolysosome formation.
Representative images demonstrate lipid staining with Nile red (orange) and Hoechst staining of DNA (blue). The image dataset contains at least 4 randomly chosen fluorescence microscopy images. a HepG2 cells with CHIP knockdown, stable overexpression of (b) CHIP-WT, (c) CHIP-WT, CHIP-H260Q, or CHIP K30A were treated with OA overnight. Representative images with autophagosome (yellow puncta) and autolysosome (red puncta) are shown. d HepG2 cells with CHIP knockdown or (e) stable overexpression of CHIP-WT, CHIP-H260Q, or CHIP-K30A were transfected with RFP-GFP-LC3 and treated with OA overnight. f HepG2 cells with CHIP knockdown or (g) FLAG-CHIP overexpression were treated with or without OA and BafA1, followed by western blot analysis. h Confocal microscopy immunofluorescence of HA-CHIP (magenta) and lipid staining with BODIPY 493/503 (green) showed the colocalization of CHIP and lipid droplets (h1) and the decreased level of lipid droplets around the region of CHIP with high expression (h2). Data are presented as individual data points, mean ± SD is assessed by unpaired two-tailed t-test. LD lipid droplet, BSA bovine serum albumin, OA oleic acid, BafA1 bafilomycin A1.
Fig. 3
Fig. 3. HFD exacerbates liver steatosis, inflammation, fibrosis, and metabolic syndromes in H-KO mice.
a Eight-week-old WT and H-KO mice individually housed were fed a HFD for 20 weeks. b Representative livers of mice fed a HFD (left), and the calculated percentage of liver weight/body weight ratio (right). Grid cubes are 5 mm*5 mm. c Representative western blot images exhibiting P62, LC3, and STX17 expression in the liver samples of HFD-fed mice. dg Representative images of liver samples stained with H&E (n = 13), Oil red O (WT, n = 7; H-KO, n = 9), f4/80 immunohistochemistry (n = 7), and Sirius red (n = 12). hi Hepatic TG and TC levels, and serum ALT and AST levels in mice fed an HFD (n = 7). j Glucose tolerance tests (n = 5) and k insulin tolerance tests (n = 5) were conducted. l Representative western blot images demonstrating the insulin-stimulated phosphorylation of AKT in livers. Mice were injected with either PBS (−) or insulin (+). The error bars in (j) and (k) indicate SD. Data are presented as individual data points, mean ± SD is assessed by unpaired two-tailed t-test.
Fig. 4
Fig. 4. Impaired hepatic lipophagy in HFD-fed H-KO mouse liver induces NASH-like phenotypes via activating aHSCs, M1 Kupffer cells, and pro-inflammatory T cell activation in a protein-dependent manner.
a Schematic representation of snRNAseq analysis of HFD-fed WT and H-KO mouse livers (n = 3). b Uniform manifold approximation and projection (UMAP) visualize clustering of liver single-nucleus transcriptomes (Total 71,058 cells), and the color represents annotations of different cell types. Thirty-three clusters were identified into 11 cell types. c Dot plot displaying the expression of cell-type-specific marker genes used to identify liver cell populations. d GSEA data of top 10 regulated pathways in hepatocytes. e GSEA data of pathways related to metabolism, inflammation, and fibrosis in hepatocytes. f UMAP visualizes subclustering of HSCs from 11 clusters to qHSCs and aHSCs and the color represents annotation of different cell types. Box and whisker plot indicates the proportion of qHSCs and aHSCs in WT and H-KO samples (n = 3). The top end of vertical line represents the maximum value, the horizontal lines represent third quartile, median, and first quartile from the top to bottom, and the dot represents the average. gi Violin plots of representative DEGs in aHSCs, qHSCs, Kupffer cells, and T cells, respectively. Statistical analyses of RNAseq results were performed using the Wilcox test in R version 4.3.0. HSCs hepatic stellate cells, qHSCs quiescent HSCs, aHSCs activated HSCs.
Fig. 5
Fig. 5. H-KO mice develop severe NASH under a HFHFD.
a Eight-week-old WT and H-KO mice individually housed were fed a HFHFD for 24 weeks. b Representative livers of mice fed a HFHFD (left), and the calculated percentage of liver weight/body weight ratio (right) (n = 9). Grid cubes are 5 mm*5 mm. c, d Representative western blot images and quantitation graph exhibiting P62, LC3, and STX17 expression in the liver samples of HFHFD-fed mice (n = 6). eh Representative images of liver samples (n = 7) stained with H&E, Oil red O, f4/80 immunohistochemistry, and Sirius red. i, j Hepatic TG (n = 7) and TC (WT, n = 7; H-KO, n = 8) levels, and serum ALT (n = 7) and AST (n = 8) levels in mice fed a HFHFD. k, l qRT-PCR was used to quantify the relative transcript levels of inflammation and fibrosis genes in mouse liver samples (n = 7–9). Data are presented as individual data points, mean ± SD is assessed by unpaired two-tailed t-test. GOI, gene of interest.
Fig. 6
Fig. 6. CHIP promotes SNARE complex formation, which is necessary for autophagosome and lysosome fusion.
a Representative immunohistochemical staining images for CHIP and STX17 in formalin-fixed paraffin-embedded (FFPE) liver tissues. H&E staining of FFPE human liver samples diagnosed as normal and NASH are shown at top of the image. Scale bar shown is 100 µm. b, c Mice were fed a NCD, HFD, or HFHFD for 20 weeks (n = 5). Western blotting and quantification of the liver samples. d Lysates of HepG2 cells transfected with the plasmid expressing HA-VAMP8 were immunoprecipitated using anti-STX17 antibodies, followed by western blotting. e The plasmid expressing FLAG-CHIP was co-transfected with the plasmid expressing HA-STX17, HA-SNAP29, or HA-VAMP8 in 293FT cells. The lysates were immunoprecipitated using anti-HA antibodies, followed by western blotting. f HepG2 cells expressing HA-VAMP were treated with OA. The lysates were immunoprecipitated with anti-CHIP antibodies, followed by western blotting. Lysates from each cell type treated with OA overnight were immunoprecipitated with anti-STX17 antibodies, followed by western blotting. g HepG2 cells stably transfected with plasmids #3 or #4 expressing CHIP-shRNAs. h Primary hepatocytes isolated from WT and H-KO mice. i HepG2 cells transfected with plasmids overexpressing HA-CHIP-WT, HA-CHIP-H260Q, or HA-CHIP-K30A. Immunofluorescence analyses of HepG2 cells using confocal microscopy was conducted as follows: j HepG2 cells; k HepG2 cells were transfected with the plasmid expressing HA-CHIP and FLAG-STX17; l CHIP was knocked down in HepG2 cells, followed by transfection with plasmids expressing FLAG-STX17 and HA-VAMP. m HepG2 cells stably overexpressing CHIP-WT, CHIP-H260Q, or CHIP-K30A were transfected with plasmids overexpressing FLAG-STX17 and HA-VAMP8. HepG2 cells overexpressing indicated plasmids were treated with OA overnight, followed by immunofluorescent analysis employing anti-CHIP, anti-STX17, anti-HA, and anti-FLAG antibodies. The graphs indicate fluorescence intensities (white arrow). Data are presented as individual data points, mean ± SD is assessed by unpaired two-tailed t-test.
Fig. 7
Fig. 7. CHIP-mediated K63- and K27-linked ubiquitination of the STX17 K198 residue accelerates SNARE complex formation.
a Lysates of HepG2 cells treated with or without OA were immunoprecipitated using anti-STX17 antibodies, followed by western blotting. b, c HepG2 cells stably transfected with HA-Ub, and plasmid #3 or #4 expressing CHIP-shRNA, or plasmids overexpressing FLAG-CHIP-WT, FLAG-CHIP-HQ, or FLAG-CHIP-KA, as indicated, were treated with OA overnight. Lysates were immunoprecipitated using anti-STX17 antibodies, followed by western blotting. d, e 293FT cells were transfected with plasmids expressing FLAG-STX17-WT, FLAG-STX17-1KR, FLAG-STX17-3KR, FLAG-STX17-4KR, myc-CHIP, HA-Ub, or HA-VAMP8, as indicated. Cell lysates were immunoprecipitated with anti-FLAG antibodies, followed by western blotting. f Immunofluorescence analysis of HepG2 cells was conducted by confocal microscopy, as follows. Cells were treated with OA overnight and transfected with plasmids expressing FLAG-STX17-WT, FLAG-STX17-1KR, FLAG-STX17-3KR, FLAG-STX17-4KR, and HA-VAMP8, as indicated, followed by immunofluorescence analysis using anti-FLAG and anti-HA antibodies. Graphs indicate the fluorescence intensity (white arrow). g, h 293FT cells were transfected with plasmids expressing HA-Ub-WT, HA-Ub-K63, HA-Ub-K27, HA-Ub-K63K27, HA-UbK63RK27R, FLAG-STX17, or myc-CHIP, as indicated. Cell lysates were immunoprecipitated with anti-FLAG antibodies, followed by western blotting. Lysates of (i) primary hepatocytes isolated from WT and H-KO mice, and (j) NCD-, HFD-, and HFHFD-fed mouse liver samples immunoprecipitated using anti-STX17 antibodies, followed by western blotting (n = 4). Data are presented as individual data points, mean ± SD is assessed by paired two-tailed t-test.
Fig. 8
Fig. 8. STX17 1KR mutant is defective in CHIP-mediated ubiquitination, preventing lipophagy under an HFD.
Representative images with autophagosome (yellow puncta) and autolysosome (red puncta). a HepG2 cells with STX17 knockdown or (b) stable overexpression of STX17-WT, STX17-1KR, STX17-3KR or STX17-4KR were transfected with RFP-GFP-LC3 and treated with OA overnight. Representative images demonstrating lipid staining with Nile red (orange) and Hoechst staining of DNA (blue). c HepG2 cells stably overexpressing CHIP-WT were co-transfected with plasmids #2 or #4 expressing STX17-shRNAs, and (d) HepG2 cells overexpressing STX17-WT were co-transfected with plasmids #3 or #4 expressing CHIP-shRNAs. Both cell lines were treated with OA overnight. Eight-week-old mice were individually housed for 10 weeks with a HFD and intravenously injected with the plasmids expressing control (CON), HA-mSTX17-WT (mSTX), or HA-mSTX17-1KR (m1KR) on days 4 and 1 prior to sacrifice. e Representative livers of mice fed a HFD (left) and the calculated percentage of liver weight/body weight ratio (right) (n = 7). Grid cubes are 5 mm*5 mm. f, g Representative images of liver samples stained with H&E or Oil red O (n = 8). h Hepatic TG (n = 9) and TC (n = 7) levels in mice fed an HFD. i Calculated number of autophagic vesicles per field (n = 4). j Representative TEM images (n = 4). Autophagosomes (yellow arrows) and autolysosomes (blue arrows) are indicated in the images. k Lysates of mSTX17 and m1KR liver samples were immunoprecipitated with anti-STX17 antibodies, followed by western blotting. l Immunofluorescence analyses of CON, mSTX17, and m1KR mouse liver samples using confocal microscopy were conducted using anti-STX17, anti-SNAP29, and anti-VAMP8 antibodies. Graphs indicate fluorescence intensities (white arrow). Data are presented as individual data points, mean ± SD is assessed by unpaired two-tailed t-test. LD lipid droplet.
Fig. 9
Fig. 9. AAV8-mediated CHIP overexpression in the liver inhibits NAFLD progression in response to HFD or HFHFD.
ai; r, s Eight-week-old mice were individually housed for 16 weeks with a HFD and intravenously injected with AAV8-GFP or AAV8-CHIP-GFP 8 weeks prior to sacrifice. a Representative livers of mice fed a HFD (left) and the calculated percentage of liver weight/body weight ratio (right) (n = 12). Grid cubes are 5 mm*5 mm. bd Representative images of liver samples stained with Oil red O, f4/80 immunohistochemistry, and Sirius red. e, f Hepatic TG (n = 11), TC levels (n = 11), and serum ALT (n = 10), AST (n = 8) levels in mice fed an HFD. g Glucose tolerance tests (n = 8) and h insulin tolerance tests (n = 7) were conducted. (i) Representative western blot images demonstrating the insulin-stimulated phosphorylation of AKT in livers. Mice were injected with either PBS (−) or insulin (+). j, q Eight-week-old mice were individually housed for 20 weeks with a HFHFD and intravenously injected with AAV8-GFP or AAV8-CHIP-GFP 10 weeks prior to sacrifice. j Representative livers of mice fed a HFHFD (left) and the calculated percentage of liver weight/body weight ratio (right) (n = 7). Grid cubes are 5 mm*5 mm. km Representative images of liver samples stained with Oil red O, f4/80 immunohistochemistry, and Sirius red. n, o qRT-PCR was used to quantify the relative transcript levels of inflammation and fibrosis genes in mouse liver samples (n = 7). p, q Hepatic TG (n = 7), TC (n = 7) levels, and serum ALT (n = 8), AST (n = 8) levels in mice fed an HFD. r Lysates of HFD-fed CON and OE mouse liver samples were immunoprecipitated with anti-STX17, followed by western blotting. s Representative images of immunofluorescence analyses of HFD-fed CON and OE mouse liver samples using confocal microscopy conducted using anti-STX17, anti-SNAP29, and anti-VAMP8 antibodies. Graphs indicate fluorescence intensities (white arrow). The error bars in (g) and (h) indicate SD. Data are presented as individual data points, mean ± SD is assessed by unpaired two-tailed t-test. GOI gene of interest.

References

    1. Wai-Sun Wong, V., Ekstedt, M., Lai-Hung Wong, G. & Hagstrom, H. Changing epidemiology, global trends and implications for outcomes of NAFLD. J. Hepatol.79, 842–852 (2023). - PubMed
    1. Khan, R. S., Bril, F., Cusi, K. & Newsome, P. N. Modulation of insulin resistance in nonalcoholic fatty liver disease. Hepatology70, 711–724 (2019). - PubMed
    1. Rinella, M.E. et al. A multi-society Delphi consensus statement on new fatty liver disease nomenclature. J. Hepatol.78, 1966–1986 (2023). - PubMed
    1. Shah, P. A., Patil, R. & Harrison, S. A. NAFLD-related hepatocellular carcinoma: the growing challenge. Hepatology77, 323–338 (2023). - PMC - PubMed
    1. Huang, D. Q. et al. Changing global epidemiology of liver cancer from 2010 to 2019: NASH is the fastest growing cause of liver cancer. Cell Metab.34, 969–977 e962 (2022). - PMC - PubMed

Publication types

MeSH terms

Associated data