. 2024 Oct 1;15(1):8481.
doi: 10.1038/s41467-024-52812-6.

Spatiotemporal control of neutrophil fate to tune inflammation and repair for myocardial infarction therapy

Affiliations

Spatiotemporal control of neutrophil fate to tune inflammation and repair for myocardial infarction therapy

Cheesue Kim et al. Nat Commun. .

Abstract

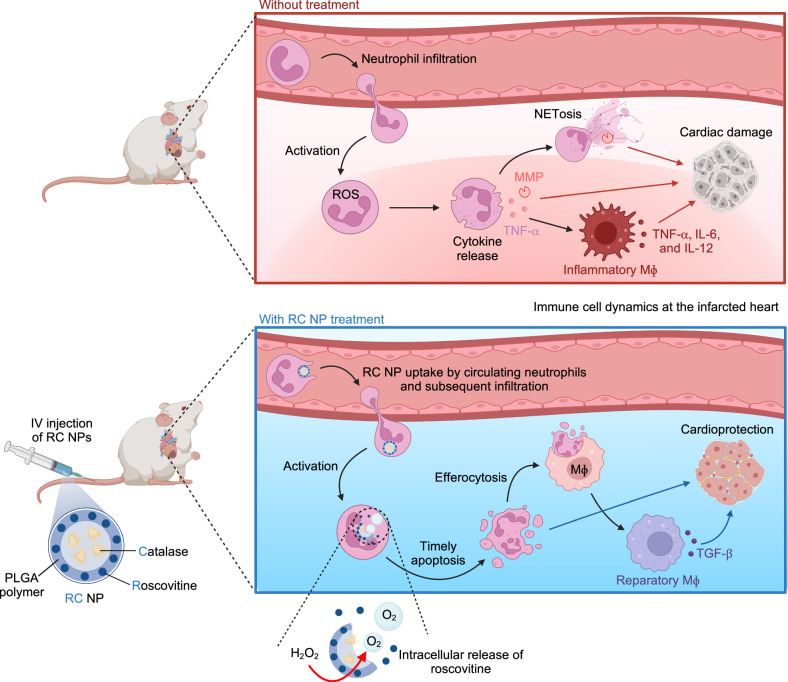
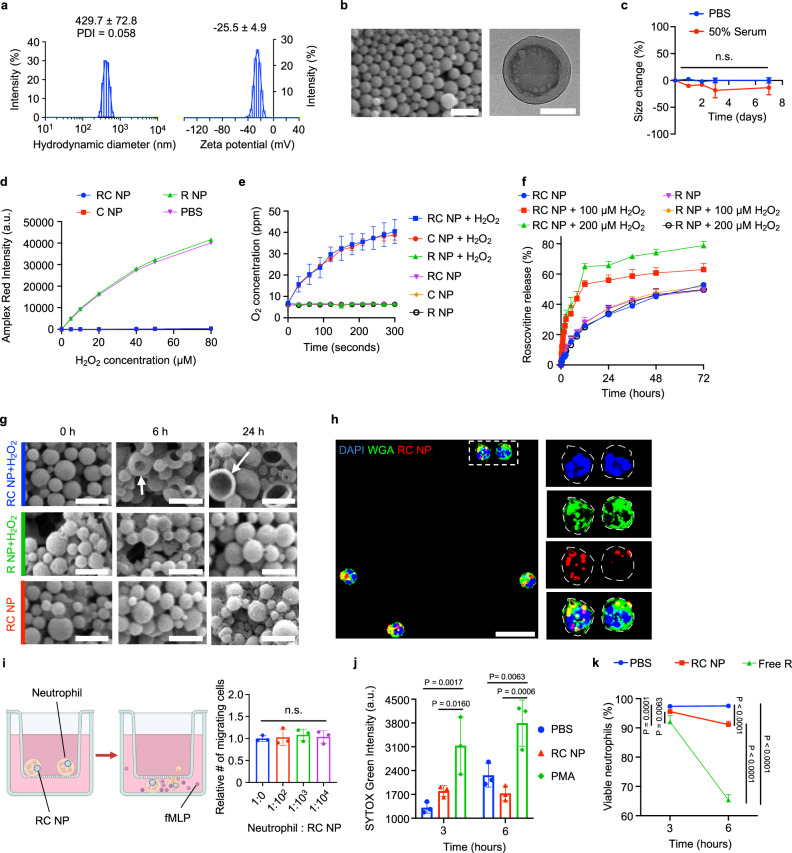
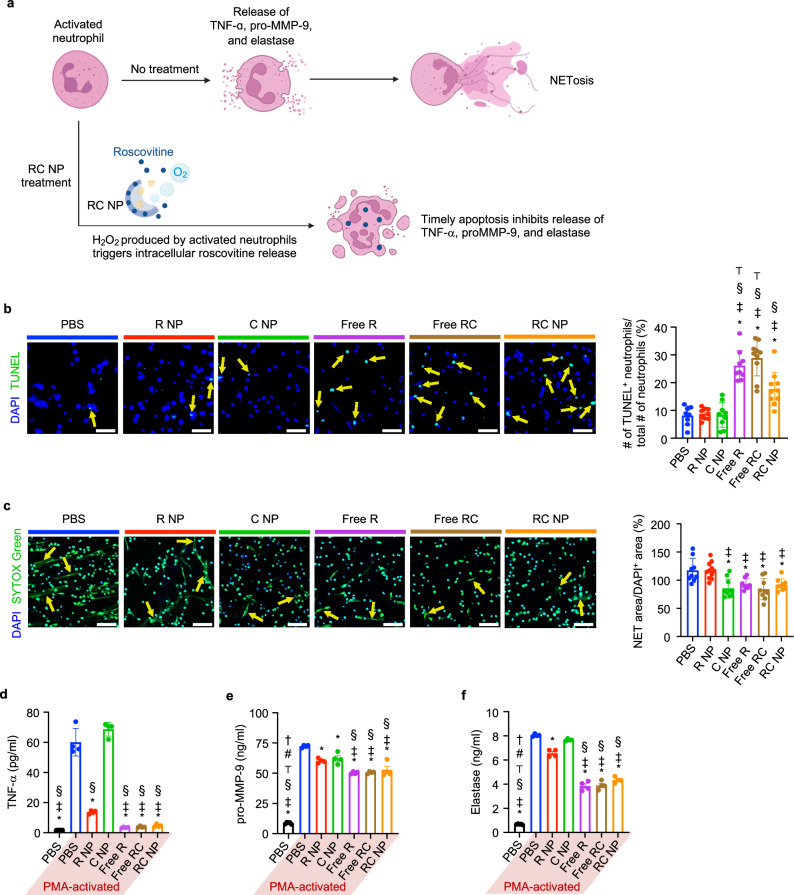
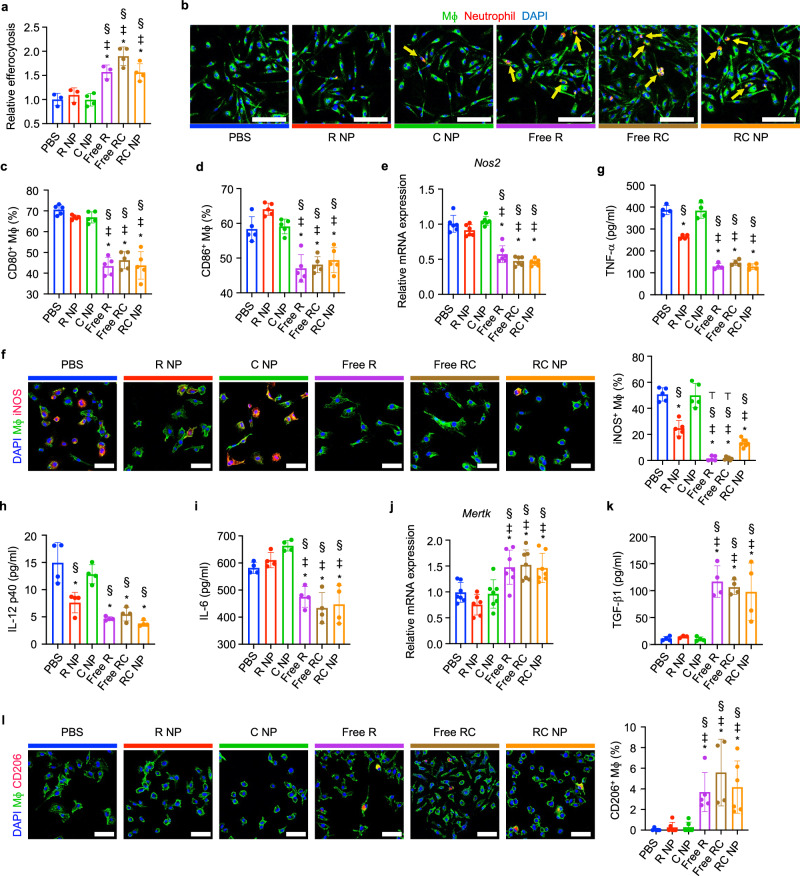
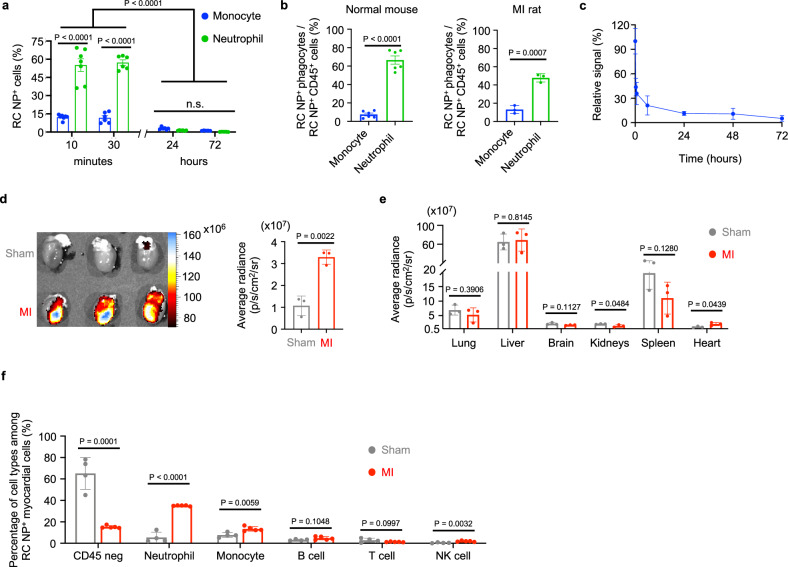
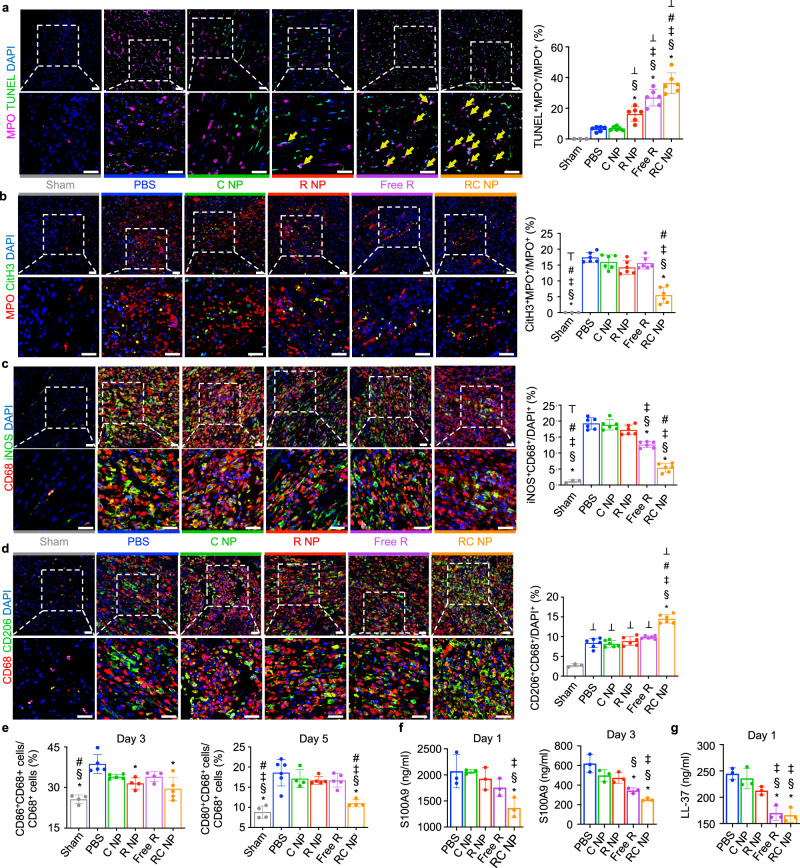
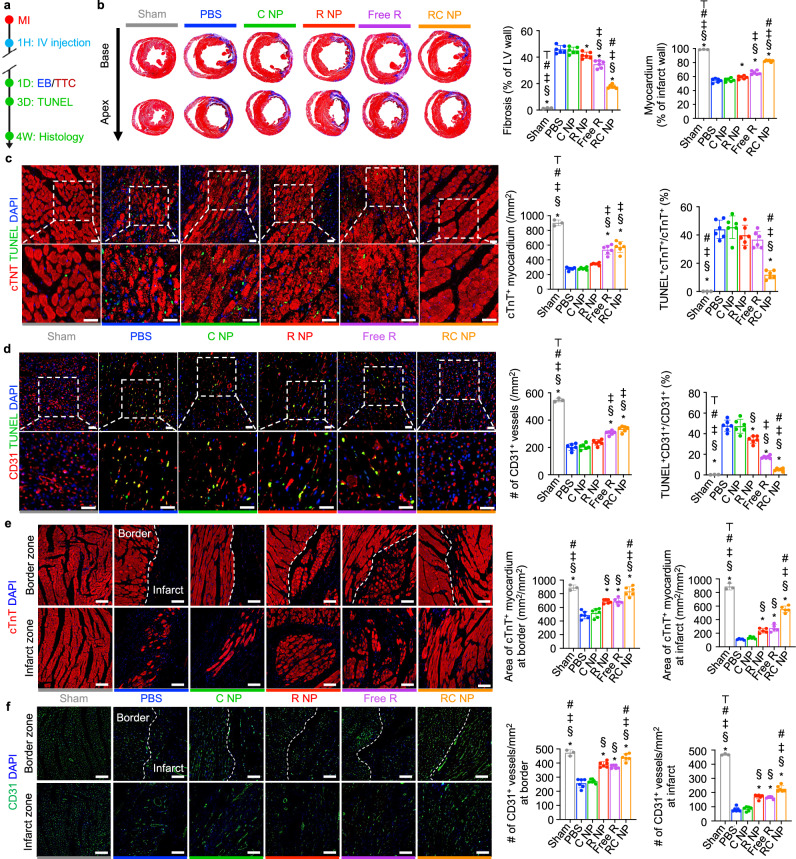
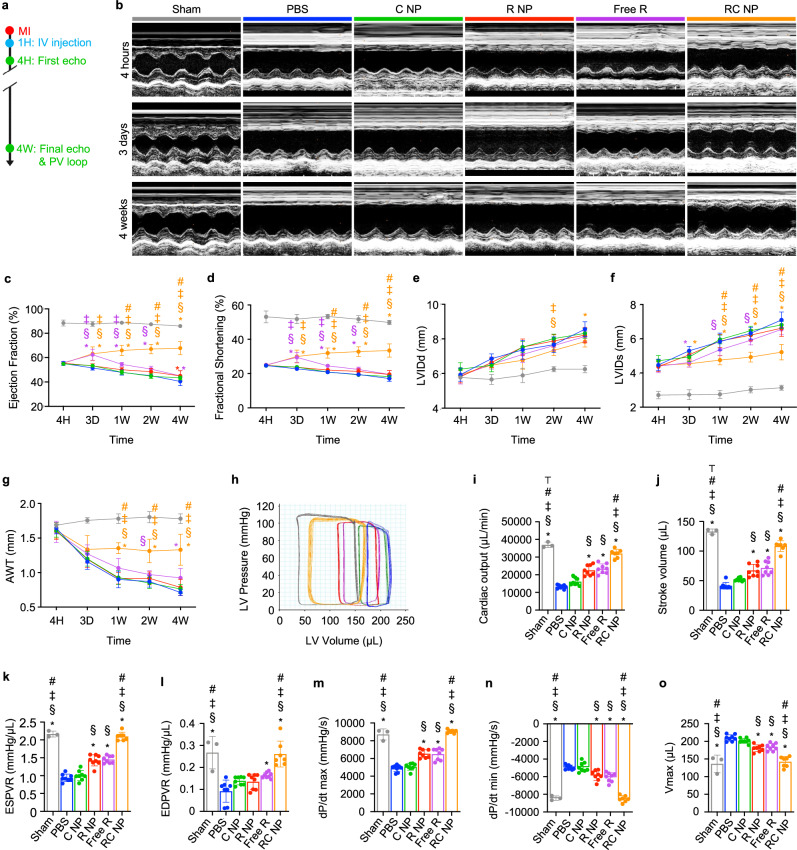
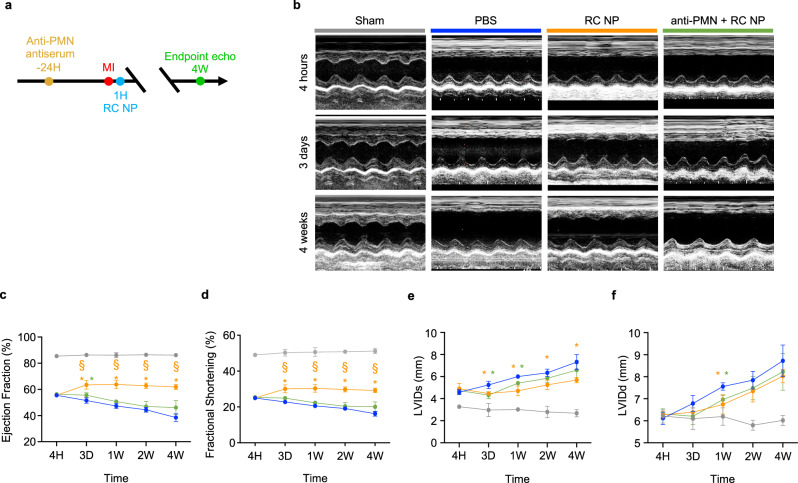
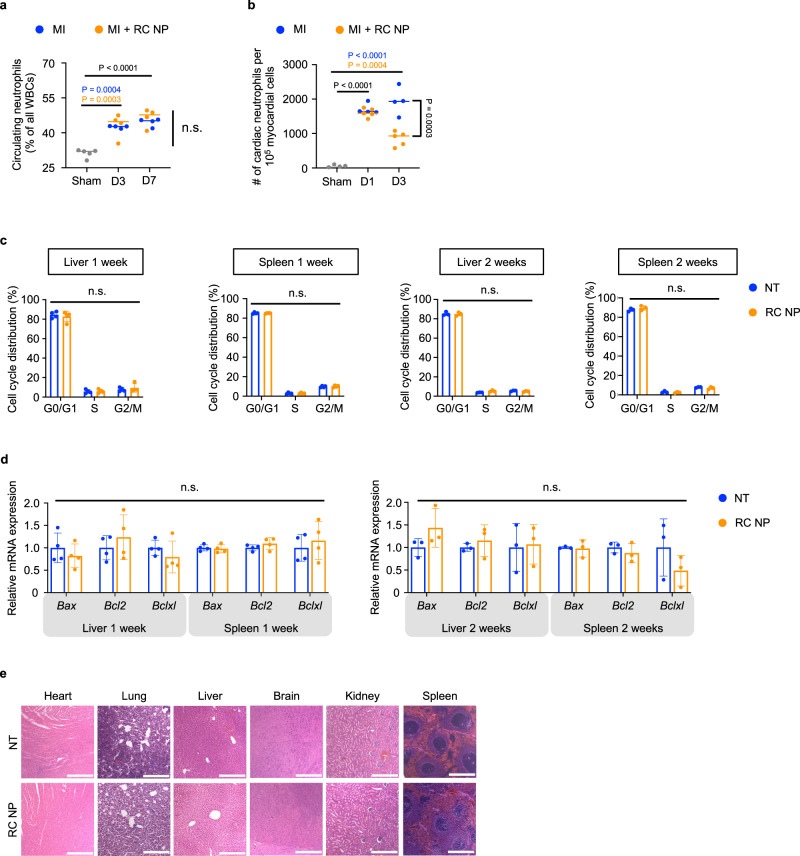
Neutrophils are critical mediators of both the initiation and resolution of inflammation after myocardial infarction (MI). Overexuberant neutrophil signaling after MI exacerbates cardiomyocyte apoptosis and cardiac remodeling while neutrophil apoptosis at the injury site promotes macrophage polarization toward a pro-resolving phenotype. Here, we describe a nanoparticle that provides spatiotemporal control over neutrophil fate to both stymie MI pathogenesis and promote healing. Intravenous injection of roscovitine/catalase-loaded poly(lactic-co-glycolic acid) nanoparticles after MI leads to nanoparticle uptake by circulating neutrophils migrating to the infarcted heart. Activated neutrophils at the infarcted heart generate reactive oxygen species, triggering intracellular release of roscovitine, a cyclin-dependent kinase inhibitor, from the nanoparticles, thereby inducing neutrophil apoptosis. Timely apoptosis of activated neutrophils at the infarcted heart limits neutrophil-driven inflammation, promotes macrophage polarization toward a pro-resolving phenotype, and preserves heart function. Modulating neutrophil fate to tune both inflammatory and reparatory processes may be an effective strategy to treat MI.


Conflict of interest statement

The authors declare no competing interests.

Figures

Fig. 1
Fig. 1. Schematic illustration of neutrophil and macrophage (Mϕ) dynamics in the heart following myocardial infarction (MI) with and without intravenous injection of roscovitine/catalase-loaded poly(lactide-co-glycolide) nanoparticles (RC NPs).
Neutrophils infiltrate the ischemic heart shortly after MI, where they are activated by stimuli from dying cardiac cells. (Upper panel) Activated neutrophils produce reactive oxygen species (ROS, e.g., H2O2) and secrete MMPs, inflammatory cytokines, and NETs that promote cardiomyocyte apoptosis and tissue destruction. Overexuberant neutrophil signaling also suppresses reparatory processes mediated by Mϕs by promoting pro-inflammatory macrophage signaling. These processes collectively impair heart function. (Lower panel) Intravenously injected RC NPs are taken up by neutrophils migrating to the ischemic heart. At the infarct area, H2O2 produced by activated neutrophils is converted to oxygen by catalase in RC NPs. The buildup of oxygen gas in RC NPs causes the nanoparticles to explode and rapidly release roscovitine, inducing timely neutrophil apoptosis. This inhibits neutrophil-mediated inflammation and promotes Mϕ polarization to the reparatory phenotype, ultimately protecting the heart from MI damage. Created in BioRender. Kim, B. (2024) BioRender.com/c60t349.
Fig. 2
Fig. 2. Characterization of RC NPs.
a Hydrodynamic diameter and zeta potential of RC NPs determined by dynamic and electrophoretic light scattering respectively (n = 7). b Scanning electron microscopy (SEM, left) and transmission electron microscopy (TEM, right) images of RC NPs. Scale bars, 1 µm (SEM) and 200 nm (TEM). c RC NP size stability in PBS and 50% serum at 37 °C (n = 3 biological replicates; n.s., not significant). d Remaining amount (Amplex Red intensity) of H2O2 after reaction with nanoparticles at various H2O2 concentrations (n = 3 biological replicates). e Oxygen production by RC NPs under H2O2 conditions (n = 3 biological replicates). f Accelerated roscovitine release from RC NPs under H2O2 conditions (n = 3 biological replicates). g Time-dependent deformation (arrows) of RC NPs upon addition of H2O2 determined by SEM. Scale bars, 1 µm. h RC NP uptake by neutrophils visualized by confocal microscopy. Scale bar, 20 µm. WGA stains for cell membrane. Dotted lines show edge of cell membrane. i Effect of RC NPs on neutrophil migration along chemokine (fMLP, 1 µM) gradient (n = 3 biological replicates; n.s., not significant). j SYTOX Green intensity of neutrophils following treatment with various agents (n = 3 biological replicates). PMA (100 nM) served as a positive control. k Neutrophil viability following treatment with various agents (n = 4 biological replicates). Free roscovitine (R; 20 µM) served as a positive control. All data presented as mean ± standard deviation (SD). One-way ANOVA was used for the comparison in i. Two-way ANOVA was used for the comparisons in c, j, k. Experiments in b, g, h were each performed thrice independently, yielding similar results each time. Schematic in i created in BioRender. Kim, B. (2024) BioRender.com/c05i014.
Fig. 3
Fig. 3. RC NP-mediated modulation of neutrophil fate in vitro.
a Diagram illustrating RC NP modulation of activated neutrophils. b RC NP (50 µM) treatment induces apoptosis (arrows) of PMA (750 nM)-activated neutrophils as determined by the TUNEL assay (biological replicates n = 8 for PBS, 9 for R NP, C NP, and Free R, and 10 for Free RC and RC NP). Scale bars, 50 µm. c RC NP intervention reduces the amount of NETs (arrows) extruded from PMA-activated neutrophils as determined by SYTOX Green staining (biological replicates n = 8 for Free R, 9 for PBS, Free RC, and RC NP, 10 for C NP, and 11 for R NP). Scale bars, 50 µm. RC NP-induced apoptosis of activated neutrophils decreases secretion of d TNF-α (n = 4 biological replicates), e pro-MMP-9 (biological replicates n = 4 for all PMA-activated groups, 5 for PBS), and f elastase as determined by enzyme-linked immunosorbent assays (ELISAs) (biological replicates n = 4 for all PMA-activated groups, 5 for PBS). *p < 0.05 versus PBS (PMA-activated); p < 0.05 vs R NP; §p < 0.05 vs C NP; p < 0.05 versus RC NP; #p < 0.05 vs Free R; p < 0.05 vs Free RC. All data presented as mean ± SD. One-way ANOVA was used for all comparisons. Figure a created in BioRender. Kim, B. (2024) BioRender.com/h86n476.
Fig. 4
Fig. 4. Macrophage efferocytosis and polarization by RC NP+ apoptotic neutrophils.
RC NP treatment of PMA-activated neutrophils enhances their efferocytosis (arrows) by LPS (1 ng/ml)-treated Mϕs as verified by a flow cytometry (20 min after coculture) and b confocal microscopy (40 min after coculture) (biological replicates n = 3 for PBS, R NP, and Free R, and 4 for C NP, Free RC, and RC NP). Scale bars, 100 µm. Relative efferocytosis was calculated by analyzing the percentage of F4/80+ macrophages positive for DiD due to efferocytosis of DiD-labeled neutrophils and normalized to the PBS group. Flow cytometric analysis of c CD80 and d CD86 expression by F4/80+ Mϕs (n = 5 biological replicates). e Relative mRNA expression of Nos2 as determined by PCR (n = 6 biological replicates). f Representative immunofluorescence images and quantitative analysis of iNOS expression (biological replicates n = 5 for PBS, R NP, C NP, and Free R, 6 for Free RC, and 7 for RC NP). Scale bars, 50 µm. Secretion of g TNF-α, h IL-12 p40, and i IL-6 as determined by ELISA (n = 4 biological replicates). j Relative mRNA expression of Mertk as determined by PCR (biological replicates n = 6 for R NP, 7 for all other groups). k Secretion of TGF-β1 as determined by ELISA (biological replicates n = 3 for R NP, 4 for all other groups). l Representative immunofluorescence images and quantitative analysis of CD206 expression (biological replicates n = 4 for Free RC, 5 for PBS and Free R, and 6 for all other groups). Scale bars, 50 µm. *p < 0.05 vs PBS; p < 0.05 vs R NP; §p < 0.05 vs C NP; p < 0.05 vs RC NP. All data presented as mean ± SD. One-way ANOVA was used for all comparisons.
Fig. 5
Fig. 5. Biodistribution of RC NPs.
a RC NP uptake by circulating monocytes and neutrophils at various time points after intravenous injection in uninjured mice as assessed by flow cytometry (n = 5 mice for 72 h, n = 6 mice for 30 min and 24 h, and 7 mice for 10 min). b Percentage of RC NP+CD45+ monocytes and neutrophils among all circulating RC NP+CD45+ cells 30 min after intravenous injection in both uninjured mice and MI rats as determined by flow cytometry (n = 3 MI rats and 6 normal mice). c Pharmacokinetics of DiR-labeled RC NPs in the bloodstream following intravenous injection in uninjured rats (n = 3). d Ex vivo images and average radiance of sham and MI hearts 24 h after intravenous injection of DiD-labeled RC NPs (n = 3). e Average radiance of DiD-labeled RC NPs in major organs of sham and MI rats (n = 3; n.s., not significant). f Flow cytometric analysis to determine the various cell types responsible for RC NP uptake in sham and MI hearts 24 h after intravenous injection of DiD-labeled RC NPs (n = 4 for sham, 5 for MI). All data presented as mean ± SD. Two-way ANOVA was used for the comparisons in a (Sidak when comparing between cells, Tukey when comparing between time points). Multiple unpaired two-sample t tests were used for the comparisons in f. Unpaired two-sided t tests were used for comparisons in be.
Fig. 6
Fig. 6. RC NP-mediated modulation of immune cell dynamics post-MI.
a Representative IHC images and quantitative analysis of apoptotic (TUNEL+, green) neutrophils (MPO+, pink) in infarcted rat hearts 1 day post-MI (n = 3 for sham, 6 for other groups). Scale bars, 25 µm. b Representative IHC images and quantitative analysis of neutrophils (MPO+, red) that have undergone NETosis (CitH3+, green) in infarcted rat hearts 3 days post-MI (n = 3 for sham, 6 for other groups). Scale bars, 25 µm. c Representative IHC images and quantitative analysis of iNOS+ (green) macrophages (CD68+, red) in infarcted hearts 3 days post-MI (n = 3 for sham, 6 for other groups). Scale bars, 25 µm. d Representative IHC images and quantitative analysis of CD206+ (green) macrophages (CD68+, red) in infarcted hearts 3 days post-MI (n = 3 for sham, 6 for other groups). Scale bars, 25 µm. e CD86 and CD80 expression in macrophages (CD68+ cells) 3 and 5 days after MI as determined by flow cytometry (biological replicates n = 4 for D3/D5 sham, D3 R NP, D3 Free R, D5 C NP, and D5 RC NP, 5 for D3 PBS, D3 C NP, D3 RC NP, D5 R NP, and D5 Free R, and 6 for D5 PBS). f Serum levels of NET-associated chemoattractant protein S100A9 1 and 3 days post-MI as determined by ELISA (n = 3 biological replicates). g Serum levels of neutrophil granule-derived LL-37 1 day post-MI as determined by ELISA (n = 3 biological replicates). *p < 0.05 vs PBS; §p < 0.05 vs C NP; p < 0.05 vs R NP; #p < 0.05 vs Free R; p < 0.05 vs RC NP; p < 0.05 vs Sham. All data presented as mean ± SD. One-way ANOVA was used for all comparisons.
Fig. 7
Fig. 7. RC NPs mitigate adverse remodeling post-MI.
a Experimental timeline for in vivo histological analysis of RC NP efficacy. b Representative Masson’s trichrome-stained histological images of infarcted hearts (purple, scar tissue; red, viable myocardium) and quantification of fibrosis and myocardium 4 weeks after MI (n = 3 for sham, 6 for other groups). c Representative IHC images and quantitative analysis of cardiomyocytes (cTnT+, red) and apoptotic cardiomyocytes (TUNEL+cTnT+) at the infarct zone 3 days post-MI (n = 3 for sham, 6 for other groups). Scale bars, 25 µm. d Representative IHC images and quantitative analysis of endothelial cells (CD31+, red) and apoptotic endothelial cells (TUNEL+CD31+) at the infarct zone 3 days post-MI (n = 3 for sham, 6 for other groups). Scale bars, 25 µm. e Representative IHC images and quantitative analysis of cardiomyocytes (cTnT, red) at the border and infarct zones 4 weeks post-MI (n = 3 for sham, 6 for other groups). Scale bars, 100 µm. f Representative IHC images and quantitative analysis of capillary density (CD31, green) at the border and infarct zones 4 weeks post-MI (n = 3 for sham, 6 for other groups). Scale bars, 100 µm. *p < 0.05 vs PBS; §p < 0.05 vs C NP; p < 0.05 vs R NP; #p < 0.05 vs Free R; p < 0.05 vs RC NP. All data presented as mean ± SD. One-way ANOVA was used for all comparisons.
Fig. 8
Fig. 8. RC NP-mediated preservation of heart function post-MI.
a Experimental timeline for in vivo analysis of RC NP efficacy. b Representative M-mode images at various time points post-MI. c Left ventricular ejection fraction, (d) fractional shortening, (e) LVIDd, (f) LVIDs, and (g) AWT of MI rats at indicated time points n = 3 for sham, 7 for PBS, Free R, and RC NP, 8 for C NP, and 9 for R NP. h Representative hemodynamic pressure and volume (PV) curves 4 weeks post-MI. i Cardiac output, (j) stroke volume, (k) ESPVR, (l) EDPVR, (m) maximal rate of pressure change during systole (dP/dtmax), (n) minimal rate of pressure change during diastole (dP/dtmin), and (o) maximum volume (Vmax) 4 weeks after MI. n = 3 for sham, 7 for PBS, Free R, and RC NP, 8 for C NP, and 9 for R NP. *p < 0.05 vs PBS; §p < 0.05 vs C NP; p < 0.05 vs R NP; #p < 0.05 vs Free R; p < 0.05 vs RC NP. All data presented as mean ± SD. Two-way ANOVA was used for comparisons in cg. One-way ANOVA was used for comparisons in io.
Fig. 9
Fig. 9. Reduced efficacy of RC NPs upon polymorphonucleocyte depletion.
a Experimental timeline for neutrophil depletion and analysis of therapeutic efficacy. b Representative M-mode images at various time points post-MI. c Left ventricular ejection fraction, (d) fractional shortening, (e) LVIDs, and (f) LVIDd of rats at indicated time points (n = 3 for sham, 5 for other groups). *p < 0.05 vs PBS; §p < 0.05 vs anti-PMN + RC NP. All data presented as mean ± SD. Two-way ANOVA was used for all comparisons.
Fig. 10
Fig. 10. Toxicity evaluation of RC NPs.
a Percentage of circulating neutrophils in sham and MI rats shows no evidence of RC NP-induced neutropenia (n = 4 for all MI groups, 5 for sham). b Number of cardiac neutrophils per 105 myocardial cells in sham and MI rats (with or without RC NP intervention) 1 and 3 days post-MI determined using flow cytometry (n = 4 for sham, MI + PBS D1/D3, and 5 for MI + RC NP D1/D3). c Percentage of cells in G0/G1, S, and G2/M phases in the livers and spleens of uninjured rats 1 and 2 weeks after RC NP injection (n = 3 for liver/spleen at 2 weeks, and 4 liver/spleen at 1 week). d Relative mRNA expression of apoptosis regulatory proteins Bax, Bcl2, and Bclxl in the livers and spleens of uninjured rats 1 and 2 weeks after RC NP injection (n = 3 for liver/spleen at 2 weeks, and 4 liver/spleen at 1 week). n.s., not significant. e Representative H&E-stained histological sections of major organs 14 days after RC NP injection in healthy F344 rats (n = 3). Scale bars, 100 µm. All data presented as mean ± SD. One-way ANOVA was used for comparisons in a and b. Multiple unpaired two-sample t tests were used for the comparison in c. Unpaired two-sided t tests were used for the comparisons in d.

References

    1. Reed, G. W., Rossi, J. E. & Cannon, C. P. Acute myocardial infarction. Lancet389, 197–210 (2017). - PubMed
    1. Anderson, J. L. & Morrow, D. A. Acute myocardial infarction. N. Engl. J. Med.376, 2053–2064 (2017). - PubMed
    1. Vafadarnejad, E. et al. Dynamics of cardiac neutrophil diversity in murine myocardial infarction. Circ. Res.127, e232–e249 (2020). - PubMed
    1. Puhl, S.-L. & Steffens, S. Neutrophils in post-myocardial infarction inflammation: damage vs. resolution? Front. Cardiovasc. Med.6, 25 (2019). - PMC - PubMed
    1. Soehnlein, O., Steffens, S., Hidalgo, A. & Weber, C. Neutrophils as protagonists and targets in chronic inflammation. Nat. Rev. Immunol.17, 248–261 (2017). - PubMed

Publication types

MeSH terms

LinkOut - more resources