. 2024 Oct 1;14(1):22811.
doi: 10.1038/s41598-024-71173-0.

Reproducibility of spatial penalty-based methodologies for intravoxel incoherent motion analysis with diffusion MRI

Affiliations

Reproducibility of spatial penalty-based methodologies for intravoxel incoherent motion analysis with diffusion MRI

Esha Baidya Kayal et al. Sci Rep. .

Abstract

Objective was to assess the precision and reproducibility of spatial penalty-based intravoxel incoherent motion (IVIM) methods in comparison to the conventional bi-exponential (BE) model-based IVIM methods. IVIM-MRI (11 b-values; 0-800 s/mm2) of forty patients (N = 40; Age = 17.7 ± 5.9 years; Male:Female = 30:10) with biopsy-proven osteosarcoma were acquired on a 1.5 Tesla scanner at 3 time-points: (i) baseline, (ii) after 1-cycle and (iii) after 3-cycles of neoadjuvant chemotherapy. Diffusion coefficient (D), Perfusion coefficient (D*) and Perfusion fraction (f) were estimated at three time-points in whole tumor and healthy muscle tissue using five methodologies (1) BE with three-parameter-fitting (BE), (2) Segmented-BE with two-parameter-fitting (BESeg-2), (3) Segmented-BE with one-parameter-fitting (BESeg-1), (4) BE with adaptive Total-Variation-penalty (BE + TV) and (5) BE with adaptive Huber-penalty (BE + HPF). Within-subject coefficient-of-variation (wCV) and between-subject coefficient-of-variation (bCV) of IVIM parameters were measured in healthy and tumor tissue. For precision and reproducibility, intra-scan comparison of wCV and bCV among five IVIM methods were performed using Friedman test followed by Wilcoxon-signed-ranks (WSR) post-hoc test. Experimental results demonstrated that BE + TV and BE + HPF showed significantly (p < 10-3) lower wCV and bCV for D (wCV: 24-32%; bCV: 22-31%) than BE method (wCV: 38-49%; bCV: 36-46%) across three time-points in healthy muscle and tumor. BE + TV and BE + HPF also demonstrated significantly (p < 10-3) lower wCV and bCV for estimating D* (wCV: 89-108%; bCV: 83-102%) and f (wCV: 55-60%; bCV: 56-60%) than BE, BESeg-2 and BESeg-1 methods (D*-wCV: 102-122%; D*-bCV: 98-114% and f-wCV: 96-130%; f-bCV: 94-125%) in both tumor and healthy tissue across three time-points. Spatial penalty based IVIM analysis methods BE + TV and BE + HPF demonstrated lower variability and improved precision and reproducibility in the current clinical settings.

Keywords: Intravoxel incoherent motion; Precision; Quantitative comparison; Reproducibility; Spatial penalty based IVIM method.


Conflict of interest statement

The authors declare no competing interests.

Figures
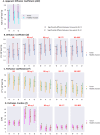
Fig. 1
Fig. 1
Point plots for average (A) Apparent diffusion coefficient (ADC) evaluated by mono-exponential (ME) method and IVIM parameters (B) Diffusion coefficient (D), (C) perfusion coefficient (D*) and (D) perfusion fraction (f) in patient cohort evaluated by five IVIM analysis methods (1) Bi-exponential (BE) method with three-parameter fitting (BE), (2) segmented BE with two-parameter fitting (BESeg-2), (3) Segmented BE with one-parameter fitting (BESeg-1), (4) BE with adaptive Total-Variation penalty (BE + TV) and (5) BE with adaptive Huber penalty (BE + HPF) at three time-points (t0, t1 and t2) in tumor and healthy tissue volume.
Fig. 2
Fig. 2
(a) DWI (b = 800 s/mm2); (b) DWI with ROIs for tumor (red overlay) and healthy tissue (blue overlay); (c) apparent diffusion coefficient (ADC), of a representative patient (Male, 15 years) with osteosarcoma in right femur at time-points t0. IVIM parametric maps estimated by five IVIM analysis methodologies (1) Bi-exponential (BE) method with three-parameter fitting (BE), (2) Segmented BE with two-parameter fitting (BESeg-2), (3) Segmented BE with one-parameter fitting (BESeg-1), (4) BE with adaptive Total-Variation penalty (BE + TV) and (5) BE with adaptive Huber penalty (BE + HPF) at time-points t0 are depicted in (d–h) Diffusion coefficient (D), (i–m) Perfusion coefficient (D*) and (n–r) Perfusion fraction (f) respectively. Red, yellow and white arrows indicate the tumor regions in D, D* and f maps respectively.
Fig. 3
Fig. 3
Data fitting curves in tumor and healthy tissue ROIs (same DWI MRI slice as in Fig. 2. by five IVIM analysis methods (1) Bi-exponential (BE) method with three-parameter fitting (BE), (2) segmented BE with two-parameter fitting (BESeg-2), (3) segmented BE with one-parameter fitting (BESeg-1), (4) BE with adaptive Total-Variation penalty (BE + TV) and (5) BE with adaptive Huber penalty (BE + HPF) for a representative patient (Male, 15 years) with osteosarcoma in right femur at three time-points—A: Baseline (t0); B: 1st Follow-up (t1); and C: 2nd Follow-up (t2). For A and C: (i) T2W fat-saturated MRI; (ii) DWI (b = 800 s/mm2) with ROIs for tumor (red outline) and healthy tissue (blue outline); (iii) Data fitting in tumor and (iv) Data fitting in healthy tissue by five IVIM analysis methods. For B: (i) DWI (b = 800 s/mm2) with ROIs for tumor (red outline) and healthy tissue (blue outline); (ii) Data fitting in tumor and (iii) Data fitting in healthy tissue by five IVIM analysis methods. In all the plots, along X-axis: b-values (0–800 s/mm2) and along Y-axis: relative signal intensity. Fitting curves in the range, b-value = 0–100 s/mm2 are enlarged in the inset.
Fig. 4
Fig. 4
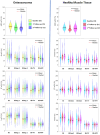
Violin plots of within-subject coefficient of variation (wCV) values for apparent diffusion coefficient (ADC) and IVIM parameters diffusion coefficient (D), perfusion coefficient (D*) and perfusion fraction (f) in patient cohort evaluated by mono-exponential (ME) method and five IVIM analysis methods (1) Bi-exponential (BE) method with three-parameter fitting (BE), (2) Segmented BE with two-parameter fitting (BESeg-2), (3) Segmented BE with one-parameter fitting (BESeg-1), (4) BE with adaptive Total-Variation penalty (BE + TV) and (5) BE with adaptive Huber penalty (BE + HPF) at three time-points in tumor and healthy muscle tissue volume.
Fig. 5
Fig. 5
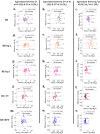
Bland–Altman plots showing inter-scan agreement of Diffusion coefficient (D) (1st column), Perfusion coefficient (D*) (2nd column), and Perfusion fraction (f) (3rd column) between time-points t0 and t1 estimated by five IVIM analysis methods (1) Bi-exponential (BE) method with three-parameter fitting (BE) (a–c respectively), (2) Segmented BE with two-parameter fitting (BESeg-2) (d–f respectively), (3) Segmented BE with one-parameter fitting (BESeg-1) (g–i respectively), (4) BE with adaptive Total-Variation penalty (BE + TV) (k–l respectively) and (5) BE with adaptive Huber penalty (BE + HPF) (m–o respectively) in healthy tissue volume.

Similar articles

References

    1. Koh, D., Dm, K. & Dj, C. Diffusion-weighted MRI in the body: Applications and challenges in oncology. Am. J. Roentgenol.188, 1622–1635 (2007). - PubMed
    1. Le Bihan, D. et al. Separation of diffusion and perfusion in intravoxel incoherent motion MR imaging. Radiology168, 497–505 (1988). - PubMed
    1. Le Bihan, D. What can we see with IVIM MRI? Neuroimage15, 56–67 (2019). - PubMed
    1. Iima, M. & Bihan, D. L. Clinical intravoxel incoherent motion and diffusion MR imaging: Past, present, and future. Radiology278, 13–32 (2016). - PubMed
    1. Koh, D., Collins, D. J. & Orton, M. R. Intravoxel incoherent motion in body diffusion-weighted MRI: Reality and challenges. Am. J. Roentgenol.196, 1351–1361 (2011). - PubMed

LinkOut - more resources