. 2024 Oct 1;7(1):1229.
doi: 10.1038/s42003-024-06888-x.

Maintaining mitochondrial DNA copy number mitigates ROS-induced oocyte decline and female reproductive aging

Affiliations

Maintaining mitochondrial DNA copy number mitigates ROS-induced oocyte decline and female reproductive aging

Shiyun Long et al. Commun Biol. .

Abstract

Oocytes play a crucial role in transmitting maternal mitochondrial DNA (mtDNA), essential for the continuation of species. However, the effects of mitochondrial reactive oxygen species (ROS) on mammalian oocyte maturation and mtDNA maintenance remain unclear. We investigated this by conditionally knocking out the Sod2 gene in primordial follicles, elevating mitochondrial matrix ROS levels from early oocyte stages. Our data indicates that reproductive aging in Sod2 conditional knockout females begins at 6 months, with oxidative stress impairing oocyte quality, particularly affecting OXPHOS complex II and mtDNA-encoded mRNA levels. Despite unchanged mtDNA mutation load, mtDNA copy numbers exhibited significant variations. Strikingly, reducing mtDNA copy numbers by reducing mtSSB protein, crucial for mtDNA replication, accelerated reproductive aging onset to three months, underscoring the critical role of mtDNA copy number maintenance under oxidative stress conditions. This research provides new insights into the relationship among mitochondrial ROS, mtDNA, and reproductive aging, offering potential strategies for delaying aging-related fertility decline.


Conflict of interest statement

The authors declare no competing interests.

Figures
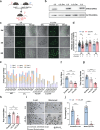
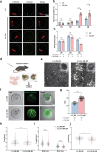
Fig. 1
Fig. 1. Sod2-conditional knockout in oocytes resulted in female reproductive aging phenotype.
a Mouse breeding strategy to generate oocyte-specific Sod2-deficient mice. Sod2L/L (L/L) male transgenic mice that expressed Cre recombinase under the control of the Gdf9 promoter were intercrossed with Sod2L/L female mice to generate Sod2L/L, Gdf9-Cre (L/L, Cre) female mice. Created with BioRender.com. b Western blot detection of SOD2 expression in the MII oocytes of 3-week-old L/L, Cre and L/L female mice. Each lane contains 50 MII oocytes. ACTIN was used as a loading control. The experiments were repeated 3 times, and a representative image is shown. c Representative image of HKSOX-2m staining (green) of MII oocytes from L/L and L/L, Cre mice at different ages. Scale bar: 50 µm. d Quantification of HKSOX-2m signals of MII oocytes from L/L and L/L, Cre mice at different ages. Data were mean ± SEM and were analyzed using unpaired two-tailed Student’s t-test, **p < 0.01, ***p < 0.001. e Total pup number of each female during the 6-month fertility test, wild-type (WT); L/L; +/L, Cre and L/L, Cre female mice, with each column representing all pups from one female mouse. f Number of total litters. The control group consists of mice from both the WT and L/L groups. Data were mean ± SEM and were analyzed using one-way ANOVA with Tukey’s multiple comparison test, ****p < 0.0001. g Total pup number from each group. The control group consists of mice from both the WT and L/L groups. Data were mean ± SEM and were analyzed using one-way ANOVA with Tukey’s multiple comparison test, *p <  0.05, ****p < 0.0001. h Average litter sizes from each group. The control group consists of mice from both the WT and L/L groups. Data were mean ± SEM and were analyzed using one-way ANOVA with Tukey’s multiple comparison test, *p < 0.05, **p < 0.01. i The representative morphology of two-cell stage embryos and blastocysts after in vitro fertilization. MII oocytes were obtained from 20 to 22-week-old L/L, Cre and L/L mice. After fertilization, the in vitro cultures were performed under 5% O2 (5% O2/5% CO2/90% N2). The sperm were obtained from 12 to 14-week-old wild-type C57BL/6 male mice. Scale bar: 100 μm. j The fertilization rate and blastocyst rate of L/L, Cre and L/L mice oocytes after in vitro fertilization. Data were mean ± SEM and were analyzed using unpaired two-tailed Student’s t-test, ****p < 0.0001.
Fig. 2
Fig. 2. Impact of Sod2 conditional knockout on oocyte quality during maternal aging.
a Representative image of spindle morphology (red: tubulin; blue: chromosomes) in oocytes. Circles delineate oocyte boundaries. Up panel: normal homologous chromosome alignment on metaphase II spindles in L/L oocytes. Low: spindle abnormalities in L/L, Cre oocytes. b Proportion of oocytes with abnormal spindles from (a). Data from 3-5 independent experiments, 3-4 mice per group. Data were mean ± SEM and were analyzed using unpaired two-tailed Student’s t-test, *p < 0.05, ***p < 0.001. c ATP levels in individual oocytes from L/L and L/L, Cre mice across various ages. Data were mean ± SEM and were analyzed using unpaired two-tailed Student’s t-test, *p < 0.05. d Schematic diagram of preparation procedure for MII oocyte TEM from superovulated 6-month-old L/L and L/L, Cre mice. Created with BioRender.com. e TEM images of MII oocytes from 6-month-old L/L (left) and L/L, Cre (right) mice. Mitochondria (white arrows); lipid droplets (LD, yellow dashed lines). f Representative image of BODIPY staining (green) of MII oocytes from 6-month-old L/L and L/L, Cre female mice. g Quantification of BODIPY signals from (f). M.F.I: mean fluorescence intensity. Data were mean ± SEM and were analyzed using unpaired two-tailed Student’s t-test, ****p < 0.0001. h Mitochondrial area analysis of MII oocytes from (e). Violin plots show median and quartiles (dashed black line). L/L: 238 mitochondria, L/L, Cre: 161 mitochondria. Kruskal-Wallis test: **p < 0.01. i Mitochondrial longer diameter (major axis) and shorter diameter (minor axis) of MII oocytes from (e). Violin plots indicate median and quartiles (dashed black line). L/L: 238 mitochondria, L/L, Cre: 161 mitochondria. Kruskal-Wallis test: ***p < 0.001, ****p < 0.0001. j Mitochondrial circularity in MII oocytes from (e), indicating shape uniformity. A circularity value closer to 1 indicates a higher proportion of mitochondria with a circular shape. Violin plots display median and quartiles (dashed black line). L/L: 238 mitochondria, L/L, Cre: 161 mitochondria. Kruskal-Wallis test: *p < 0.05.
Fig. 3
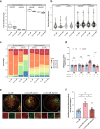
Fig. 3. Altered gene expression profile in Sod2-deficient oocytes.
a The Venn diagrams illustrating the numbers of transcripts that are up or down-regulated in MII oocytes of 6-month-old L/L, Cre female mice. b Volcano plot showing differentially expressed genes (DEGs; downregulated, green; upregulated, red) in L/L, Cre oocytes compared with L/L from 6-month-old mice oocytes, with significant DEGs highlighted. c Heatmap illustrating the manual-sorted pathways derived from DEGs. d Gene Ontology (GO) enrichment analysis of downregulated DEGs in L/L, Cre oocytes relative to L/L oocytes from 6-month-old mice. e Gene Ontology (GO) enrichment analysis of upregulated DEGs in L/L, Cre oocytes relative to L/L oocytes from 6-month-old mice.
Fig. 4
Fig. 4. Impacts of Sod2 conditional knockout on oocyte mitochondrial activity and function.
a Representative image of TMRM staining of mature (MII) oocytes from control (L/L) and Sod2 knockout (L/L, Cre) mice, displaying mitochondrial membrane potential across different ages. b Quantification of TMRM signals from (a). Data were mean ± SEM and were analyzed using unpaired two-tailed Student’s t-test, ***p < 0.001, ****p < 0.0001. c Representative image of western blots for SDHB protein in oocytes from L/L and L/L, Cre mice at various ages, with ACTIN as a loading control. N = 50 MII oocytes per lane, with 3-4 independent experiments. d Densitometric analysis of SDHB levels normalized to ACTIN from (c). Data were mean ± SEM and were analyzed using two-tailed unpaired t-test with Welch’ s correction, *p < 0.05, **p < 0.01. e Representative image of complex II activity in ovarian sections from 3-month-old L/L and L/L, Cre mice, with oocyte boundaries marked. f TEM images of early oocytes in primordial follicles from 2-week-old (upper panel) and 6-month-old (lower panel) L/L and L/L, Cre mice. g Mitochondrial area quantification of (f), presented in violin plots with median and quartiles (dashed black line). Mitochondria counts: L/L_2W = 153, L/L, Cre_2W = 177, L/L_6M = 64, L/L, Cre_6M = 94. Kruskal-Wallis test: *p < 0.05, ***p < 0.001. h Mitochondrial circularity calculation of (f), with values closer to 1 indicating greater circularity. Data presented in violin plots with median and quartiles (dashed black line). Mitochondria counts as in (g). Statistical analysis by Kruskal-Wallis test. i Major axis (longer diameter) measurements of (f), presented as violin plots with medians and quartiles (dashed black line). Mitochondria counts as in (g). Kruskal-Wallis test: ****p < 0.0001. j Minor axis (shorter diameter) measurements of (f), resented as violin plots with medians and quartiles (dashed black line). Mitochondria counts as in (g). Kruskal-Wallis test: *p < 0.05, ***p < 0.001, ****p < 0.0001.
Fig. 5
Fig. 5. Impact of mitochondrial ROS on mtDNA copy number and mutation frequency.
a Mutation load, including de novo and shared variations, per oocyte in L/L and L/L, Cre mice at 3 weeks and 9 months of age. b Variant allele frequencies of de novo mutations and shared variations in L/L and L/L, Cre oocytes from mice aged 3 weeks and 9 months. c Mutation spectra comparison for de novo mutations and shared variations in L/L and L/L, Cre oocytes across the two age groups. d mtDNA copy number quantification in single MII oocytes from L/L and L/L, Cre mice at different ages; data were mean ± SEM, analyzed by unpaired two-tailed Student’s t-test (*p < 0.05, ****p < 0.0001). e Representative fluorescence images of oocytes from 6-month-old L/L and L/L, Cre mice, labeled with anti-dsDNA (green) and anti-TOMM20 (red) antibodies. f mtDNA copy number semi-quantification with the ratio of yellow to red fluorescence intensity in L/L normal (n = 9), L/L, Cre_normal (n = 5), and L/L, Cre_aberrant (n = 9) oocytes from (e). Data were mean ± SEM and were analyzed using one-way ANOVA with Tukey’s multiple comparison test, **p < 0.01, ***p < 0.001.
Fig. 6
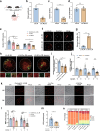
Fig. 6. Diminished mitochondrial function and oocyte quality in Sod2-deficient oocytes exacerbated by mtSSB heterozygous knockout.
a Generation strategy for oocyte-specific Sod2 knockout and mtSSB heterozygous mice, using Gdf9-Cre-driven recombination in Sod2L/L males (L/L, Cre) crossed with Sod2L/L; mtSSBL/L females to generate Sod2L/L, mtSSB+/L; Gdf9-Cre (L/L, M; Cre) female mice. Created with BioRender.com. b Total pup number of each female during the 6-month fertility test, data were mean ± SEM and were analyzed using unpaired two-tailed Student’s t-test, **p < 0.01. c Number of total litters. Data were mean ± SEM and were analyzed using unpaired two-tailed Student’s t-test, ***p < 0.001. d Average litter sizes from each group. Data were mean ± SEM and were analyzed using unpaired two-tailed Student’s t-test. e Statistical analysis of superovulated oocyte number in females aged 3 weeks and 3 months. Data were mean ± SEM and were analyzed using one-way ANOVA with Tukey’s multiple comparison test, *p < 0.05, **p < 0.01, ****p < 0.0001. Sample sizes: control (n = 16, for the age of 3w and 3 m), L/L, Cre (n = 13 for 3w; n = 16 for 3 m), L/L, M; Cre (n = 11 for 3w; n = 16 for 3 m). f Representative image of the spindle morphology (red, tubulin; blue, chromosome), including oocytes with normal spindle (L/L) and oocytes with aberrant spindles (L/L, M; Cre). g Proportion of oocytes with aberrant spindle from (f), across three independent experiments, 3-4 mice per group. Data were mean ± SEM and were analyzed using unpaired two-tailed Student’s t-test, **p < 0.01. h Representative immunofluorescence images of MII oocytes from 3-month-old mice, stained for dsDNA (green) and TOMM20 (red). i mtDNA copy number semi-quantification with the ratio of yellow to red fluorescence intensity in L/L, M (n = 4), L/L, M; Cre_normal (n = 5), and L/L, M; Cre_aberrant (n = 6) oocytes from (j). Data were mean ± SEM and were analyzed using one-way ANOVA with Tukey’s multiple comparison test, *p < 0.05. j Quantitative PCR analysis of single oocyte mtDNA copy number from females of different ages. Data were mean ± SEM and were analyzed using unpaired two-tailed Student’s t-test, **p <  0.01, ****p < 0.0001. k Representative image of TMRM staining (red) of MII oocytes from control; L/L, Cre and L/L, M; Cre mice at 3-week-old and 3-month-old. l Quantification of TMRM signals in (k). Data were mean ± SEM and were analyzed using one-way ANOVA with Tukey’s multiple comparison test, **p < 0.01, ****p < 0.0001. m ATP level of single oocytes from L/L, M and L/L, M; Cre mice at 3-month-old. Data were mean ± SEM and were analyzed using unpaired two-tailed Student’s t-test, *p < 0.05. n Mutation spectrum of de novo mutations and shared variations in control (L/L; L/L, M) and L/L, M; Cre 3-week-old and 6-month-old mice, respectively.
Fig. 7
Fig. 7. Efficacy of NMN in mitigating mitochondrial dysfunction in Sod2-deficient oocytes with decreased mtDNA copy number.
a Schematic representation of NMN or PBS administration and hormone-induced superovulation in 3-month-old L/L, M and L/L, M; Cre female mice. Created with BioRender.com. b Body weight monitoring in mice subjected to NMN or PBS treatment (n = 3 per group). c Oocyte number after ovulation of mice with NMN or PBS treatment, n = 3 for each group. d Representative image of TMRM staining (red) of MII oocytes from PBS- and NMN-treated mice. e Quantification of TMRM signals in MII oocytes from (d). Data were mean ± SEM and were analyzed using one-way ANOVA with Tukey’s multiple comparison test, *p < 0.05, ****p < 0.0001. f ATP levels in single oocytes of PBS- and NMN-treated female mice. Data were mean ± SEM and were analyzed using one-way ANOVA with Tukey’s multiple comparison test, *p < 0.05. g Representative images of spindle morphology and chromosome alignment in MII oocytes from PBS- and NMN-treated mice. Red, tubulin; blue, chromosome. h Quantitative analysis of the percentage of oocytes with aberrant spindles from (g). Each group consisted of oocytes obtained from 3 mice, and Fisher’s exact test was used to analyze the statistical differences between L/L, M and L/L, M; Cre treated with PBS or MNM, respectively.

Similar articles

Cited by

References

    1. Wai, T., Teoli, D. & Shoubridge, E. A. The mitochondrial DNA genetic bottleneck results from replication of a subpopulation of genomes. Nat. Genet40, 1484–1488 (2008). - PubMed
    1. Cree, L. M. et al. A reduction of mitochondrial DNA molecules during embryogenesis explains the rapid segregation of genotypes. Nat. Genet40, 249–254 (2008). - PubMed
    1. Wai, T. et al. The Role of Mitochondrial DNA Copy Number in Mammalian Fertility. Biol. Reprod.83, 52–62 (2010). - PMC - PubMed
    1. Larsson, N.-G. et al. Mitochondrial transcription factor A is necessary for mtDNA maintance and embryogenesis in mice. Nat. Genet18, 231–236 (1998). - PubMed
    1. Broekmans, F. J., Soules, M. R. & Fauser, B. C. Ovarian Aging: Mechanisms and Clinical Consequences. Endocr. Rev.30, 465–493 (2009). - PubMed