. 2024 Oct 1;14(1):22778.
doi: 10.1038/s41598-024-74041-z.

Ladinin-1 in actin arcs of oral squamous cell carcinoma is involved in cell migration and epithelial phenotype

Affiliations

Ladinin-1 in actin arcs of oral squamous cell carcinoma is involved in cell migration and epithelial phenotype

Tatsuya Abé et al. Sci Rep. .

Abstract

Histopathologically, oral squamous cell carcinoma (OSCC) consists of well-defined interfaces with adjacent non-cancerous epithelium. Previously, we found that SCC tissues expressed higher levels of specific proteins at this interface. Ladinin-1 (LAD1) is one of the specific molecules that has increased expressions in cancer fronts; however, its function in OSCC is unknown. Therefore, this study aimed to elucidate the function of LAD1 in human OSCC cells. LAD1 was localized on the actin arc at the distal periphery of cell clusters in the OSCC cell lines HSC-2, HSC-3, and HSC-4. When LAD1 was knocked down, cellular migration was repressed in wound scratch assays but was reversed in three-dimensional collagen gel invasion assays. Characteristic LAD1 localization along actin arcs forming the leading edge of migrating cells was diminished with loss of filopodia formation and ruffling in knockdown cells, in which the expression levels of cell motility-related genes-p21-activated kinase 1 (PAK1) and caveolin-1 (CAV1)-were upregulated and downregulated, respectively. LAD1 expression was also associated with the downregulation of vimentin and increased histological differentiation of OSCC. These results suggest that LAD1 is involved in actin dynamics during filopodia and lamellipodia formation, and in maintaining the epithelial phenotype of OSCC cells.

Keywords: Actin arc; Ladinin-1; Squamous cell carcinoma.


Conflict of interest statement

The authors declare no competing interests.

Figures

Fig. 1
Fig. 1
Expressions of ladinin-1 (LAD1) in oral squamous cell carcinoma (OSCC) cell lines, HSC-2, HSC-3, and HSC-4. (a) Immunofluorescence for LAD1 (green) and DAPI (blue); scale bars: 50 μm. (b) LAD1 mRNA expression via real-time polymerase chain reaction (real-time PCR). (c) Protein expression using western blotting. LAD1 was localized in a linear pattern in the periphery of HSC-2, HSC-3, and HSC-4 cells, and such peripheral linear signals were most enhanced when they formed round clusters in HSC-2 and HSC-3 cells (a). The three SCC cell lines showed similar gene (b) and protein (c) expression levels for LAD1.
Fig. 2
Fig. 2
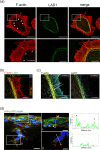
Comparative three-dimensional (3D) localization of actin versus LAD1 in HSC-4 cells. (a) Maximum intensity projection images: phalloidin-rhodamine fluorescence for F-actin, immunofluorescence for LAD1, and their merges; scale bars: 20 μm. (b) Orthogonal projection image of F-actin (red) and LAD1 (green); scale bar: 5 μm. (c) Pseudo-color image; scale bars: 4 μm. (d) Immunofluorescent images of F-actin (red) and LAD1 (green) of 3D on-gel culture section and intensity plots of the LAD1; scale bars: 20 μm (left panel) and 10 μm (a and b). Arch-shaped actin bundles, called actin arcs (white arrowheads), are arranged along the lamellipodia base, represented by fine actin meshwork, and filopodial protrusions represented by actin filament spikes. Dot-like signals inside the cell may represent cross-sectional actin fibers that are not associated with the actin arc, and LAD1 granular signals co-localized with actin filaments within the actin arc range (a). The orthogonal projection image (b) and its pseudo-color images (c) at an identical height at the cellular base revealed that LAD1 exclusively colocalized with actin filaments forming the actin arc; however, LAD1 signals scattered inside the cell did not always colocalize with short actin filaments (a–c). In the immunofluorescence of the on-gel culture section (d), peripheral accumulation of LAD1 was observed in the stacking cells on the gel layer (d-i, white arrowheads), but not in the cells invading the collagen gel (d-ii). Quantitatively, the intensity plots of LAD1 indicate peripheral accentuation (black arrowheads).
Fig. 3
Fig. 3
Functional and morphological effects of LAD1 knockdown in OSCC cell lines. (a) Cell survival analysis by 3-(4,5-dimethylthiazol-2-yl)-5-(3-carboxymethoxyphenyl)-2-(4-sulfophenyl)-2 H-tetrazolium, inner salt (MTS) assay. (b) Collagen gel invasion assay. (c) Transwell migration assay. (d) Scratch wound-healing assay. (e) Cell-tracking plots of timelapse imaging for 24 h and comparisons of velocity and distance/frame; scale bars: 100 μm (b, c). Bars in bar charts, means ± s.e.; *p < 0.05, **p < 0.01. In MTS assay (a), three cell lines showed suppression of cell survival rates in si#1 treatments. HSC-4 showed the common suppressive effect of LAD1 knockdown on cell survival. In the collagen gel invasion assay, depths of cell infiltration, i.e., absolute length from the uppermost collagen surface to the deeper cancer cells in captured foci were measured in the vertical sections of paraffin-embedded culture samples. In si#1 LAD1knockdown of the three cell lines, the cancer cells showed considerable deep infiltration (b). HSC-2 and HSC-4 with si#2 and HSC-2 and HSC-3 with si#3 also showed increased depth of infiltration. In transwell migration assays, si#1 and si#3 effectively suppressed cell migration 24 h after seeding, whereas si#2 did not (c). In the wound scratch assay with serum-free media, LAD1-knockdown cells showed wider gaps than controls 48 h after scratching only in HSC-2 and HSC-4 with si#1 (d). The time-lapse analysis was performed to analyze cellular planer motility (e). The LAD1-knockdown cells showed decreased average velocity and moving distance between the time frames.
Fig. 4
Fig. 4
Cell morphological effects of knockdown of LAD1. (a) Representative immunofluorescence images in HSC-4 cells on day three after plating; siRNAs against LAD1 (si#1) and negative control (cont). (b) The fractal dimension was obtained by the fractal analysis of immunofluorescence images using FracLac; scale bars, 50 μm (a). In immunofluorescence, the HSC-4 cells (cont) form radially extended filopodia and widely spread lamellae (asterisk), which are composed of thick and elongated actin filaments (white arrows). At the base of the filopodia and lamella, LAD1 is localized along the actin arc. The cells form polygonal and paved shapes when in contact with each other. In contrast, LAD1-knockdown cells appear shrunken with irregularly formed filopodia (white arrowheads) and a lack of lamellar expansion, resulting in a further irregular ruffled cell border shape, in which LAD1 is not localized. The fractal analysis by the box-counting method on auto-segmentation images showed HSC-3 and HSC-4 indicated significantly (p < 0.05) higher average values of fractal dimension in LAD1 knockdown cells by si#1. Inversely, HSC-2 showed a decrease in fractal dimension in si#2.
Fig. 5
Fig. 5
Transcriptome analysis using high-throughput RNA sequencing (RNA-seq). (a) The t-distributed stochastic neighbor embedding (t-SNE) plot. (b) MA-plot of expressing genes. (c) Heatmap of the selected clusters from the biclustering analysis. (d) Gene ontology analysis according to biological processes in the selected cluster. Transformed RNA-seq data were analyzed using iDEP. Principal component analysis using t-SNE revealed clear differences between control and LAD1-knockdown samples (a). Differential expression gene analysis revealed 1059 upregulated and 694 downregulated genes (b). Further biclustering analysis using the BCCC method revealed five clusters, and the selected cluster No. 1 enriched several biological processes including “cell motility” and “cell localization” (c).
Fig. 6
Fig. 6
Cell motility-related gene expression profiles in LAD1-knockdown HSC-4 cells. (a) Listing of representative upregulated or downregulated genes. Red dots, upregulated genes; green, downregulated genes; black, stable genes; gray, genes with no significant differences. (b) Volcano plot of listed genes. In LAD1-knockdown HSC-4 cells (si#1), the mRNA expression levels of CAV1, FGF2, and the other five genes were significantly repressed (p < 0.05) (a) among the 84 cell-motility-related genes in the PCR array kit used, whereas those of PAK1, VIM, and the other four genes were significantly enhanced (b).
Fig. 7
Fig. 7
Expression levels of vimentin and LAD1 and histological differentiation of the public cancer dataset. (a) Representative immunofluorescent images of HSC-3 and dot plots of vimentin-positive cell ratio in HSC-2, HSC-3, and HSC-4 cells. (b) A confocal immunofluorescence image of the vertical section of HSC-4 cells cultured on the collagen gel for LAD1 (red) and vimentin (green) with nuclear staining (Hoechst, blue). (c) Fluorescent intensity plot of vimentin (green) and LAD1 (red) on the yellow arrow in panel (b). (d) The histological grades of LAD1-mRNA high and low expression groups in the head and neck squamous cell carcinoma dataset of the cancer genome atlas; scale bars: 200 μm (a) and 20 μm (b). Bars in the chart, means ± s.e.; *p < 0.05, **p < 0.01. G1, well-differentiated; G2, moderately-differentiated; G3, poorly-differentiated; G4, undifferentiated; GX, not assessed. In LAD1-knockdown cells, the ratio of vimentin-positive cells significantly increased, and HSC-3 cells showed a high vimentin-positive percentage in LAD1-knockdown conditions (a). In the section of HSC-4 cells cultured on collagen gel, stacked cells on the gel were positive for LAD1 (red); however, invading cells in the gel showed strong positivity for vimentin (green) (b). In the measurement of fluorescence intensity (c), the vimentin intensity (green line) gradually increased from the surface (asterisks) to the deeper parts (daggers). Reciprocally, the LAD1 intensity (red line) was higher in surface cells (asterisks) but lower in deeper cells (daggers). Public database analysis via cBioportal revealed a significant increased rate (p < 0.05) of well-differentiated histology (G1) in the LAD1-mRNA high-expressing squamous cell carcinoma group.

References

    1. Abé, T. et al. Proteomic and histopathological characterization of the interface between oral squamous cell carcinoma invasion fronts and non-cancerous epithelia. Exp. Mol. Pathol. 102, 327–336 (2017). - PubMed
    1. Ishiko, A. et al. 97-kDa linear IgA bullous dermatosis (LAD) antigen localizes to the Lamina lucida of the epidermal basement membrane. J. Investig. Dermatol. 106, 739–743 (1996). - PubMed
    1. Marinkovich, M. P., Taylor, T. B., Keene, D. R., Burgeson, R. E. & Zone, J. J. LAD-1, the linear IgA bullous dermatosis autoantigen, is a novel 120-kDa anchoring filament protein synthesized by epidermal cells. J. Investig. Dermatol. 106, 734–738 (1996). - PubMed
    1. Roth, L. et al. SILAC identifies LAD1 as a filamin-binding regulator of actin dynamics in response to EGF and a marker of aggressive breast tumors. Sci. Signal. 11, eaan0949 (2018). - PubMed
    1. Moon, B. et al. LAD1 expression is associated with the metastatic potential of colorectal cancer cells. BMC Cancer 20, 1180 (2020). - PMC - PubMed

MeSH terms