. 2024 Nov;9(11):2892-2908.
doi: 10.1038/s41564-024-01800-z. Epub 2024 Oct 1.

Microbiome-metabolite linkages drive greenhouse gas dynamics over a permafrost thaw gradient

Collaborators, Affiliations

Microbiome-metabolite linkages drive greenhouse gas dynamics over a permafrost thaw gradient

Viviana Freire-Zapata et al. Nat Microbiol. 2024 Nov.

Abstract

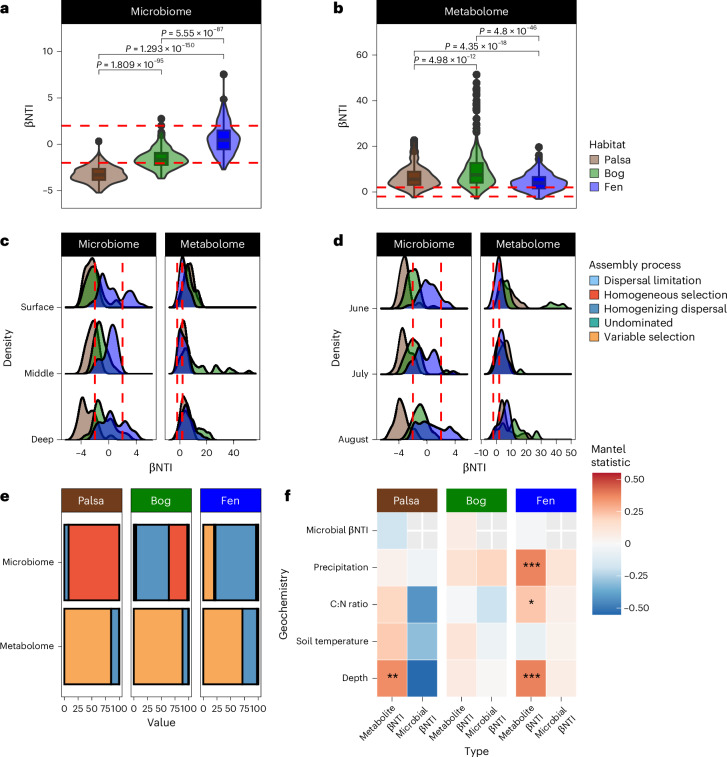
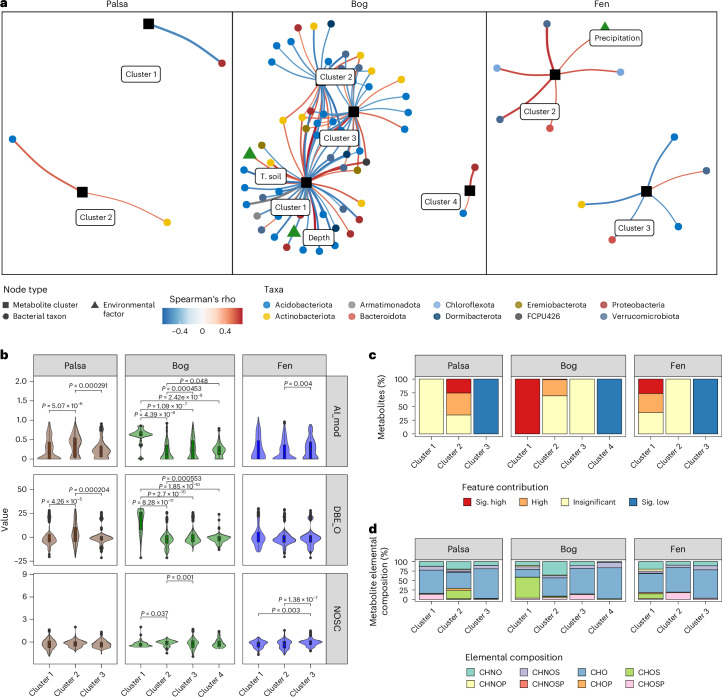
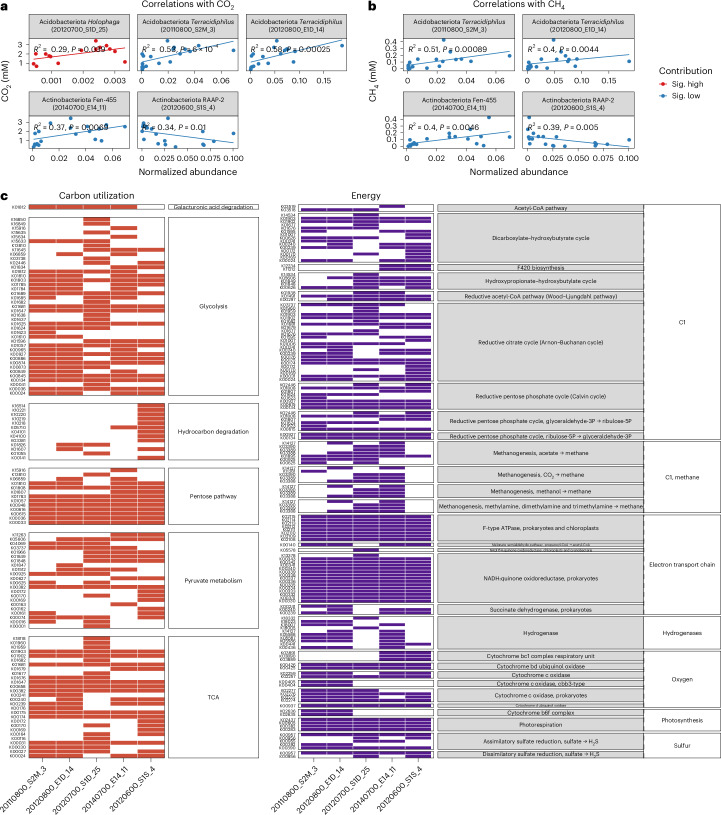
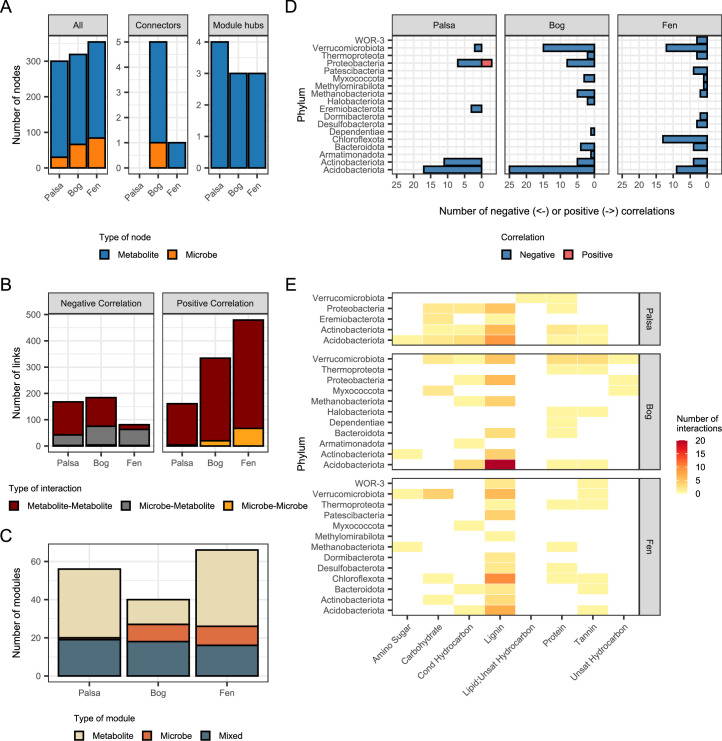
Interactions between microbiomes and metabolites play crucial roles in the environment, yet how these interactions drive greenhouse gas emissions during ecosystem changes remains unclear. Here we analysed microbial and metabolite composition across a permafrost thaw gradient in Stordalen Mire, Sweden, using paired genome-resolved metagenomics and high-resolution Fourier transform ion cyclotron resonance mass spectrometry guided by principles from community assembly theory to test whether microorganisms and metabolites show concordant responses to changing drivers. Our analysis revealed divergence between the inferred microbial versus metabolite assembly processes, suggesting distinct responses to the same selective pressures. This contradicts common assumptions in trait-based microbial models and highlights the limitations of measuring microbial community-level data alone. Furthermore, feature-scale analysis revealed connections between microbial taxa, metabolites and observed CO2 and CH4 porewater variations. Our study showcases insights gained by using feature-level data and microorganism-metabolite interactions to better understand metabolic processes that drive greenhouse gas emissions during ecosystem changes.


Conflict of interest statement

The authors declare no competing interests.

Figures

Fig. 1
Fig. 1. Ecological assembly processes driving active-layer permafrost microbial communities and metabolites.
a,b, Comparison of the average within-habitat βNTI, an index used to compare the ecological processes driving microbial (a) and metabolite (b) assemblages. Violin plots show the average within-habitat βNTI of each sample (microbial: palsa, n = 21; bog, n = 22; fen, n = 24; metabolome: palsa, n = 29; bog, n = 27; fen, n = 29) calculated from MAG-derived OTUs and TWCD metabolites. Boxes represent the upper and lower quartiles, the line in each box represents the median and the whiskers represent the maximum and minimum values, no further than 1.5 times the interquartile range; values beyond the whiskers represent outliers and are plotted individually. Significant differences between habitats were determined using a two-sided Mann–Whitney U test. Assembly processes can be delimited by the red dashed lines; variable selection (βNTI > 2), homogenous selection (βNTI < −2), stochastic assembly (|βNTI| < 2). P values were adjusted using the Bonferroni method and are indicated as ‘P =’. c,d, Density plots showing changes in the βNTI of each habitat with depth (c) and month (d). Assembly processes can be delimited by the red dashed lines: variable selection (βNTI > 2), homogenous selection (βNTI < −2), stochastic assembly (|βNTI| < 2). e, Bar plots showing the putative influence of different ecological processes within each habitat according to (from top to bottom) the microbial community and bulk metabolites. f, Correlation of microbial and metabolite βNTI values with environmental data using a one-sided Mantel test using Pearson’s correlation method. The heatmap shows Mantel correlations between peat samples’ βNTI, calculated within bulk metabolites and the pairwise differences of each environmental variable between samples. Mantel r values range from 1 to −1 showing positive and negative correlations. P values were adjusted using the Bonferroni method. Metabolite βNTI correlation with depth in palsa, P = 0.0115, and with depth, P = 0.0005; C:N ratio, P = 0.032; and precipitation, P = 0.0005, in the fen. Source data
Fig. 2
Fig. 2. Metabolite-βNTIfeature-derived clusters correlate with specific microbial taxa and environmental factors.
a, Spearman correlations between metabolite-βNTIfeature-derived clusters and bacterial genomes normalized abundances and environmental factors (T. soil is depth, precipitation, soil temperature). Correlation P values were estimated with rcorr() from the Hmisc R package (two-sided test). Only metabolite clusters showing significant correlations (P adjusted < 0.05) are shown. The false discovery rate method was used for multiple correction testing. The colour and thickness of the edges represent Spearman rho values; positive correlations are shown in red, negative correlations in blue. b, Differences of metabolite properties, including AI_mod, DBE_O and NOSC, between each cluster within each habitat (number of metabolite features in each habitat’s clusters: palsa: cluster 1 = 764, cluster 2 = 142, cluster 3 = 228; bog: cluster 1 = 29, cluster 2 = 284, cluster 3 = 696; fen cluster 1 = 95, cluster 2 = 539, cluster 3 = 259). Significant differences between metabolite clusters were determined using a two-sided Wilcoxon test. Boxes represent the upper and lower quartiles, the line in each box represents the median value and the whiskers represent the maximum and minimum values, no further than 1.5 times the interquartile range; values beyond the whiskers represent outliers and are plotted individually. P values were adjusted using the Bonferroni method. c, Percentage of metabolites that contribute to metabolome assembly as follows: |βNTIfeature| < 1, insignificant; βNTIfeature ≥ 2, significant high divergence (Sig. high); βNTIfeature ≥ 1, high divergence (High); βNTIfeature ≤ −2, significant high convergence (Sig. low); and βNTIfeature ≤ −1, high convergence (Low). d, Percentage of metabolite elemental compositions within each cluster. Source data
Fig. 3
Fig. 3. Correlation of genomes that significantly correlated with BNTIfeature metabolite clusters with CO2 and CH4 in the bog porewater.
a,b, Spearman correlation between genome abundances and CO2 (a) and CH4 (b) in the bog porewater (n = 19 bog samples). Correlation P values were estimated with rcorr() from the Hmisc R package (two-sided test). P values were adjusted using the FDR method. Contribution to microbial community assembly: βNTIfeature ≥ 2, significant high divergence (Sig. high), and βNTIfeature ≤ −2, significant high convergence (Sig. low). c, Functional potential of these taxa. The heatmap represents the functional potential of these five MAGs. The heatmap is divided into functional categories (right) with different functions within each category; the presence of a function is observed as a coloured rectangle. Source data
Fig. 4
Fig. 4. Microbial–metabolite co-occurrence networks within each habitat across the thaw gradient and their functional potential.
ac, Networks within the palsa (a), bog (b) and fen (c), in which metabolites are represented by circles and microbial phyla are represented by squares. Networks are coloured by metabolite elemental composition. Larger circles or squares represent microbial and metabolite node hubs and connectors. df, Metabolic alluvial plots representing the contribution of different MAGs to individual metabolic and biogeochemical processes within the carbon, nitrogen, sulfur and other cycles in the palsa (d), bog (e) and fen (f). Microbial genomes within each habitat are represented at the phylum level. The three columns from left to right represent taxonomic groups scaled by the number of genomes, the contribution to each metabolic function by microbial groups calculated based on genome coverage and the contribution to each functional category or biogeochemical cycle. Different colours represent different phyla. Source data
Extended Data Fig. 1
Extended Data Fig. 1. Metabolite assembly.
A. βNTI feature contribution and the proportion of each elemental composition across and within habitats. B. Relative abundance of different elemental compositions in the three habitats (metabolome: palsa n = 29, bog n = 27, fen n = 29) where differences between habitats were calculated using a two-sided Wilcox test. Boxes represent the upper and lower quartile, the line in the box represents the median value and the whiskers represent the maximum and minimum value, no further than 1.5 times the interquartile range, values beyond the whiskers represent outliers and are plotted individually. P values were adjusted using Bonferroni method. C. Relative abundance of metabolite clusters class composition within each habitat. Source data
Extended Data Fig. 2
Extended Data Fig. 2. Expression in transcripts per million (TPM) of metagenome assembled genomes (MAGs) that correlated with metabolite-βNTI-feature derived clusters 1 in the bog.
Heatmap representing the expression in TPM of MAGs correlated metabolite-βNTI-feature derived clusters 1 in the bog. The heatmap is divided into functional categories (right) with different functions within each category. Source data
Extended Data Fig. 3
Extended Data Fig. 3. Expression in transcripts per million (TPM) of metagenome assembled genomes (MAGs) that correlated with greenhouse gases in the bog.
A. Heatmap representing the expression in TPM of MAGs correlated with greenhouse gases in the bog, the heatmap is divided into KEGG functional categories (right). B. Heatmap representing the expression in TPM of carbohydrate active enzymes expressed by these MAGs, CAZYmes are divided into different families (right). Source data
Extended Data Fig. 4
Extended Data Fig. 4. Microbial-metabolite co-occurrence networks parameters.
A. Bar plots showing the total number of nodes in the network of each habitat and how many of those were either connectors or module hubs. Blue bars represent metabolite nodes and orange bars microbial nodes. B. Bar plots showing the number of links in the network of each habitat. Bars are colored to represent if the interactions were between pairs of metabolites, pairs of microbes or between a microbe and a metabolite. C. Bar plot representing the number of modules identified using the greedy modularity optimization algorithm. Colors represent if the modules contain only metabolites, only microbes or nodes from both types of data. D. Bar plot demonstrating the total number of correlations per networked phylum within each habitat. Positive correlations in red and negative correlations in blue. E. Heatmap showing the number of interactions of each networked phylum with different classes of metabolites, darked color means a higher number of interactions. Source data
Extended Data Fig. 5
Extended Data Fig. 5. Number of Carbohydrate-Active enZYmes (CAZymes) annotated and expressed in the networked taxa.
Phylogenetic tree of the networked MAGs. Colored tiles show to which habitat network (Bog - green, Fen - blue, Palsa - brown) each MAG belongs to. The height of the bar plots in the outer ring indicates the number of CAZyme families that were annotated in each MAG. The color of the bar indicates how many genes encoding CAZymes were found in each MAG. The external bar indicated the number of expressed CAZymes. Source data
Extended Data Fig. 6
Extended Data Fig. 6. Expression in transcripts per million (TPM) of metagenome assembled genomes (MAGs) that form part of the microbe-metabolite networks in the three habitats.
Heatmap representing the expression in TPM of MAGs that form part of the microbial-metabolite networks in the three habitats, palsa, bog and fen. The heatmap is divided into functional categories (right) with different functions within each category. Source data

References

    1. Ma, L. et al. A globally robust relationship between water table decline, subsidence rate, and carbon release from peatlands. Commun. Earth Environ.3, 254 (2022).
    1. Tanentzap, A. J. et al. Chemical and microbial diversity covary in fresh water to influence ecosystem functioning. Proc. Natl Acad. Sci. USA116, 24689–24695 (2019). - PMC - PubMed
    1. Woodcroft, B. J. et al. Genome-centric view of carbon processing in thawing permafrost. Nature560, 49–54 (2018). - PubMed
    1. Dettmer, K., Aronov, P. A. & Hammock, B. D. Mass spectrometry-based metabolomics. Mass Spectrom. Rev.26, 51–78 (2007). - PMC - PubMed
    1. Shah, R. M. et al. Omics-based ecosurveillance uncovers the influence of estuarine macrophytes on sediment microbial function and metabolic redundancy in a tropical ecosystem. Sci. Total Environ.809, 151175 (2022). - PubMed

LinkOut - more resources