. 2024 Nov;30(11):3357-3368.
doi: 10.1038/s41591-024-03190-5. Epub 2024 Oct 1.

Increased frequency of repeat expansion mutations across different populations

Affiliations

Increased frequency of repeat expansion mutations across different populations

Kristina Ibañez et al. Nat Med. 2024 Nov.

Abstract

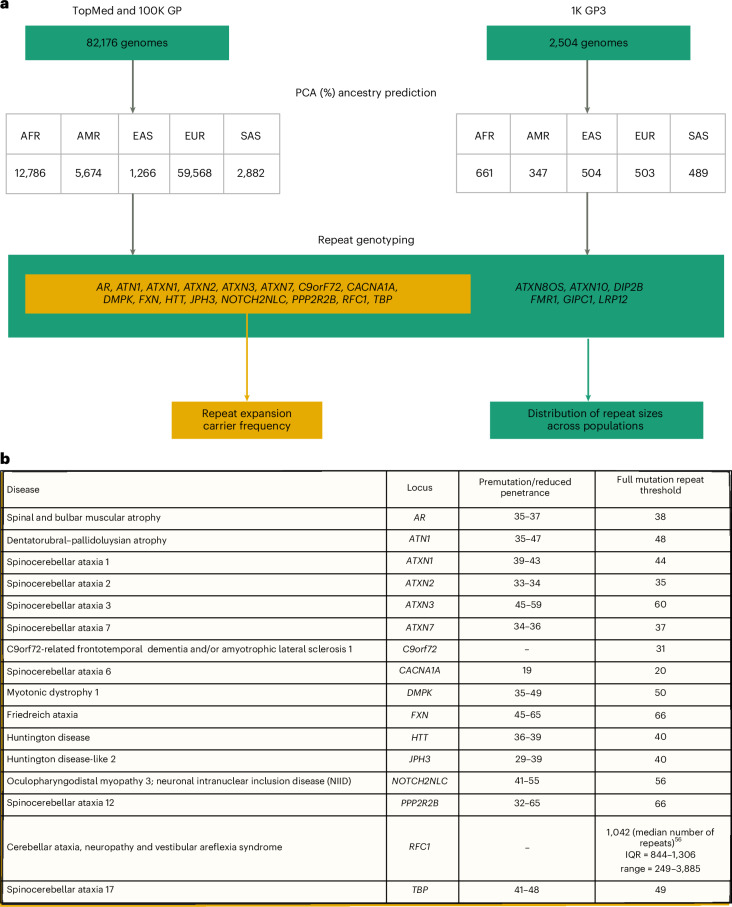
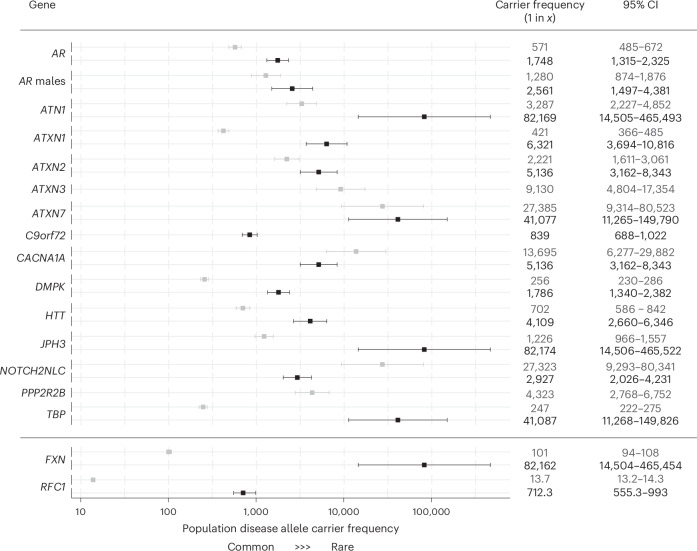
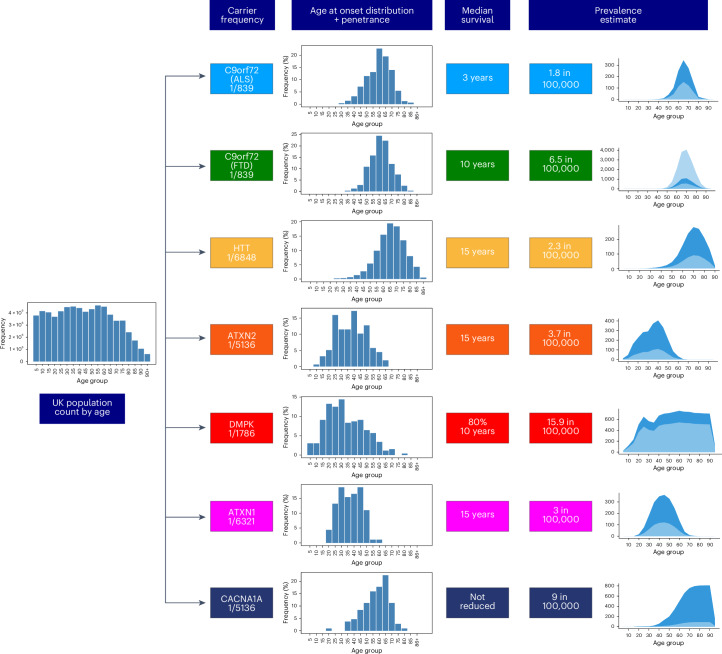
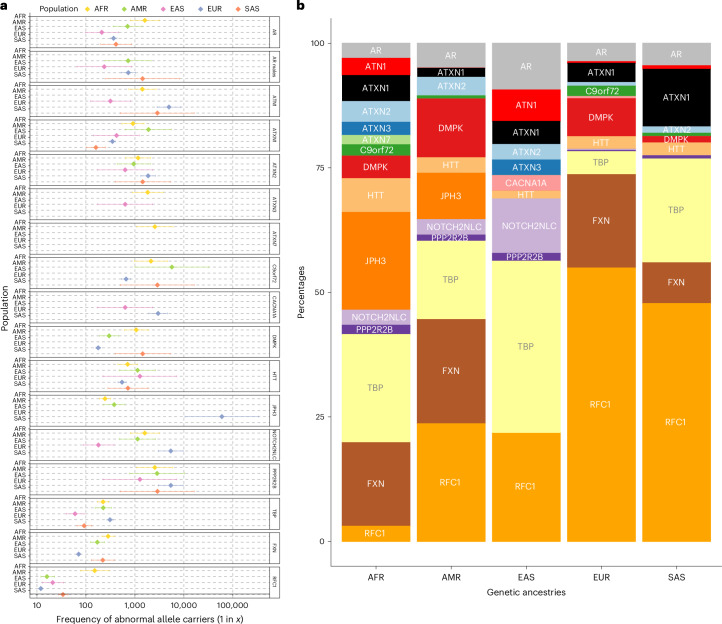
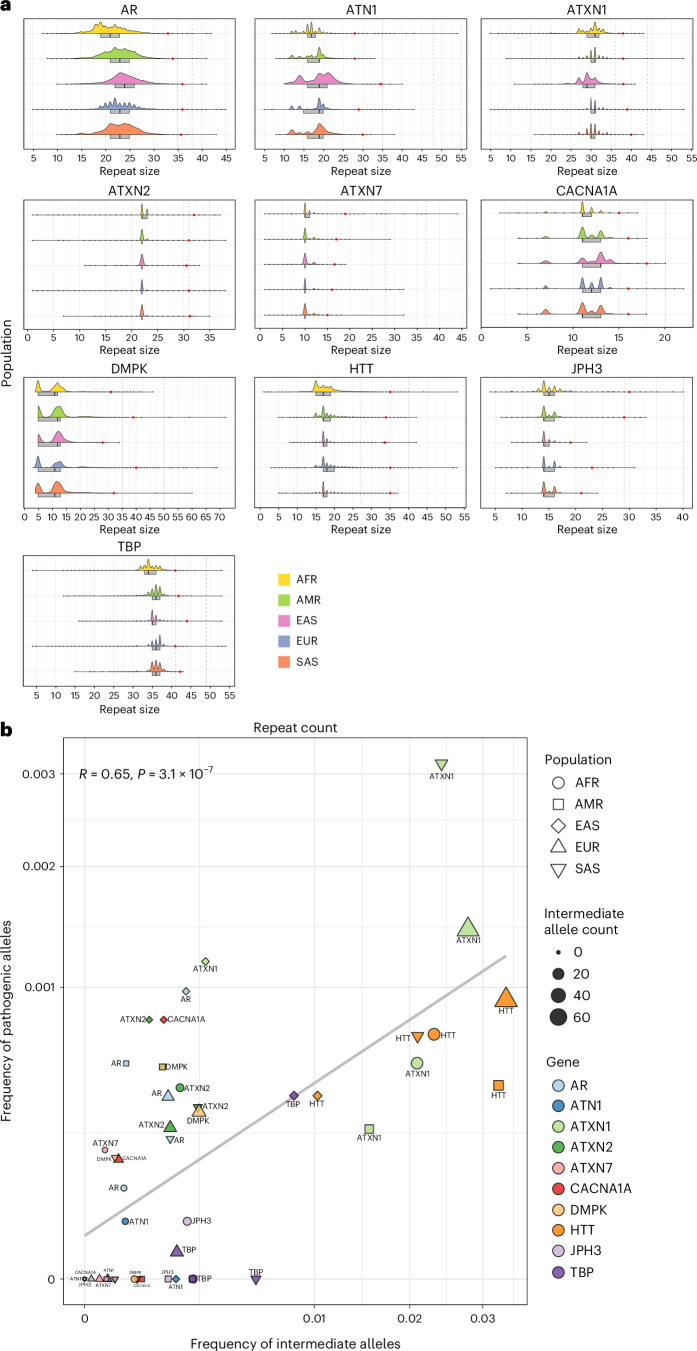
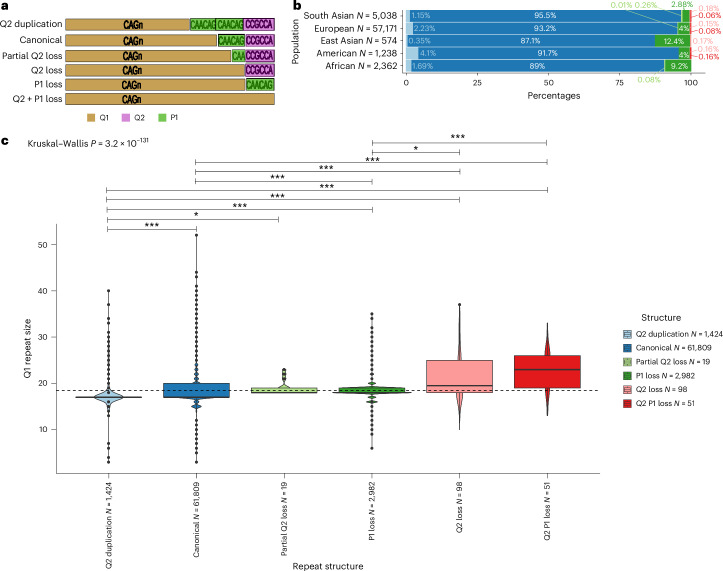
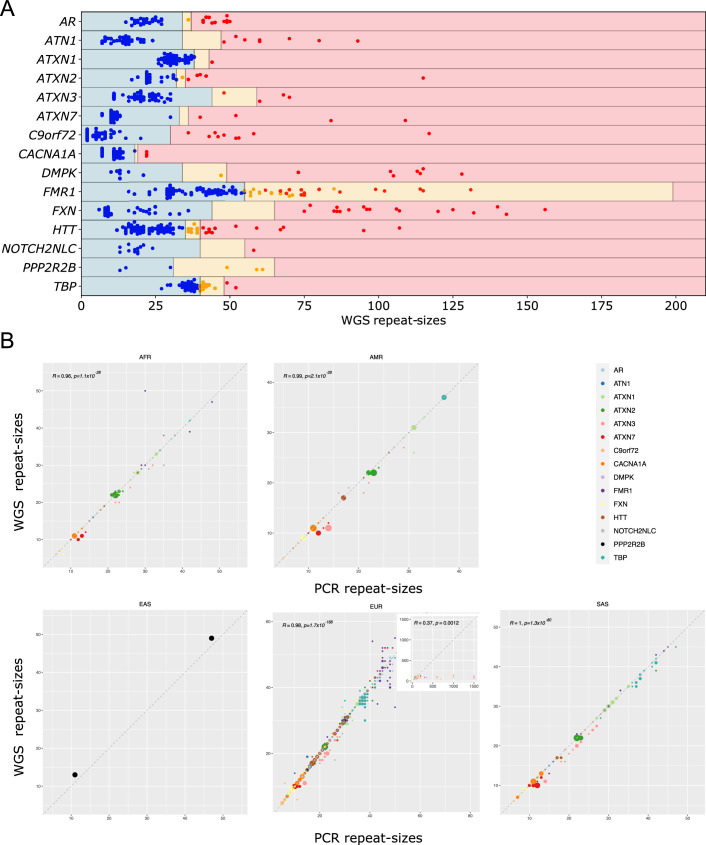
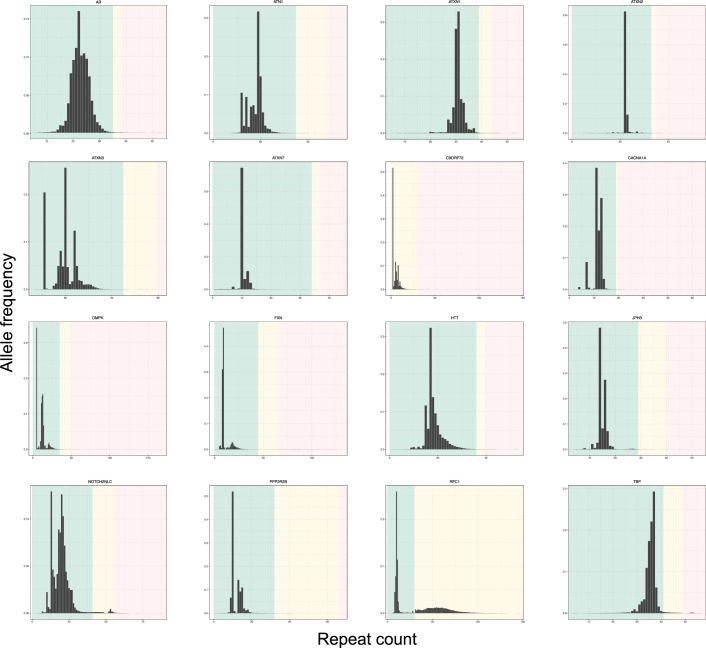
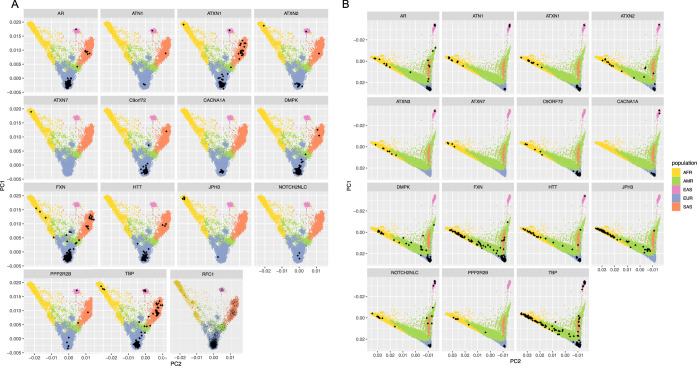
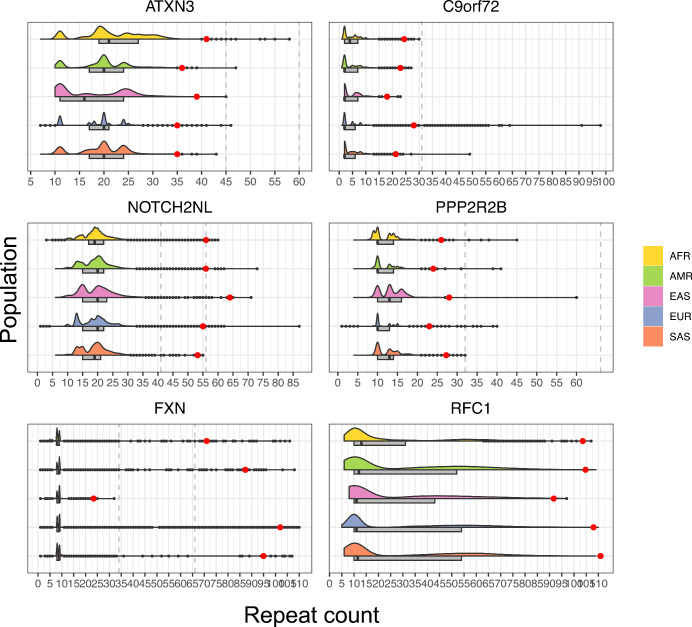
Repeat expansion disorders (REDs) are a devastating group of predominantly neurological diseases. Together they are common, affecting 1 in 3,000 people worldwide with population-specific differences. However, prevalence estimates of REDs are hampered by heterogeneous clinical presentation, variable geographic distributions and technological limitations leading to underascertainment. Here, leveraging whole-genome sequencing data from 82,176 individuals from different populations, we found an overall disease allele frequency of REDs of 1 in 283 individuals. Modeling disease prevalence using genetic data, age at onset and survival, we show that the expected number of people with REDs would be two to three times higher than currently reported figures, indicating underdiagnosis and/or incomplete penetrance. While some REDs are population specific, for example, Huntington disease-like 2 in Africans, most REDs are represented in all broad genetic ancestries (that is, Europeans, Africans, Americans, East Asians and South Asians), challenging the notion that some REDs are found only in specific populations. These results have worldwide implications for local and global health communities in the diagnosis and counseling of REDs.


Conflict of interest statement

Competing interests The authors declare no competing interests.

Figures

Fig. 1
Fig. 1. Overview of the study.
a, Technical flowchart. Whole-genome sequences from the 100K GP and TOPMed datasets were first selected by excluding those associated with neurological diseases. WGS data from 1K GP3 were also selected by having the same technical specifications (Methods). After inferring ancestry prediction, repeat sizes for all 22 REDs were computed by using EH v3.2.2. On one hand, for 16 REDs overall carrier frequency, disease modeling and correlation distribution of long normal alleles were computed in the 100K GP and TOPMed projects (yellow box). On the other hand, the distribution of repeat sizes across different populations was analyzed in 100K GP and TOPMed combined, and in the 1K GP3 cohorts. AFR, African; AMR, American; EAS, East Asian; EUR, European; SAS, South Asian. b, A list of the RED loci included in the study, including repeat-size thresholds for reduced penetrance and full mutations.
Fig. 2
Fig. 2. Forest plot with combined overall disease allele carrier frequency in the combined 100K GP and TOPMed datasets N = 82,176 (N individuals may vary slightly between loci owing to data quality and filtering; Supplementary Table 7).
The squares show the estimated disease allele carrier frequency, and the bars show the 95% confidence interval (CI) values. Details of the statistical models are described in Methods. For autosomal dominant loci (AR, ATN1, ATXN1, ATXN2, ATXN3, ATXN7, C9orf72, CACNA1A, DMPK, HTT, JPH3, NOTCH2NLC, PPP2R2B and TBP), the gray and black boxes show premutation/reduced penetrance and full-mutation allele carrier frequencies. For recessive loci (FXN and RFC1) the gray and black boxes show mono- and biallelic carrier frequencies, respectively.
Fig. 3
Fig. 3. Flowchart showing the modeling of disease prevalence by age for C9orf72-ALS, C9orf72-FTD, HD in 40 CAG repeat carriers, SCA2, DM1, SCA1 and SCA6.
The UK population count by age is multiplied by the disease allele frequency of each genetic defect and the age of onset distribution of each corresponding disease, and corrected for median survival. Penetrance is also taken into account for C9orf72-ALS and C9orf72-FTD. The estimated number of people affected by REDs (dark-blue area) is compared with the reported prevalence from the literature (light-blue area). x-axis: The age bins are 5 years each; y-axis: estimated number of affected individuals. For C9orf72-FTD, given the wide range of the reported disease prevalence,, both lower and upper limits are plotted in light blue.
Fig. 4
Fig. 4. Pathogenic RED frequencies in different populations (African 12,786, American 5,674, East Asian 1,266, European 59,568, South Asian 2,882).
a, Forest plot of pathogenic allele carrier frequency divided by population. Pathogenic alleles are defined as those larger than the premutation cutoff (Fig. 1b). The data are presented as squares showing the estimated pathogenic allele carrier frequency and bars showing the 95% confidence interval values. b, Bar chart showing the proportion of pathogenic allele carrier frequency repeats by ancestry. Both plots have been generated by combining data from 100K GP and TOPMed from a total of N = 82,176 unrelated genomes. N individuals may vary slightly between loci due to data quality and filtering (Supplementary Tables 17 and 18). Predicted ancestries are abbreviated as follows: AFR, African; AMR, American; EAS, East Asian; EUR, European; SAS, South Asian.
Fig. 5
Fig. 5. The distribution of repeat lengths in different populations.
a, Half-violin plots showing the distribution of alleles in different populations (African 12,786, American 5,674, East Asian 1,266, European 59,568, South Asian 2,882) for 10 loci (Methods) from the combined 100K GP and TOPMed cohorts. The box plots highlight the interquartile range and median, and the black dots show values outside 1.5 times the interquartile range. The red dots mark the 99.9th percentile for each population and locus. The vertical bars indicate the intermediate and pathogenic allele thresholds (Supplementary Table 20). Predicted ancestries are abbreviated as follows: AFR, African; AMR, American; EAS, East Asian; EUR, European; SAS, South Asian. b, A scatter plot showing the frequency of intermediate allele carriers against the frequency of pathogenic allele carriers. The data points are divided by population (n = 5) and gene (n = 10), and the size represents the total number of intermediate alleles. Correlations were computed using the Spearman method and two-tailed P values.
Fig. 6
Fig. 6. HTT repeat structures show varied prevalence across genetic ancestries and are associated with CAG repeat size.
a, Allele structures observed within exon 1 of HTT. The CAG repeat is denoted as ‘Q1’ and marked in gold. The CAACAG unit is referred to as ‘Q2’ and is marked in green. The first proline-encoding ‘CCGCCA’ repeat element is referred to as ‘P1’ and is marked in purple. b, The prevalence of the allele structures is plotted across the studied genetic ancestries in bar plots. The ancestries are defined on the y axis. The number of alleles in each of the genetic ancestries is denoted as ‘N = …’ at each of the y-axis ticks. c, Box plots displaying the distribution of CAG repeat sizes across different repeat structures. The box plots highlight the median (horizontal lines in the center of each box plot) and interquartile range (bounds), and the black dots show values outside 1.5 times the interquartile range. The number of alleles with different repeat structures is denoted as ‘N = …’ on the x axis. A linear model was used to compare the repeat size distribution of the canonical alleles versus that of all atypical structures. Kruskal–Wallis tests with Dunn’s correction for multiple comparisons P value; P values resulting from pairwise tests are displayed above each structure (***P < 0.001; *P < 0.05). Q2 versus canonical (P = 6.4 × 10−32), Q2 versus partial Q2 loss (P = 3.5 × 10−2), Q2 duplication versus P1 loss (P = 5.9 × 10−98), Q2 duplication versus Q2 loss (P = 8.5 × 10−16); Q2 duplication versus Q2–P1 loss (P = 6.2 × 10−20), canonical versus P1 loss (P = 2.4 × 10−80), canonical versus Q2 loss (P = 2.8 × 10−8), canonical versus Q2–P1 loss (P = 1.2 × 1012), P1 loss versus Q2 loss (P = 2.8 × 10−2), P1 loss versus versus Q2–P1 loss (P = 5.6 × 10−6).
Extended Data Fig. 1
Extended Data Fig. 1. Study cohorts by gender and age.
Population pyramid of (A) the 100 K GP and (B) TOPMed cohorts.
Extended Data Fig. 2
Extended Data Fig. 2. Principal components of genetic ancestry.
First two principal components derived from PCA on A) the 100 K GP and B) TOPMed samples respectively.
Extended Data Fig. 3
Extended Data Fig. 3. Experimental estimations of repeat sizes using PCR versus genotypes generated by ExpansionHunter v3.2.2.
a). Swim lane plot showing sizes of repeat expansions predicted by ExpansionHunter across 681 samples with expansion calls. Each genome is represented by two points, one corresponding to each allele for each locus, except for those on the X chromosome (that is FMR1 and AR) in males, for which only one point is shown. Points indicate the repeat length estimated by ExpansionHunter after visual inspection and the colours indicate the repeat size as assessed by PCR (blue represents non-expanded; red represents expanded). The regions are shaded to indicate non-expanded (blue), premutation (yellow), and expanded (red) ranges for each gene, as indicated in Table 1. Blue points in yellow or red-shaded regions indicate false positives and red points in blue-shaded regions indicate false negatives. The individual calls are provided in Supplementary Table 3. b). Points indicate the RE size estimated by both PCR and EH v3.2.2 split by super-population. We show the R correlation coefficient calculated using Pearson’s equation and two-tailed P values. Exact p-values for the regression model: AFR (1.1×10⁻²⁸), AMR (2.1×10⁻²⁹), EUR (1.7×10−168), and SAS (1.3×10–80).
Extended Data Fig. 4
Extended Data Fig. 4. Distribution of repeat size alleles within the combined 100 K GP and TOPMed cohort.
Allele frequency (percentage) predicted by ExpansionHunter in the combined 100 K GP and TOPMed cohorts. The regions are shaded to indicate non-expanded (blue), premutation (yellow), and full mutation expanded (red) ranges for each gene, as indicated in Table 1. For RFC1, repeat sizes beyond 30 are shaded as repeat sizes beyond this threshold may represent expanded alleles.
Extended Data Fig. 5
Extended Data Fig. 5. PC values of genomes carrying normal and pathogenic alleles.
Principal component (PC) values on all genomes within (A) the 100 K GP and (B) TOPMed cohorts. Black dots represent genomes having a repeat size beyond premutation and full mutation range for X-linked and autosomal dominant loci, split by locus. For recessive loci, the plot shows genomes carrying monoallelic and biallelic expansions. Note that RFC1 has only been analysed in the 100 K GP dataset due to code availability. Note that ATXN3 is missing from the 100 K GP panels as there are no pathogenic alleles in this cohort (Supplementary Table 7).
Extended Data Fig. 6
Extended Data Fig. 6. Distribution of repeat size alleles in different populations in the combined cohort (100K GP  and TOPMed).
Half-violin plots showing the distribution of alleles in different populations for 6 loci excluded from the correlation analysis from the combined 100K GP and TOPMed cohort (African = 12,786; American = 5,674; East Asian = 1,266; European = 59,568; South Asian = 2,882). Boxplots highlight the interquartile range and median, and black dots show values outside 1.5 times interquartile ranges. Red dots mark the 99.9th percentile for each population and locus. Vertical bars indicate the intermediate and pathogenic allele thresholds (Supplementary Table 20).
Extended Data Fig. 7
Extended Data Fig. 7. Frequency of intermediate alleles versus frequency of pathogenic alleles by population.
The scatter plots show the frequency of intermediate allele carriers (x-axis) against the frequency of pathogenic allele carriers (y-axis), based on the thresholds in Supplementary Table 20, split by population. Data points are divided by gene (n = 10), and size represents the total number of intermediate alleles. Correlations were computed using the Spearman method.
Extended Data Fig. 8
Extended Data Fig. 8. Distribution of repeat size alleles by population in the 1 K GP.
Distribution of disease RE sizes for 22 genes within the 1 K GP3 split by population (African = 661; American = 347; East Asian = 504; European = 503; South Asian = 489). Half-violin plots show the distribution of alleles, while boxplots highlight the interquartile range and median, and black dots show values outside 1.5 times interquartile ranges. Red dots mark the 99.9th percentile for each population and locus. Repeat size mean;median (Q1-Q3) among all ancestries are in Supplementary Table 19.

Update of

References

    1. Paulson, H. Repeat expansion diseases. Handb. Clin. Neurol.147, 105–123 (2018). - PMC - PubMed
    1. Cortese, A. et al. Biallelic expansion of an intronic repeat in RFC1 is a common cause of late-onset ataxia. Nat. Genet.51, 649–658 (2019). - PMC - PubMed
    1. Moore, K. M. et al. Age at symptom onset and death and disease duration in genetic frontotemporal dementia: an international retrospective cohort study. Lancet Neurol.19, 145–156 (2020). - PMC - PubMed
    1. Gossye, H., Engelborghs, S., Van Broeckhoven, C. & van der Zee, J. C9orf72 Frontotemporal Dementia and/or Amyotrophic Lateral Sclerosis (Univ. Washington, 2020).
    1. van der Ende, E. L. et al. Unravelling the clinical spectrum and the role of repeat length in C9ORF72 repeat expansions. J. Neurol. Neurosurg. Psychiatry92, 502–509 (2021). - PMC - PubMed

Grants and funding

LinkOut - more resources