. 2024 Oct 2;7(1):1238.
doi: 10.1038/s42003-024-06942-8.

Human DUS1L catalyzes dihydrouridine modification at tRNA positions 16/17, and DUS1L overexpression perturbs translation

Affiliations

Human DUS1L catalyzes dihydrouridine modification at tRNA positions 16/17, and DUS1L overexpression perturbs translation

Jin Matsuura et al. Commun Biol. .

Abstract

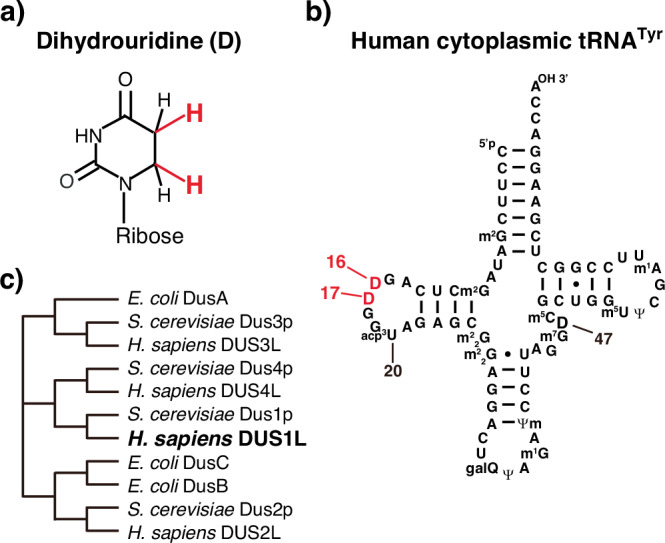
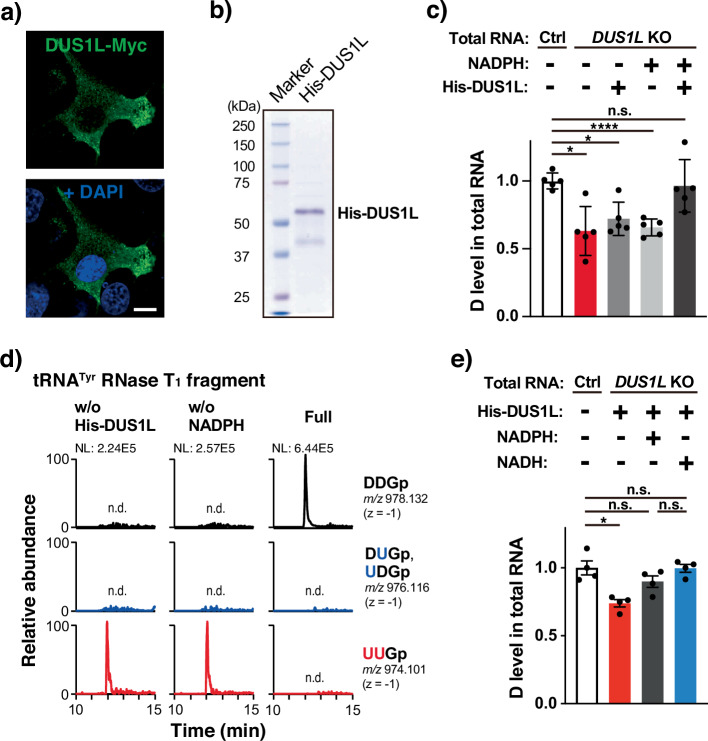
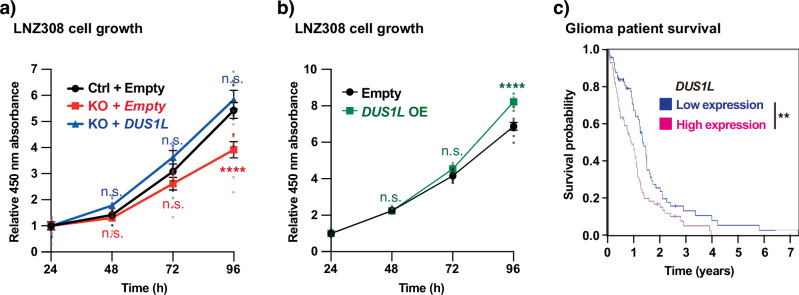
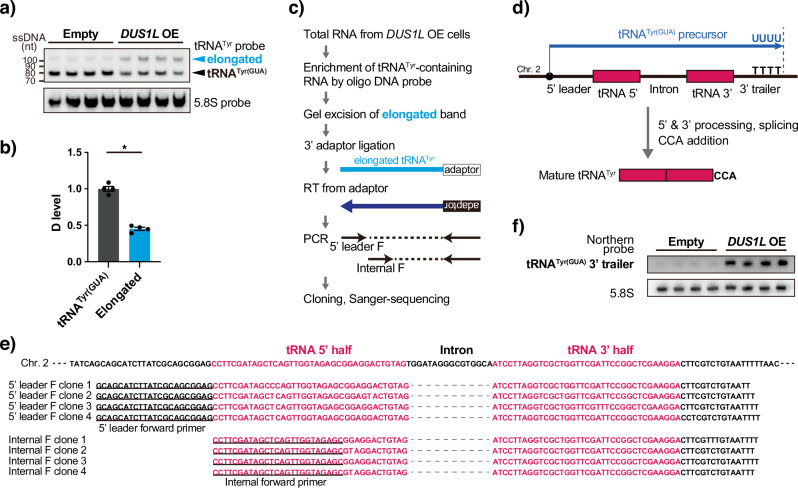
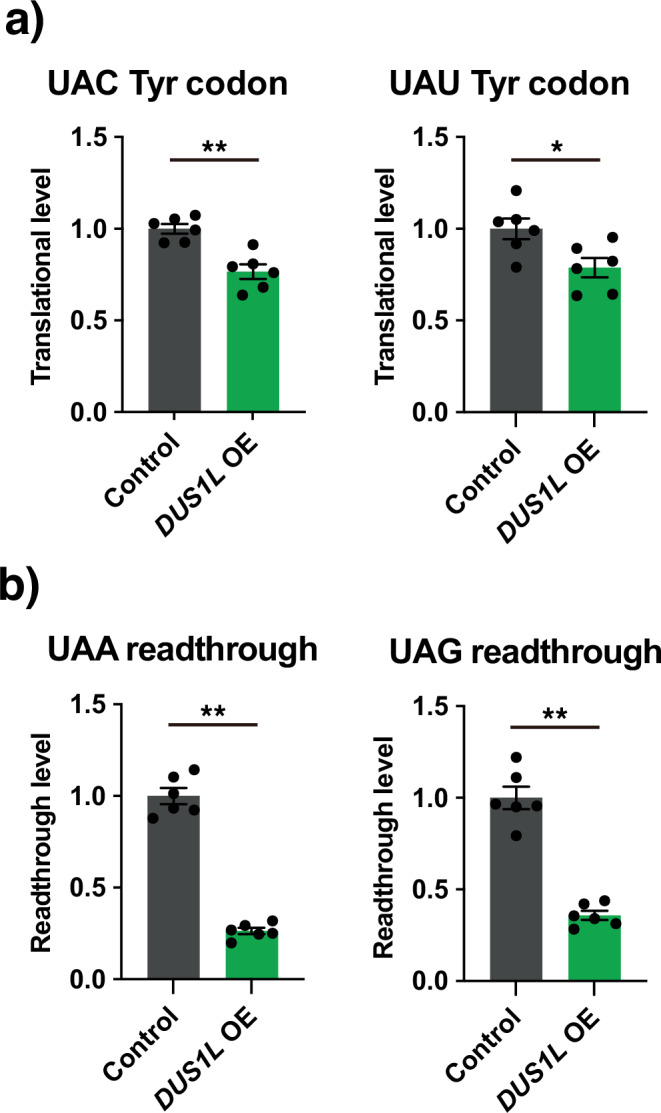
Human cytoplasmic tRNAs contain dihydrouridine modifications at positions 16 and 17 (D16/D17). The enzyme responsible for D16/D17 formation and its cellular roles remain elusive. Here, we identify DUS1L as the human tRNA D16/D17 writer. DUS1L knockout in the glioblastoma cell lines LNZ308 and U87 causes loss of D16/D17. D formation is reconstituted in vitro using recombinant DUS1L in the presence of NADPH or NADH. DUS1L knockout/overexpression in LNZ308 cells shows that DUS1L supports cell growth. Moreover, higher DUS1L expression in glioma patients is associated with poorer prognosis. Upon vector-mediated DUS1L overexpression in LNZ308 cells, 5' and 3' processing of precursor tRNATyr(GUA) is inhibited, resulting in a reduced mature tRNATyr(GUA) level, reduced translation of the tyrosine codons UAC and UAU, and reduced translational readthrough of the near-cognate stop codons UAA and UAG. Moreover, DUS1L overexpression increases the amounts of several D16/D17-containing tRNAs and total cellular translation. Our study identifies a human dihydrouridine writer, providing the foundation to study its roles in health and disease.


Conflict of interest statement

The authors declare no competing interests.

Figures

Fig. 1
Fig. 1. D modifications at positions 16 and 17 of human cytoplasmic tRNAs.
a Chemical structure of D. b Secondary structure of human cytoplasmic tRNATyr(GUA) with modified nucleosides: 2-methylguanosine (m2G), 3-(3-amino-3-carboxypropyl)uridine (acp3U), N2,N2-dimethylguanosine (m22G), galactosyl-queuosine (galQ), pseudouridine (Ψ), N1-methylguanosine (m1G), 2’-O-methylpseudouridine (Ψm), 7-methylguanosine (m7G), 5-methylcytidine (m5C), 5-methyluridine (m5U), and N1-methyladenosine (m1A). Nucleoside positions are numbered following conventional guidelines. Modified nucleosides are depicted according to a previous study. c Neighbor-joining tree of DUS homologs from E. coli, S. cerevisiae, and H. sapiens generated by alignment of protein sequences and depiction of a cladogram using Clustal omega and its associated applications. The DUS homologs and their RefSeq numbers are as follows: E. coli DusA (NP_418473.3), DusB (NP_417726.1), and DusC (NP_416645.1); S. cerevisiae Dus1p (NP_013631.1), Dus2p (NP_014412.1), Dus3p (NP_013505.4), and Dus4p (NP_013509.1); and H. sapiens DUS1L (NP_071439.3), DUS2L (NP_001258691.1), DUS3L (NP_064560.2), and DUS4L (NP_853559.1).
Fig. 2
Fig. 2. Loss of D16 and D17 modifications in DUS1L KO human cells.
a DUS1L alleles in DUS1L KO LNZ308 and U87 glioblastoma cell lines. Red lines indicate deletions and red letters indicate insertions. Aberrant amino acids generated by frameshifting are indicated in blue. DUS1L sgRNA 1 was used to generate LNZ308 and U87 KO1 cells. DUS1L sgRNA 2 was used to generate LNZ308 and U87 KO2 cells. Control cells were generated using sgRNAs that did not target the human genome. b RT-qPCR analysis of DUS1L mRNA levels normalized by GAPDH mRNA levels. Means ± s.e.m. from n = 4 samples each. c LC-MS analysis of total tRNA nucleosides generated by nuclease P1 digestion of total tRNA that was gel-excised after electrophoresis of total RNA. The values are the relative levels to the mean D levels of control 1 and control 2 cells, normalized by the m1G peak area of the same samples. Means ± s.e.m. from n = 4 samples each. d RT-qPCR analysis of DUS1L mRNA levels normalized by GAPDH mRNA levels in control 1 or DUS1L KO2 LNZ308 cells transduced with a lentivirus for stable expression of PAM-mutated synonymous DUS1L or with an empty control lentivirus. Means ± s.e.m. from n = 4 samples each. e Western blot analysis of lysates from the indicated cells using antibodies against DUS1L and ACTB. Endogenous DUS1L was not detected in control cells by western blotting, presumably due to its low expression, similar to many other mammalian tRNA modification enzymes. f LC-MS analysis of total RNA nucleosides generated by nuclease P1 digestion of total RNA in indicated cells. Means ± s.e.m. from n = 8 samples each. g LC-MS analysis of tRNAPhe nucleosides generated by purification of tRNAPhe from total RNA of the indicated cells and nuclease P1 digestion. Means ± s.e.m. from n = 8 (Control + Empty) or n = 4 (Control + DUS1L and DUS1L KO + Empty) samples. h LC-MS analysis of RNase T1-digested fragments of tRNATyr(GUA) purified from total RNA of the indicated cells. Extracted-ion chromatograms (XICs) of unmodified, single D-modified, and doubly D-modified 3-mer fragments (positions 16–18) with the indicated m/z are shown. NL, normalization level, n.d., not detectable. bd, f, g ****P < 0.0001, ***P < 0.001, **P < 0.01, *P < 0.05, n.s., not significant by Brown–Forsythe and Welch ANOVA tests. Exact P-values are included in the Supplementary Data 1.
Fig. 3
Fig. 3. In vitro reconstitution of tRNA D16 and D17 modifications.
a Subcellular localization of human DUS1L-Myc. U87 cells were transfected with a plasmid expressing DUS1L-Myc. Confocal microscopic images were obtained after immunostaining of Myc-tagged proteins (green) and DAPI staining (blue). Scale bar, 10 µm. b Purified His-DUS1L resolved by SDS-PAGE and stained with Coomassie Brilliant Blue. Protein size markers are indicated. c LC-MS analysis of total RNA nucleosides after incubating the reaction mixture with (+) or without (−) His-DUS1L or NADPH. Total RNA from DUS1L KO or control LNZ308 cells was used as the substrate RNA. The values are the relative levels to the mean D levels in total RNA of control cells, normalized by the uridine peak area of the same samples. Means ± s.e.m. from n = 5 samples each. d LC-MS analysis of RNase T1-digested fragments of tRNATyr(GUA) purified from total RNA after incubating the reaction mixture with or without His-DUS1L or NADPH, using total RNA from DUS1L KO LNZ308 cells as the substrate RNA. XICs of unmodified, single D-modified, and doubly D-modified 3-mer fragments (positions 16–18) with the indicated m/z are shown. e LC-MS analysis of total RNA nucleosides after incubating the reaction mixture in the same way as in (c), with (+) or without (−) NADPH or NADH. Means ± s.e.m. from n = 4 samples each. ****P < 0.0001, *P < 0.05, n.s., not significant by the Brown–Forsythe and Welch ANOVA tests. Exact P-values are included in the Supplementary Data 1.
Fig. 4
Fig. 4. Effect of DUS1L expression on the growth speed of a glioblastoma cell line.
Growth of DUS1L KO (a) and DUS1L OE (b) cells. The cell lines are the same as those used in Fig. 2. The cells were seeded at the same density at 0 h, and cell density was measured after 24, 48, 72, and 96 h using a Cell Counting Kit 8 and normalized by the cell density at 24 h. Means ± s.e.m. from n = 8 samples at each time point and cell type. ****P < 0.0001, n.s. not significant compared with control cells by a two-way ANOVA followed by a multiple comparison test. c Kaplan–Meier plot of glioma patients with higher or lower levels of tissue DUS1L mRNA expression and the P-value between the two groups (**P = 0.0024) acquired from the Human Protein Atlas database. The cut-off FPKM value between high and low DUS1L expression was set to 7.47 in order to discern 76 patients with high DUS1L expression and 77 patients with low DUS1L expression.
Fig. 5
Fig. 5. Effects of DUS1L overexpression on mature tRNA levels and total cellular translation.
Mature tRNA levels in DUS1L KO (a) and DUS1L OE (b) cells. Northern blot analysis of tRNATyr(GUA), tRNAPhe(GAA), tRNAAla(AGC), and initiator tRNAMet(CAU) was performed, followed by band quantification and normalization by 5.8S rRNA. The original images are shown in Supplementary Figs. 4 and 5. Means ± s.e.m. from n = 4 samples each. *P < 0.05 by the Mann–Whitney test. c Nascent cellular protein synthesis observed by 35S-methionine pulse labeling. A radiation image of the electrophoresed gels is shown on the left. Coomassie brilliant blue (CBB) staining of the same gel is shown on the right as a loading control. n = 4 samples each. d Quantification of the nascent protein levels in (c). Means ± s.e.m. from n = 4 samples each. *P < 0.05 by the Mann–Whitney test. Exact P-values are included in the Supplementary Data 1.
Fig. 6
Fig. 6. Effects of DUS1L overexpression on tRNATyr(GUA) maturation.
a Northern blot analysis of tRNATyr(GUA) in DUS1L OE and control LNZ308 cells. Each lane was derived from different cell dishes. The lower band corresponds to mature tRNATyr(GUA) and the upper band is elongated tRNATyr(GUA). The positions of single-stranded DNA size markers are shown on the left. b Comparison of D levels in mature tRNATyr(GUA) and the elongated band, which were enriched using an oligo DNA probe against tRNATyr(GUA) and gel excision, followed by nuclease digestion and mass spectrometry analysis, normalized by cytidine levels. Means ± s.e.m. from n = 4 samples each. *P = 0.0286 by the Mann–Whitney test. c Outline of the method to identify the sequence of the elongated tRNATyr(GUA). d Schematic of the gene structure, transcription, and post-transcriptional processing of human tRNATyr(GUA). Pol III transcription terminates after producing the oligo(U) stretch. The tRNATyr(GUA) precursor contains the 5′ leader, intron, and 3′ trailer sequences, which are removed by RNase P, the tRNA splicing complex, and RNase Z, respectively, followed by the 3′ terminal CCA addition. e Sanger sequencing results of the elongated tRNATyr(GUA). The upper four clones were analyzed by PCR using a forward primer designed to target the 5′ leader (underlined sequences) and a reverse primer designed against the 3′ adapter. The lower four clones were analyzed by PCR using a forward primer designed to target the 5′ end inside the tRNATyr(GUA) sequence (underlined sequences) and a reverse primer designed against the 3′ adapter. f Northern blot analysis using a probe designed against the tRNATyr(GUA) trailer sequence. Each lane was derived from different cell dishes.
Fig. 7
Fig. 7. Effects of DUS1L overexpression on translation of tyrosine codons and translational readthrough of near-cognate stop codons.
a Effects of DUS1L overexpression on translation of tyrosine codons. Cells were transfected with a codon translation reporter plasmid with a 5′ firefly luciferase sequence and a 3′ renilla luciferase sequence connected via five consecutive TAC, TAT, or random codons (control). Plasmid expression was normalized by dividing renilla luciferase luminescence by firefly luciferase luminescence. Possible renilla-to-firefly luciferase translational bias between control and DUS1L OE cells due to codons in luciferase genes was normalized using the random codon linker control. b Effects of DUS1L overexpression on translational readthrough of UAA and UAG stop codons. Cells were transfected with a stop codon readthrough reporter plasmid with a 5′ renilla luciferase sequence and a 3′ firefly luciferase sequence connected via a TAA codon (or its control TTA codon) or TAG codon (or its control TTG codon). Plasmid expression was normalized by dividing firefly luciferase luminescence by renilla luciferase luminescence. Possible firefly-to-renilla luciferase translational bias due to codons in luciferase genes was normalized using the corresponding TTA/TTG linker control. Means ± s.e.m. from n = 6 samples each. **P < 0.01, *P < 0.05 by the Mann–Whitney test. Exact P-values are included in the Supplementary Data 1.

References

    1. Crick, F. On protein synthesis. Symp. Soc. Exp. Biol.12, 138–163 (1958). - PubMed
    1. Hoagland, M. B., Stephenson, M. L., Scott, J. F., Hecht, L. I. & Zamecnik, P. C. A soluble ribonucleic acid intermediate in protein synthesis. J. Biol. Chem.231, 241–257 (1958). - PubMed
    1. Suzuki, T. The expanding world of tRNA modifications and their disease relevance. Nat. Rev. Mol. Cell Biol.22, 375–392 (2021). - PubMed
    1. Boccaletto, P. et al. MODOMICS: a database of RNA modification pathways. 2021 update. Nucleic Acids Res.50, D231–D235 (2022). - PMC - PubMed
    1. Chujo, T. & Tomizawa, K. Human transfer RNA modopathies: diseases caused by aberrations in transfer RNA modifications. FEBS J.288, 7096–7122 (2021). - PMC - PubMed

LinkOut - more resources