. 2024 Nov;5(11):1607-1621.
doi: 10.1038/s43018-024-00830-0. Epub 2024 Oct 1.

CAR-redirected natural killer T cells demonstrate superior antitumor activity to CAR-T cells through multimodal CD1d-dependent mechanisms

Affiliations

CAR-redirected natural killer T cells demonstrate superior antitumor activity to CAR-T cells through multimodal CD1d-dependent mechanisms

Xin Zhou et al. Nat Cancer. 2024 Nov.

Abstract

Human natural killer T (NKT) cells have been proposed as a promising cell platform for chimeric antigen receptor (CAR) therapy in solid tumors. Here we generated murine CAR-NKT cells and compared them with CAR-T cells in immune-competent mice. Both CAR-NKT cells and CAR-T cells showed similar antitumor effects in vitro, but CAR-NKT cells showed superior antitumor activity in vivo via CD1d-dependent immune responses in the tumor microenvironment. Specifically, we show that CAR-NKT cells eliminate CD1d-expressing M2-like macrophages. In addition, CAR-NKT cells promote epitope spreading and activation of endogenous T cell responses against tumor-associated neoantigens. Finally, we observed that CAR-NKT cells can co-express PD1 and TIM3 and show an exhaustion phenotype in a model of high tumor burden. PD1 blockade as well as vaccination augmented the antitumor activity of CAR-NKT cells. In summary, our results demonstrate the multimodal function of CAR-NKT cells in solid tumors, further supporting the rationale for developing CAR-NKT therapies in the clinic.


Conflict of interest statement

Competing interests: G. Dotti serves in the SAB of Bellicum Pharmaceutical s.p.a., Catamaran Bio, Estella and Ouspecebio. The other authors declare no competing interests.

Figures

Extended Data Figure 1.
Extended Data Figure 1.. B16 tumor model in vitro and in vivo.
(a) Schematic representation of the protocol used to purify, activate, transduce, and expand murine NKTs isolated from the spleen of Vα14-Jα18 transgenic mice. (b-d) Representative flow cytometry plots showing the expression of IFN-γ and granzyme-b (b), IFN-γ and perforin (c) and TRAIL and TNF-α (d) in CAR-NKTs and CAR-Ts when these cells were activated with the CAR.CD19 specific Ab or B16-OVA-hCD19 cells; n = 3. (e) Schematic of the B16-OVA-hCD19 melanoma model in which tumor-bearing mice were lymphodepleted with cyclophosphamide (Cy) and then treated with control NT T cells or CAR.CD19 T cells intravenously (i.v.). (f) Measurement of the tumor volume overtime in the model described in (e). Data are shown as mean ± SD of two independent experiments; n = 8 mice per group; unpaired t-test with Mann-Whitney correction. (g) Summary of the immune infiltration of the B16-OVA-hCD19 tumors at the time of euthanasia at day 32 in mice treated with either NT or CAR-Ts. Tumors were disaggregated to generate single cell suspension and analyzed by flow cytometry gating on CD45+ cells. PMN-MDSCs were identified as CD11b+Ly6G+Ly6Clow, M-MDSCs as CD11b+Ly6GLy6Chigh, and macrophages as CD11b+F4/80+ cells. Data are shown as mean ± SD; n = 7-8; p≥0.05; unpaired two-tailed multiple t-test. (h) Representative immunofluorescence staining of the B16-OVA-hCD19 tumor collected at day 32 showing the presence of F4/80+CD206+ macrophages at the tumor edge indicated in the box; DAPI indicates the nucleus staining; scale bars 1 mm (left) and 100 μm (right); n = 6 from two independent experiments.
Extended Data Figure 2.
Extended Data Figure 2.. CAR-NKTs show superior antitumor effects than CAR-Ts.
(a) Schematic of the syngeneic B16-OVA-hCD19 tumor model with high tumor burden. (b, c) Measurement of tumor volume (b) and body weight overtime (c) in the tumor model described in (a). Data are shown as mean ± SD; n = 5 per group; two-way ANOVA. (d) Schematic of the ID8-mB7-H3 ovarian cancer model. (e) Summary of immune cells collected from the peritoneal lavage in the ID8 model at week 7 after tumor inoculation. Data are shown as mean ± SD; n = 3-5 mice per group; unpaired two-tailed multiple t-test. (f, g) Representative image (f) and tumor metastasis counts (g) in the ID8 model at week 11; n = 3-5 per group; one-way ANOVA. (h) Representative flow cytometry plots illustrating the purity of NKTs isolated from wild-type mice. (i) Expansion of CAR-NKTs from wild-type mice. Data are shown as mean ± SD; n = 3. (j) Representative flow cytometry plots showing the coculture of CAR-NKTs from wild-type mice or Vα14-Jα18 transgenic mice with B16-OVA-hCD19 tumor cells. T cells and NKTs were cocultured with tumor cells at an E: T ratio of 1:1 for 5 days; n = 3. (k) Survival curve of the B16-OVA-hCD19 lung metastatic model treated with CAR-Ts and CAR-NKTs obtained from wild type mice (WT) or Vα14-Jα18 transgenic mice (Tg); n = 3-5 each group; Kaplan-Mayer analysis with log-rank test between CAR-Ts and CAR-NKTs WT or Tg.
Extended Data Figure 3.
Extended Data Figure 3.. Persistence and antitumor effects of CAR-NKTs and CAR-Ts in the B16-OVA-hCD19 model.
(a) Schematic of the B16-OVA-hCD19 melanoma model: tumor-bearing mice (CD45.1 background) were lymphodepleted with cyclophosphamide (Cy) and co-injected intravenously with CAR-Ts (generated from CD45.1.2 mice) and CAR-NKTs (generated from CD45.2 mice) at 1:1 ratio. (b) Representative flow cytometry plots showing CAR-Ts (CD45.1.2) and CAR-NKTs (CD45.2) in tumor and tumor draining lymph nodes by gating on CD45+ cells. (c) Summary of CAR-Ts and NKTs detected at different time points in the model described in (a). Data are shown as mean ± SD; n = 3-4 each time point; unpaired two-tailed multiple t-test. (d, e) Representative hematoxylin & eosin (HE) staining (d) and immunofluorescence analysis (e) to detect cleaved caspase-3 and p-RIP3-dependent cell death in the B16-OVA-hCD19 melanoma model when mice were treated with either CAR-Ts or CAR-NKTs. (f) Summary data of (e). Data are shown as mean ± SD; n = 5; one-way ANOVA.
Extended Data Figure 4.
Extended Data Figure 4.. CAR-NKTs target macrophages.
(a) B16-OVA-hCD19 tumor-bearing mice (CD45.1 background) were lymphodepleted with cyclophosphamide (Cy) and co-injected intravenously with the CAR-Ts (generated from CD45.1.2 mice) and CAR-NKTs (generated from CD45.2 mice) at 1:1 ratio. UMAP plots represent clustering of cells in single RNA sequence data from tumors collected from each group. (b) Schematic of the differentiation of bone marrow derived monocytes (BMDM) to M0, M1-like and M2-like macrophages. (c) Representative flow cytometry plots showing the expression of CD80 (M1-like macrophages), and CD206 (M2-like macrophages) upon specific polarization in vitro for 48 hours gating on the F4/80 positive cells; n = 3. (d) Representative flow cytometry histogram showing the expression of CD1d on M0 (F4/80+CD80CD206), M1-like (F4/80+CD80+) and M2-like (F4/80+CD206+) macrophage; n = 3. (e) Representative flow cytometry plots showing residual macrophages in coculture experiments in which CAR-NKTs and CAR-Ts were cocultured with either M0, or M1-like or M2-like macrophages at an E:T ratio of 1:1 for 5 days. All macrophages were loaded with a-GalCer. At day 5, all cells were collected and analyzed by flow cytometry to quantify macrophages (F4/80+ cells), and NKTs (CD1d-tetramer+ cells), respectively. Double negative cells in CAR-Ts are CD3+ cells; n = 3.
Extended Data Figure 5.
Extended Data Figure 5.. CAR-NKTs decrease TAMs within the TME.
(a) Representative flow cytometry plots showing CD11b+F4/80+ macrophages gating on the CD45+ cells in the B16-OVA-hCD19 model. (b) Summary of CD4, CD8 and macrophages in spleen and bone marrow in the B16-OVA-hCD19 tumor bearing mice treated with either CAR-NKTs or CAR-Ts, and control non transduced cells. (c, d) CD45 immune cell percentages and numbers (c) and percentages of CD4, CD8 and macrophages in spleens and tumors (d) of the B16-OVA-hCD19 tumors collected from mice with high tumor burden and treated with either CAR-NKTs or CAR-Ts or control cells. Data are shown as mean ± SD; n = 5; one-way ANOVA. (e-g) Representative images (e) and quantification (f, g) of the immunofluorescence analysis to detect F4/80+CD206+ macrophages and F4/80+iNOS+ macrophages in the B16-OVA-hCD19 tumor model. Scale bars 100 μm. Each sample was evaluated based at least on 5 slices for the tumor margins or tumor cores, and each group included at least 3 samples. Dara are shown as mean ± SD; two-way ANOVA.
Extended Data Figure 6.
Extended Data Figure 6.. M2-like macrophages show higher CD1d expression in vivo and are targeted by CAR-NKTs.
(a) Representation of the gating strategy of CD4, CD8, CD19, and CD11b-expressing cells in the B16-OVA-hCD19 tumor model. Cell subsets were identified by gating on CD45+ cells. (b, c) Representative (b) and summary (c) of CD1d MFI in cell subsets identified as described in (a). Data are shown as mean ± SD; n = 4; one-way ANOVA. (d) Gating strategy of M1-like macrophages, M2-like macrophages, DCs, and MDSCs by gating on CD45+ cells in the B16-OVA-hCD19 tumor model is represented. (e) CD1d MFI in cell subsets identified as described in (d). Data are shown as mean ± SD; n = 12; one-way ANOVA. (f) Representative images of tumors collected at day 35 in the B16-OVA-hCD19 melanoma model in CD1d KO mice treated with CAR-Ts or CAR-NKTs. (g) Body weight of the mice in the tumor model illustrated in (f). Data as mean ± SD of two independent experiments; n = 8 mice per group; p≥0.05; two-way ANOVA. (h, i) Percentages of CD11b+F4/80+ macrophages (h) and F4/80+CD206+ macrophages (i) in the B16-OVA-hCD19 tumor-bearing CD1d KO mice treated with either CAR-NKTs or CAR-Ts and control cells; data as mean ± SD; n = 4-7 mice per group; p≥0.05; one-way ANOVA.
Extended Data Figure 7.
Extended Data Figure 7.. CAR-NKTs partially control the tumor growth in the B16-hCD19 tumor model.
(a) Schematic of the B16-hCD19 tumor model in which tumor-bearing mice were infused with either CAR-Ts or CAR-NKTs after conditioning with cyclophosphamide (Cy). Control non-transduced T cells (NT) and NKTs were used as controls. (b-d) Representative images of the tumors collected at day 24 (b), measurement of tumor volumes (c), and body weight (d) of the mice of the model described in (a). Data are shown as the mean ± SD; n = 5 mice per group; two-way ANOVA.
Extended Data Figure 8.
Extended Data Figure 8.. CAR-NKTs promote DC activation and T cell responses.
(a-d) Representative (a, c) and summary (b, d) of CD80+CD11c+ and CD103+CD11c+ cells in the lymph nodes gating on CD45+ cells on day 10 after CAR-T or CAR-NKT infusions. Data are shown as the mean ± SD; n = 5; one-way ANOVA. (e, f) Representative (e) and summary (f) of OVA-special T cells gating on tumor-infiltrated CD8 T cells in the CD1d KO model. Data are shown as the mean ± SD; n = 6-10; p≥0.05.
Extended Data Figure 9.
Extended Data Figure 9.. CAR-NKTs target the MC38-hCD19 and MC38-mB7-H3 cell lines in vitro.
(a) Representative flow cytometry histogram showing the expression of hCD19 in MC38 cells genetically engineered to express hCD19. Pink histograms illustrate control cells. (b, c) Representative flow cytometry plots (b) and summary (c) showing coculture experiments in which CAR-NKTs or CAR-Ts were cultured with MC38-hCD19 tumor cells at an E:T ratio of 1:1 for 5 days. At day 5, all cells were collected and analyzed by flow cytometry to quantify tumor cells (hCD19+) and T/NKTs (CD3+), respectively. Data are shown as mean ± SD; n = 3; one-way ANOVA. NT-NKTs and T cells were used as negative control. (d) IFN-γ was detected by ELISA in the coculture supernatant of CAR-NKTs or CAR-Ts with MC38-hCD19 of the experiments described in (b) after 24 hrs. Data are shown as mean ± SD; n = 3; one-way ANOVA. (e) Representative flow cytometry histograms showing the expression of murine mB7-H3 in MC38 cells (MC38-mB7-H3) genetically engineered to express mB7-H3. Pink histograms illustrate control cells. (f) Representative flow cytometry plots illustrating the expression of the CAR.B7-H3 in CAR-NKTs and CAR-Ts. Pink histograms illustrate control cells; n = 3. (g, h) Representative flow cytometry plots (g) and summary (h) showing coculture experiments in which CAR-NKTs or CAR-Ts were cultured with MC38-mB7H3 tumor cells at an E:T ratio of 1:1 for 5 days. At day 5, all cells were collected and analyzed by flow cytometry to quantify tumor cells (B7-H3+) and T/NKTs (CD3+), respectively. Data are shown as mean ± SD; n = 3; one-way ANOVA. NT-NKTs and T cells were used as negative control. (i) IFN-γ was detected by ELISA in the coculture supernatant of CAR-NKTs or CAR-Ts with MC38-mB7H3 of the experiments described in (g) after 24 hrs. Data are shown as mean ± SD; n = 3; one-way ANOVA.
Extended Data Figure 10.
Extended Data Figure 10.. CAR-NKTs promote T cell responses to neoantigens in the BBN996 bladder tumor model.
(a) Representative flow cytometry plots showing the expression of hCD19 on BBN963 cell line. Pink histograms illustrate control cells. (b, c) Representative flow cytometry plots (b) and summary (c) showing coculture of CAR-NKTs or CAR-Ts with BBN963-hCD19 tumor cells. T/NKTs were cocultured with tumor cells at an E:T ratio of 1:1 for 5 days. On day 5, all cells were collected and analyzed by flow cytometry to quantify tumor cells (hCD19+) and T/NKTs (CD3+), respectively; n = 3; one-way ANOVA. (d) IFN-γ was detected by ELISA in the coculture supernatant of CAR-NKTs or CAR-Ts with BBN963-hCD19 after 24 hrs. Data are shown as the mean ± SD; n = 3; one-way ANOVA. (e) Schematic of the BBN963-hCD19 bladder tumor model. (f, g) Representative image of tumor (f), measurement of tumor volume (g) after tumor engraftment and CAR-T or CAR-NKT administration in the model described in (e). Data are shown as the mean ± SD; n = 5 mice per group; two-way ANOVA. (h) Survival curve of the BBN963-hCD19 model described in (e); n = 5 per group; Kaplan-Mayer analysis with log-rank test. (i, j) Summary of BBN963 neoantigen specific T cells (h) and NKs (i) in the tumor model described in (e); one-way ANOVA.
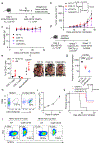
Fig. 1.
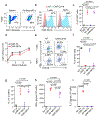
Fig. 1.. CAR-NKTs target tumor cells in vitro.
(a) Representative flow cytometry plots illustrating the purity of NKTs isolated from the spleen of iVα14-Jα18 transgenic mice, n=12 with similar results. (b, c) Representative flow cytometry histograms (b) and summary data (c) illustrating CAR.CD19 expression in NKTs and T cells; n = 4 mice; ordinary one-way ANOVA. (d) Expansion in vitro of CAR-NKTs and CAR-Ts; n = 3 mice; p≥0.05 by unpaired two-tailed multiple t-test. (e-g) Representative flow cytometry plots (e) and summary results (f, g) showing the coculture of CAR-NKTs or CAR-Ts with B16-OVA-hCD19 tumor cells. T cells and NKTs were cocultured with tumor cells at an E:T ratio of 1:1 for 5 days. On day 5, all cells were collected and analyzed by flow cytometry to quantify tumor cells (hCD19+), and T/NKTs (CD3+), respectively; n = 4 mice, ordinary one-way ANOVA. (h, i) IFN-γ (h) and IL-2 (i) detection in coculture supernatants (24 hrs) of coculture experiments described in (e); n = 4 mice; ordinary one-way ANOVA. In this figure, data are shown as mean ± SD.
Fig. 2.
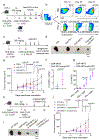
Fig. 2.. CAR-NKTs show superior antitumor activity than CAR-Ts in vivo.
(a) Schematic of the syngeneic B16-OVA-hCD19 melanoma model in which tumor-bearing mice are infused with either CAR.CD19 T cells or CAR.CD19 NKTs after conditioning with cyclophosphamide (Cy). Non transduced T cells (NT) and NKTs were used as controls. (b-d) Representative image of tumors collected at day 32 (b), measurement of tumor volume (c) and body weight overtime (d) in the tumor model described in (a). Data are shown from 10 mice per group pooling from two independent experiments; two-way ANOVA. (e) Survival curve of the B16-OVA-hCD19 model described in (a); n = 7 mice per group; Kaplan-Mayer analysis with log-rank test. (f) Schematic of the B16-OVA-hCD19 lung metastatic model. In this model, mice were euthanized as per veterinarian indication based on pulmonary distress. (g) Representative hematoxylin & eosin (HE) staining (left) and tSNE plot showing the immune infiltration of the B16-OVA-hCD19 lung metastases at day 21. Tumors were disaggregated to generate single-cell suspension and analyzed by flow cytometry gating on CD45+ cells; n = 5 tumors from 5 different mice. (h) Survival curve of B16-OVA-hCD19 lung metastatic model described in (f); n = 5 mice for each group; Kaplan-Mayer analysis with log-rank test. In this figure, data are shown as mean ± SD.
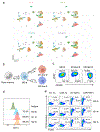
Fig. 3.
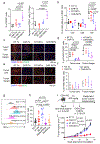
Fig. 3.. CAR-NKTs modulate the TME and target macrophages in vitro.
Non-transduced T/NKT cells (NT), CAR.CD19 T cells, and CAR.CD19 NKTs were administered to B16-OVA-hCD19 tumor-bearing mice, and after 16 days CD45+ cells were sorted from tumors for single-cell RNA-seq analysis. (a) UMAP plot of cells profiled from all four groups; clusters are annotated based on expression patterns of characteristic genes. (b) Composition of each cluster from (a). (c) Differential gene expression analysis indicating upregulated genes in each cluster. The color of highlighted genes corresponds to cluster identity color. Key delineating genes or functional genes are highlighted. (d) Summary flow cytometry showing the percentages of residual macrophages in coculture experiments in which CAR.CD19 NKTs and CAR.CD19 T cells were cultured with either M0, M1-like, or M2-like macrophages at an E:T ratio of 1:1 for 5 days. All macrophages were loaded with α-GalCer overnight; n = 3 mice; two-way ANOVA. NT and NKTs were used as controls. (e) Detection of IFN-γ in the supernatant of coculture experiments described in (d). Data are shown as the mean ± SD; n = 3 mice; two-way ANOVA. In this figure, data are shown as mean ± SD.
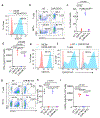
Fig. 4.
Fig. 4.. CAR-NKTs decrease TAMs within the TME.
Non-transduced T cells (NT) and NKTs, CAR.CD19 T cells, and CAR.CD19 NKTs were administered to B16-OVA-hCD19 tumor-bearing mice. (a) CD45 immune cells percentages (left panel) and numbers (right panel) within the B16-OVA-hCD19 tumors collected from mice treated with either CAR-NKTs or CAR-Ts and control NT or NKTs; n = 5 mice; ordinary one-way ANOVA. (b) Percentages of macrophages (CD11b+F4/80+), CD4 and CD8 T cells gated on the CD45+ cells in the B16-OVA-hCD19 tumors; n = 5 mice; two-way ANOVA. (c-f) Representative images and quantification of the immunofluorescence analysis to detect M2 like-macrophages (F4/80+CD206+) (c, d) and M1-like macrophages (F4/80+iNOS+) (e, f) within the tumor core or at the tumor margins. Scale bars: 100 μm; n = 4 tumors from 4 mice; two-way ANOVA. (g) Representative histograms showing CD1d expression in the cell subsets identified in B16-OVA-hCD19 tumors, n = 12 mice with similar results. (h) Summary of CD1d+ cells in the cell subsets identified in (g); n = 12 mice; two-way ANOVA. (i) Schematic of the syngeneic B16-OVA-hCD19 melanoma model in CD1d KO mice treated with CAR.CD19 T cells or CAR.CD19 NKTs. (j) Measurement of tumor volume over time in the tumor model illustrated in (i). Data are shown of 8 mice per group; two-way ANOVA. In this figure, data are shown as mean ± SD.
Fig. 5.
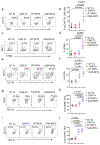
Fig. 5.. CAR-NKTs promote T cell responses by enhancing DC activation.
Non-transduced T cells (NT) and NKTs, CAR.CD19 T cells, and CAR.CD19 NKTs were administered to B16-OVA-hCD19 tumor-bearing mice. (a, b) Representative (a) and summary (b) of OVA-special CD8 T cells gated on the CD8 T cells detected within B16-OVA-hCD19 tumors collected from mice treated with CAR-NKTs or CAR-Ts or control NT and NKTs on day 28; n = 5 mice; ordinary one-way ANOVA. (c, d) Representative plots (c) and summary (d) of NKs infiltrating tumors on day 28; n = 5 mice; ordinary one-way ANOVA. (e-j) DC counts gating on CD45+ cells (e, f) and CD80 (g, h) or CD103 (i, j) expression on DCs were tested on day 10 post-CAR T/NKT injection; n = 5 mice; ordinary one-way ANOVA. In this figure, data are shown as mean ± SD.
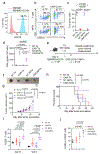
Fig. 6.
Fig. 6.. CAR-NKTs promote T cell responses against neoantigen in the MC38 tumor model.
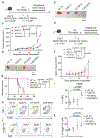
(a) Schematic of the MC38-hCD19 tumor model in which tumor-bearing mice were lymphodepleted with Cy and then treated with CAR.CD19 T or CAR.CD19 NKTs. Non-transduced T cells (NT) and NKTs were used as negative controls. (b, c) Representative images of the tumors collected on day 35 (b), and measurement of the tumor volumes over time (c) of the tumor model described in (a). Data are from n = 5 mice per group; two-way ANOVA. (d) Schematic of the syngeneic MC38-mB7-H3 tumor model in which tumor-bearing mice were lymphodepleted with Cy and then treated with CAR.B7-H3 T or CAR.B7-H3 NKTs. Non transduced T cells and NKTs were used as negative controls. (e, f) Representative images of tumors collected on day 35 (e), measurement of tumor volumes overtime (f); n = 5 mice per group; two-way ANOVA. (g) The survival curve of the tumor model described in (d); n = 5 mice per group; Kaplan-Mayer analysis with log-rank test. (h, i) Representative flow cytometry plots (h) and summary (i) showing the percentage of NKs detected at day 32 in tumors of the model described in (d); n = 5 mice per group; ordinary one-way ANOVA. (j, k) Representative flow cytometry plots (j) and summary (k) showing the percentage of Adpgk-Tetramer+ CD8 T cells detected within the tumor at day 32; n = 5 mice; ordinary one-way ANOVA. In this figure, data are shown as mean ± SD.
Fig. 7.
Fig. 7.. Anti-PD1 therapy and vaccination enhance the antitumor ability of CAR-NKTs in a high tumor burden model.
(a) Schematic of the B16-OVA-hCD19 melanoma in the CD45.1 model with CAR.CD19 NKTs generated from CD45.2 mice. (b) Representative flow plot of PD1/TIM3 or IFN-γ/GrB expression on CD45.2 gated NKTs; n = 2 mice at each time point with similar results. (c) Schematic of the B16-OVA-hCD19 melanoma model treated with CAR-NKTs, anti-PD1 Ab or combo. (d, e) Representative images of tumors (d), measurement of tumor volumes (e) after tumor engraftment and CAR-NKTs, anti-PD1 Ab or combo administration in the model described in (c); n = 5 mice per group; two-way ANOVA. (f) Quantification of CAR-NKTs (CD1d tetramer+/TCRβ+) in the tumor after engraftment and treatment with CAR-NKTs or combo in the model described in (c) at day 28; n = 5 mice per group; unpaired two-tailed t-test. (g) IFN-γ and GrB expression in CAR-NKTs at day 28 in the model described in (c); n = 5 mice per group; two-way ANOVA. (h) Schematic of the B16-OVA-hCD19 tumor model in which in addition to CAR-NKT treatment, mice were vaccinated with either α-GalCer-MSVs or α-GalCer-DCs. (i, j) Representative image of the tumor (i) and tumor growth (j) of the model described in (h); n = 5 mice per group; two-way ANOVA. In this figure, data are shown as mean ± SD.

References

    1. Czapiewski P et al. BCL3 expression is strongly associated with the occurrence of breast cancer relapse under tamoxifen treatment in a retrospective cohort study. Virchows Archiv : an international journal of pathology 480, 529–541, doi:10.1007/s00428-021-03238-8 (2022). - DOI - PMC - PubMed
    1. Fuca G, Reppel L, Landoni E, Savoldo B & Dotti G Enhancing Chimeric Antigen Receptor T cell Efficacy in Solid Tumors. Clinical cancer research : an official journal of the American Association for Cancer Research, doi:10.1158/1078-0432.ccr-19-1835 (2020). - DOI - PMC - PubMed
    1. Flugel CL et al. Overcoming on-target, off-tumour toxicity of CAR T cell therapy for solid tumours. Nature Reviews Clinical Oncology 20, 49–62, doi:10.1038/s41571-022-00704-3 (2023). - DOI - PMC - PubMed
    1. Milone MC et al. Engineering enhanced CAR T-cells for improved cancer therapy. Nature cancer 2, 780–793, doi:10.1038/s43018-021-00241-5 (2021). - DOI - PMC - PubMed
    1. Rafiq S, Hackett CS & Brentjens RJ Engineering strategies to overcome the current roadblocks in CAR T cell therapy. Nature reviews. Clinical oncology 17, 147–167, doi:10.1038/s41571-019-0297-y (2020). - DOI - PMC - PubMed

Methods-only references

    1. Wang G et al. Fully human antibody V(H) domains to generate mono and bispecific CAR to target solid tumors. Journal for immunotherapy of cancer 9, doi:10.1136/jitc-2020-002173 (2021). - DOI - PMC - PubMed
    1. Delfanti G, Perini A, Zappa E & Fedeli M Purification and Expansion of Mouse Invariant Natural Killer T Cells for in vitro and in vivo Studies. Journal of visualized experiments : JoVE, doi:10.3791/62214 (2021). - DOI - PubMed
    1. Hirabayashi K et al. Dual-targeting CAR-T cells with optimal co-stimulation and metabolic fitness enhance antitumor activity and prevent escape in solid tumors. Nature Cancer 2, 904–918, doi:10.1038/s43018-021-00244-2 (2021). - DOI - PMC - PubMed
    1. Zhou X et al. YAP aggravates inflammatory bowel disease by regulating M1/M2 macrophage polarization and gut microbial homeostasis. Cell Reports 27, 1176–1189 (2019). - PubMed
    1. Ma X et al. Interleukin-23 engineering improves CAR T cell function in solid tumors. Nature biotechnology 38, 448–459, doi:10.1038/s41587-019-0398-2 (2020). - DOI - PMC - PubMed

MeSH terms

Substances

LinkOut - more resources