

doi: 10.1038/s41594-024-01394-4.
Epub 2024 Oct 1.
Structure of Fanzor2 reveals insights into the evolution of the TnpB superfamily
Affiliations
- PMID: 39354233
- PMCID: PMC11832414
- DOI: 10.1038/s41594-024-01394-4
Item in Clipboard
Structure of Fanzor2 reveals insights into the evolution of the TnpB superfamily
Nat Struct Mol Biol.
2025 Feb.
Abstract
RNA-guided endonucleases, once thought to be exclusive to prokaryotes, have been recently identified in eukaryotes and are called Fanzors. They are classified into two clades, Fanzor1 and Fanzor2. Here we present the cryo-electron microscopy structure of Acanthamoeba polyphaga mimivirus Fanzor2, revealing its ωRNA architecture, active site and features involved in transposon-adjacent motif recognition. A comparison to Fanzor1 and TnpB structures highlights divergent evolutionary paths, advancing our understanding of RNA-guided endonucleases.
© 2024. The Author(s).
Conflict of interest statement
Competing interests: The authors declare no competing interests.
Figures

a, Diagram showing target DNA substrate (bottom) annealed to ωRNA (top). Nucleotides not observed in the cryo-EM structure are light gray. The gRNA is pink and the TAM is purple. On the DNA molecule, TS marks the target strand and NTS marks the nontarget strand. b, Top: domain organization of ApmFz2, with domain boundaries indicated by residue numbers. NTD, white; REC, aqua; WED, orange-yellow; RuvC, green; ZnF, pink. Bottom: detailed annotation of the NTD. The NLS was not observed in the cryo-EM map. The RuvC-R (blue-green) and thumb (blue) regions structurally reinforce the RuvC and REC domains, respectively. Gray boxes indicate linker regions not specifically assigned to a domain. c, Cryo-EM reconstruction (top) and atomic model (bottom) of ApmFz2 ternary complex. Domains and nucleic acid molecules are the same colors as in a,b, except for ωRNA, which is shown in white. Insets in d,e are boxed and labeled. d, Close-up view of the thumb domain associated with target DNA in conjunction with the WED and REC domains. A transparent surface is overlaid on the atomic model and the thumb domain is colored according to its electrostatic potential, with blue indicating a highly basic surface. e, View of the active site bound to the precleaved target DNA substrate. The catalytic triad is shown as green sticks and the magnesium ion is shown as a green sphere.
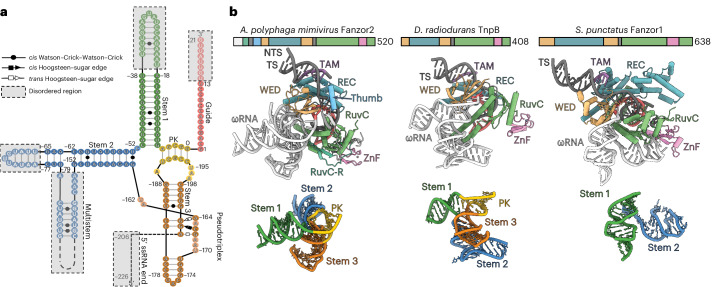
a, A 2D schematic of ωRNA, showing Watson–Crick base pairing (solid lines) and noncanonical interactions. The ωRNA scaffold and guide region span nucleotides −205 to 0 and 1 to 21, respectively. PK, pseudoknot. Disordered regions are in a dashed gray box. b, Comparison of protein and ωRNA structural features across known TnpB ternary complex structures: ApmFz2 (this study), Deinococcus radiodurans TnpB (PDB 8H1J ) and Sphenodon punctatus Fanzor1 (PDB 8GKH ). Top: protein domain diagram, with domains colored as in Fig. 1a. Middle: RNP complex structure. The ωRNA is colored white. Bottom: the ωRNA structure, with structural features colored as in a, shown in the same view as in the ternary structure (middle row).

a. Biochemical validation of Fanzor2 (Fz2) cleavage activity tested on a linear DNA substrate containing a 5’-GGG TAM with either a correct target spacer (T) or a scrambled spacer (S) (n = 3). Red arrowheads indicate cleavage product. b. Representative cryo-EM micrograph from reconstituted ApmFz2 ternary complex (n = 3,205). Yellow circles indicate contaminates. Scale bar, 100 nm. c. 2D classification in cryoSPARC 4.4.0 on template-picked particles. Scale bar, 20 nm d. Image processing workflow used to analyze the cryo-EM data. e. Fourier shell correlation (FSC) curve. Resolution is reported at the 0.143 cut-off (solid blue line). f. Final ApmFz2 ternary complex refined reconstruction (right) and local resolution filtered reconstruction (left). Colors indicate the local resolution range, from 2.3 Å to 5.8 Å. Source data

Sequence alignment includes comparison to Fanzor I (PDB 8GKH) and TnpB (PDB 8H1J). Domains are annotated according to ApmFz2 and labeled according to the convention used in Fig. 1. Red arrowheads indicate conserved catalytic triad positions, orange arrowheads indicate catalytic glutamate for TnpB and for Fanzor2, as this position is not conserved among homologs.

a-b. Unique N-terminal extension in ApmFz2 contacting protein functional domains. ApmFz2 domains colored individually (a) or with only N-terminal extension colored in orange (b). Unstructured nuclear-localization signal (NLS) is shown as an orange dotted line. c. Comparison of ApmFz2 and TnpB RuvC domain. RuvC-R domain binds to the canonical RuvC domain. Rotation relative to a is indicated. d. Comparison of ApmFz2 and TnpB linker domain that connects the Rec and Nuc lobes. The N-terminal extension in ApmFz2 forms a short β−sheet with the linker domain. e. Thumb domain forms hydrogen bonds with target strand within and downstream of TAM duplex. Electrostatic interactions are represented as dashed cyan lines.

a. Schematic representation of DNA substrate recognition by AmpFz2 including TAM duplex, non-target strand, target strand, and a four-nucleotide single-stranded DNA within the active site. b. Atomic model of ApmFz2 recognition of TAM duplex and upstream DNA substrate. TAM duplex is bound in the groove formed by WED and REC. c. Recognition of 5’-GGG-3’ TAM by the REC domain. d. Recognition of TAM duplex and upstream nucleotides by WED domain. In c,d, rotation relative to b is indicated in the bottom right corner. e. Atomic model of DNA-RNA heteroduplex recognition by RuvC. f. Recognition of heteroduplex target-strand by RuvC. g. Recognition of heteroduplex guide-RNA by RuvC. In f-g, rotation relative to e is indicated in the bottom right corner. In b-g, hydrogen bond interactions are represented by cyan dashed lines.

Structural comparison of active sites of ApmFz2 (top left), SpuFz1 (bottom left) and TnpB structures (right top and bottom). PDB IDs are indicated. Dashed lines represent missing sections in structure. DNA is shown as gray sticks, catalytic residues in stick representation, Mg2+ as green spheres. The zinc finger (ZnF) domain is pink, with the zinc ion shown as gray sphere.

a. Cryo-EM density (transparent surface) is shown for select regions of the map. The atomic model is docked and colored as defined in Fig. 1. Catalytic residues are shown in stick representation, with distances to the Mg2+ within active site indicated (green dashed lines). Red arrowhead indicates expected cleavage location. Cryo-EM density for DNA-RNA heteroduplex (b) and pseudoknot (c).

Structural comparison between Fanzor2 catalytic site and canonical catalytic site (Cas12j, PDB 7LYT). Filled and open triangles indicate canonical and non-canonical catalytic residue position, respectively.

a. Recognition of ωRNA by the ApmFz2 protein using the WED, RuvC and RuvC-R domains. Panels b-e display hydrogen bonding (dotted cyan lines) to ωRNA backbone or bases. The pseudoknot (PK) is recognized by the WED domain (b) and by RuvC and RuvC-R (c). Recognition of Stem2 (d) and Stem3 (e) by RuvC. Rotations relative to a are indicated in c,d.

a. Atomic model of ωRNA scaffold (including nucleotides -205 to -152, -79 to -77, -65 to -38, -18 to 13). Black dashed curve represents unresolved multi-stem branching from Stem2. b-c. Structure of predicted full-length ωRNA (top) and observed ωRNA (bottom). Only ωRNA is shown in b, whereas protein and ωRNA are shown in c. The predicted ωRNA structure was generated by docking RNAcomposer predictions of the individual RNA stem loops onto the final cryo-EM model. Disordered regions are displayed in a dashed grey box. Rotations relative to a (top) are indicated. Top and bottom panels in b and c depict the same viewing direction.

Comparison between TnpB and Fanzor variant predicted and experimentally determined ωRNA shown in a two-dimensional representation. RNA elements colored relative to Fig. 2.
References
MeSH terms
Substances
Grants and funding
LinkOut - more resources
Full Text Sources
