. 2024 Oct 1;29(1):128.
doi: 10.1186/s11658-024-00645-y.

Endometrial regeneration cell-derived exosomes loaded with siSLAMF6 inhibit cardiac allograft rejection through the suppression of desialylation modification

Affiliations

Endometrial regeneration cell-derived exosomes loaded with siSLAMF6 inhibit cardiac allograft rejection through the suppression of desialylation modification

Yini Xu et al. Cell Mol Biol Lett. .

Abstract

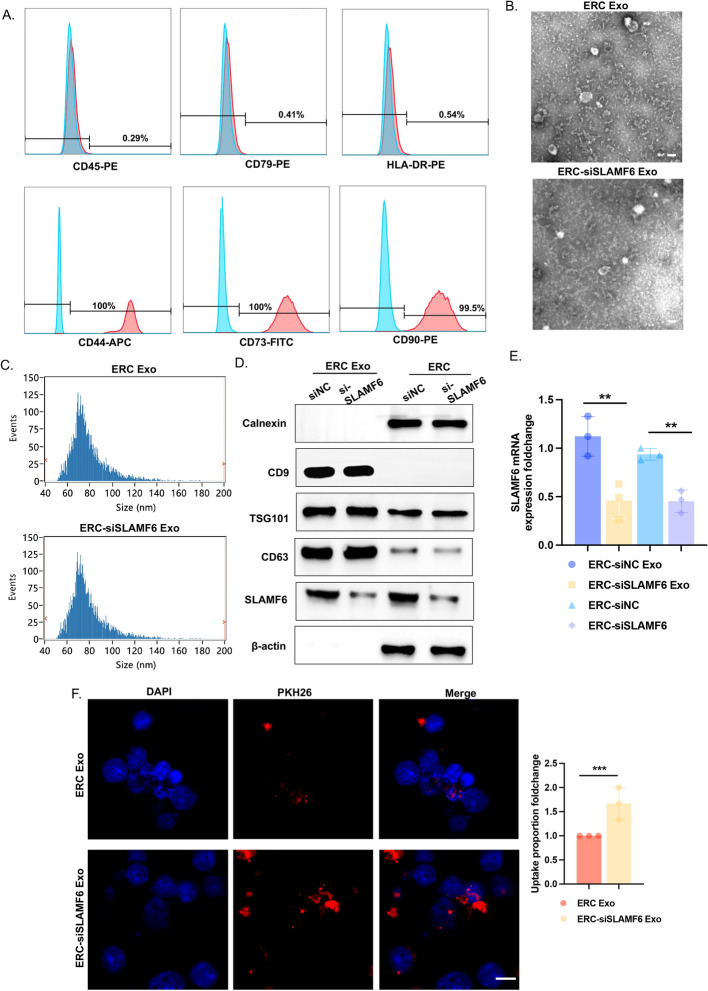
Backgrounds: Acute transplant rejection is a major component of poor prognoses for organ transplantation. Owing to the multiple complex mechanisms involved, new treatments are still under exploration. Endometrial regenerative cells (ERCs) have been widely used in various refractory immune-related diseases, but the role of ERC-derived exosomes (ERC-Exos) in alleviating transplant rejection has not been extensively studied. Signaling lymphocyte activation molecule family 6 (SLAMF6) plays an important role in regulating immune responses. In this study, we explored the main mechanism by which ERC-Exos loaded with siSLAMF6 can alleviate allogeneic transplant rejection.

Methods: C57BL/6 mouse recipients of BALB/c mouse kidney transplants were randomly divided into four groups and treated with exosomes. The graft pathology was evaluated by H&E staining. Splenic and transplanted heart immune cell populations were analyzed by flow cytometry. Recipient serum cytokine profiles were determined by enzyme-linked immunosorbent assay (ELISA). The proliferation and differentiation capacity of CD4+ T cell populations were evaluated in vitro. The α-2,6-sialylation levels in the CD4+ T cells were determined by SNA blotting.

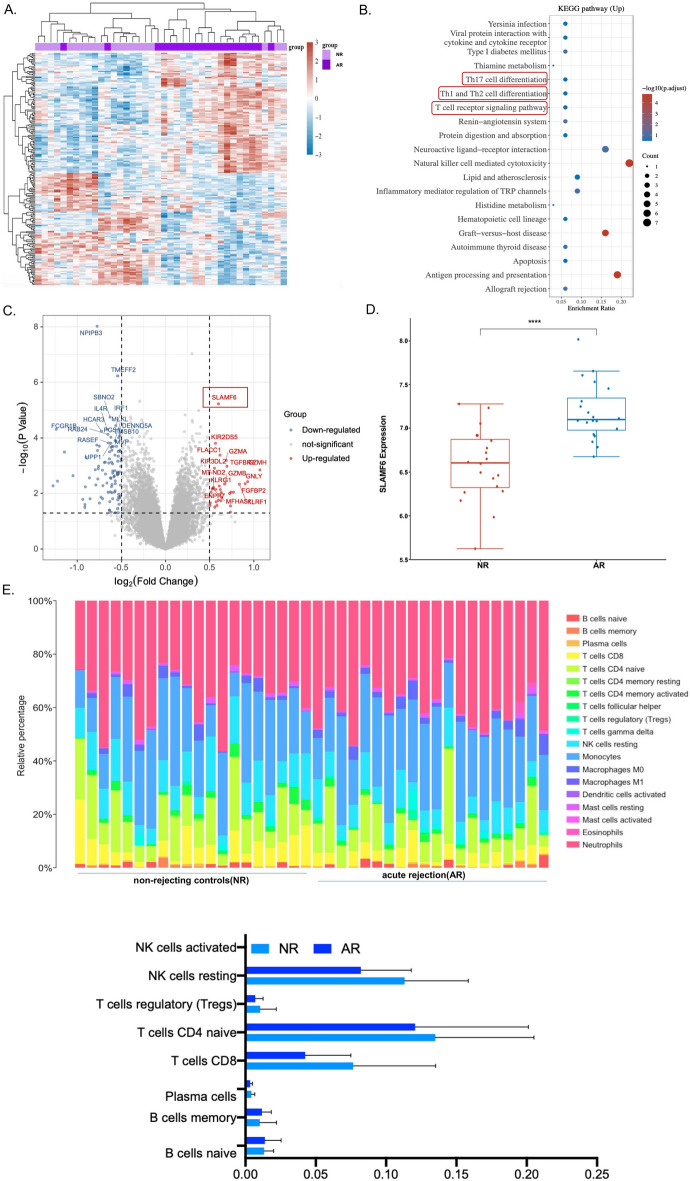
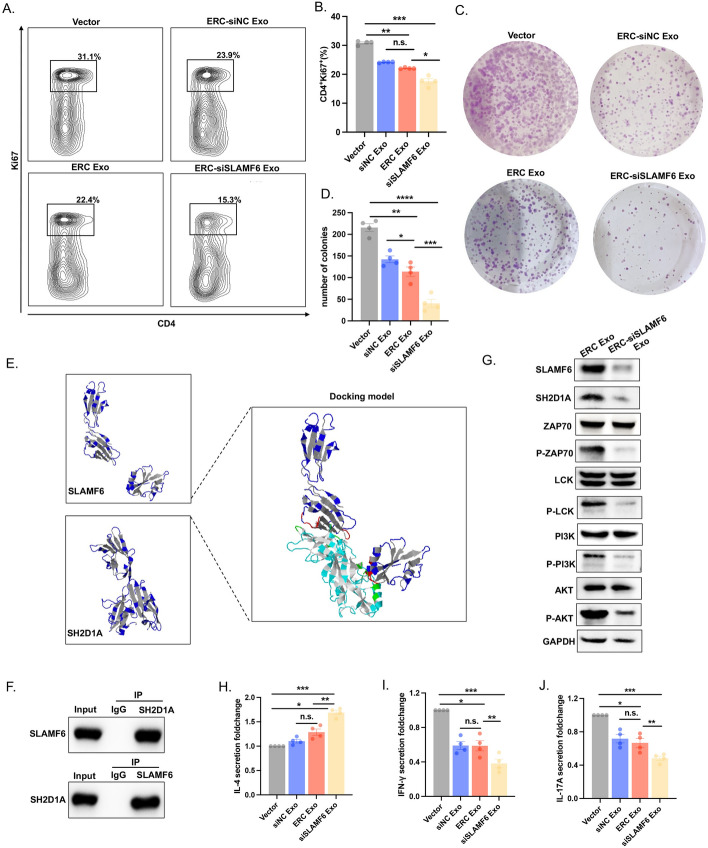
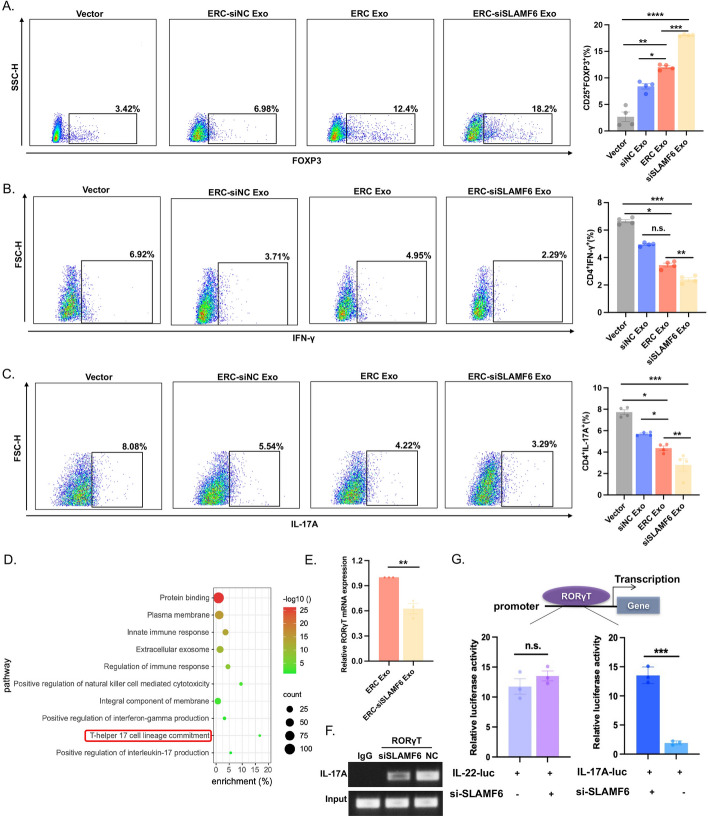
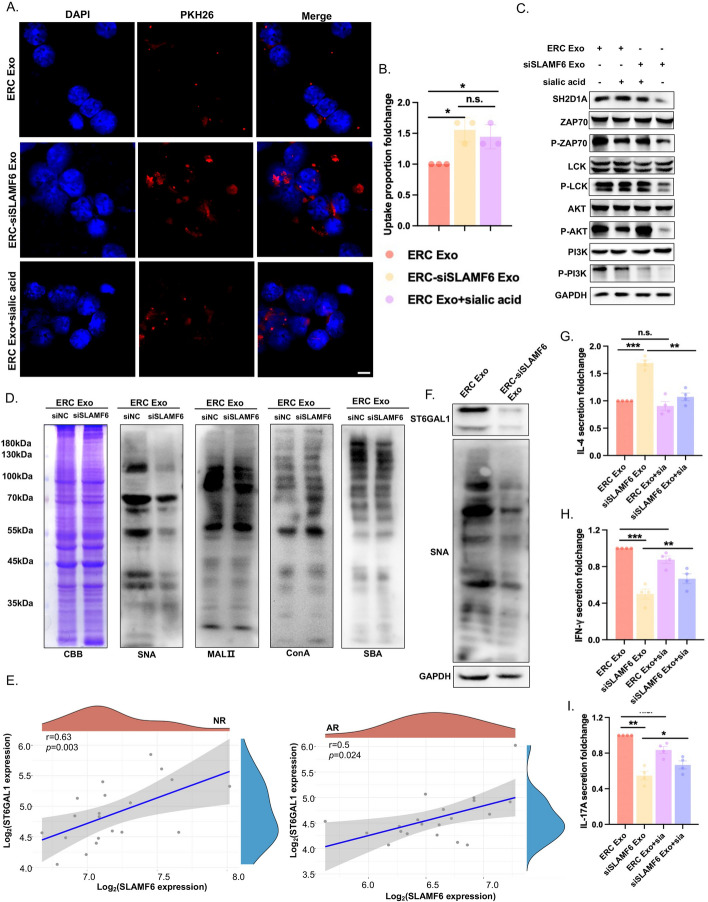
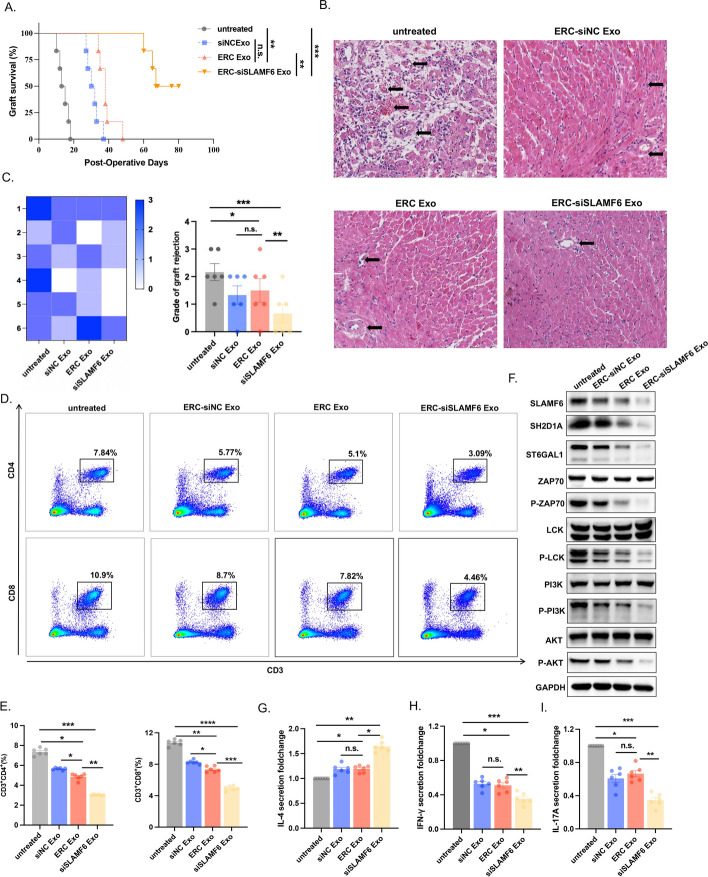
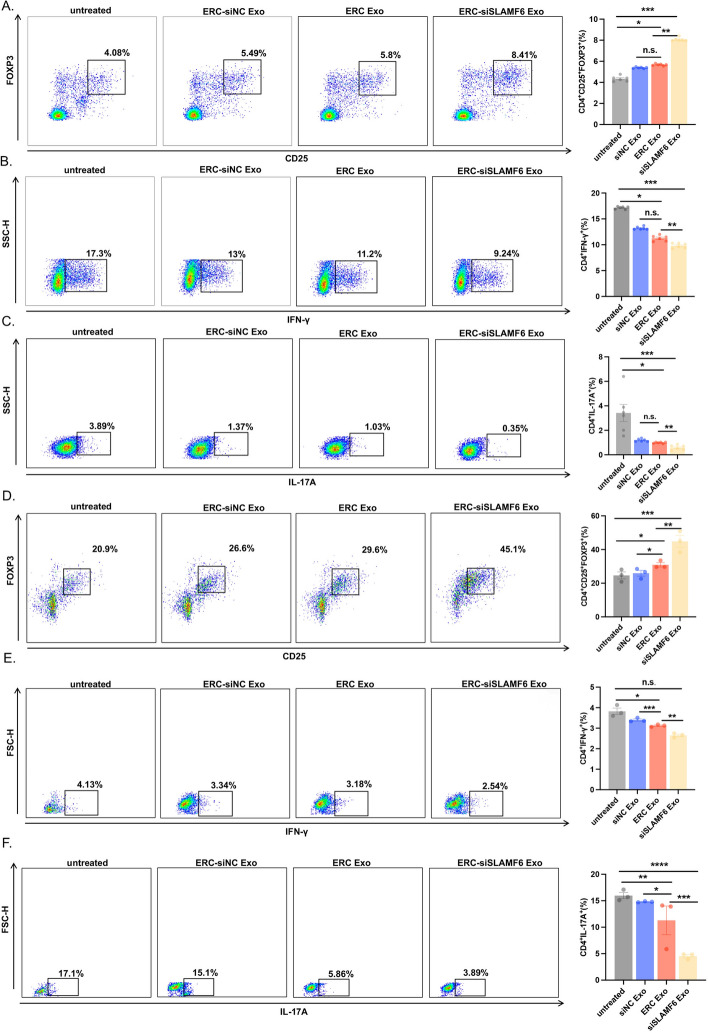
Results: In vivo, mice treated with ERC-siSLAMF6 Exo achieved significantly prolonged allograft survival. The serum cytokine profiles of the recipients were significantly altered in the ERC-siSLAMF6 Exo-treated recipients. In vitro, we found that ERC-siSLAMF6-Exo considerably downregulated α-2,6-sialyltransferase (ST6GAL1) expression in CD4+ T cells, and significantly reduced α-2,6-sialylation levels. Through desialylation, ERC-siSLAMF6 Exo therapy significantly decreased CD4+ T cell proliferation and inhibited CD4+ T cell differentiation into Th1 and Th17 cells while promoting regulatory T cell (Treg) differentiation.

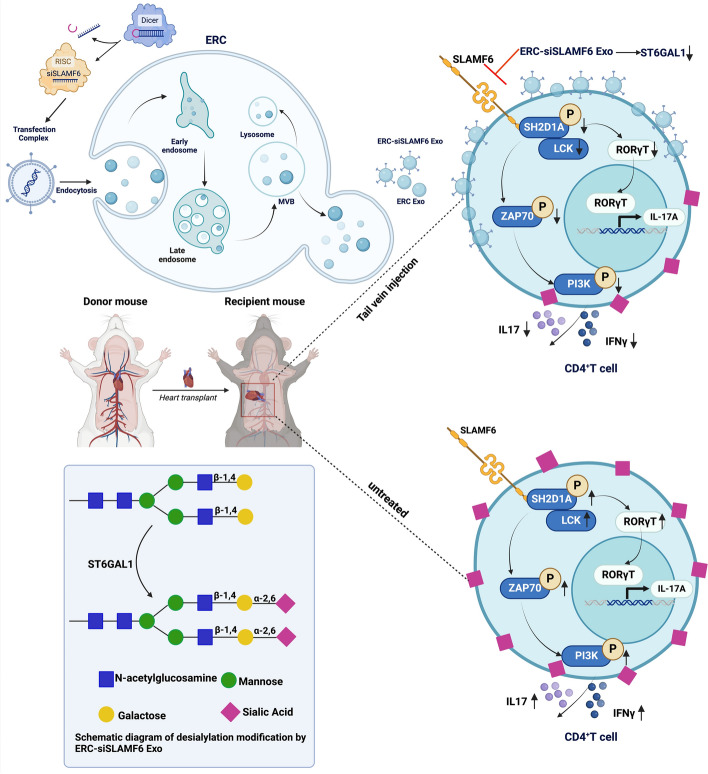
Conclusions: Our study indicated that ERC-Exos loaded with siSLAMF6 reduce the amount of sialic acid connected to α-2,6 at the end of the N-glycan chain on the CD4+ T cell surface, increase the number of therapeutic exosomes endocytosed into CD4+ T cells, and inhibit the activation of T cell receptor signaling pathways, which prolongs allograft survival. This study confirms the feasibility of using ERC-Exos as natural carriers combined with gene therapy, which could be used as a potential therapeutic strategy to alleviate allograft rejection.

Keywords: Cardiac allograft rejection; Desialylation; Endometrial regeneration cell-derived exosome; Modification; Signaling lymphocyte activation molecule family 6 (SLAMF6).


Conflict of interest statement

The authors declare that they have no potential financial conflicts of interest related to this manuscript. None of the material in this paper has been published or is under consideration for publication elsewhere.

Figures

Fig. 1
Fig. 1
The GEO database was used to investigate the expression characteristics of acute transplant rejection. A Differential gene expression heat map, in which different colors represent trends in gene expression for different tissues. This graph displays the top 50 upregulated genes and the top 50 downregulated genes. Each column on the horizontal axis represents a sample, light purple represents patients in the NR group, and dark purple represents patients in the AR group. The vertical axis on the left cluster different genes. The color scale changes on the right represent the level of differential gene expression; red indicates upregulation, and blue indicates downregulation. B KEGG pathway analysis revealed the top 20 pathways associated with the DEGs. The x-axis denotes the degree of pathway enrichment, whereas the y-axis represents the functional pathways. The color of the bubbles indicates the significance of the enrichment, and the size of the bubbles corresponds to the number of genes significantly enriched in the respective pathways. C A volcano plot was constructed using the fold change values and P values. Red dots indicate upregulated genes and blue dots indicate downregulated genes. D Distribution of SLAMF6 expression in different groups. The abscissa represents several groups of samples, while the ordinate indicates the gene expression distribution; different colors denote various groups (acute rejection versus nonrejecting controls, P < 0.0001). The Wilcoxon test was used to evaluate the significant differences between the two groups. E The proportions of infiltrating immune cells in the acute rejection and nonrejection groups were compared on the basis of CIBERSORT. The fraction of cells is shown on the ordinate, whereas each sample in different groups is shown on the abscissa. The statistics for visualization are provided below
Fig. 2
Fig. 2
Establishment and characterization of ERC-derived exosomes loaded with siSLAMF6. A Flow cytometry was used to identify the expression of the positive markers CD44, CD73, and CD90 and the negative markers CD45, CD79, and HLA-DR on the surface of the ERC cells. B Transmission electron microscopy (TEM) confirmed that the morphology and size of the ERC-Exos were consistent with those of ERC-siSLAMF6 Exos. Scale bars = 100 nm. C Nanoparticle tracking analysis (NTA) was used to determine the particle size distributions of ERC-Exo and ERC-siSLAMF6 Exo. D Western blot analysis was performed using SLAMF6 and the exosome-positive markers CD9, TSG101, and CD63 and the negative marker calnexin to verify the purification of the exosomes and the knockdown efficiency of siSLAMF6. E mRNA levels of SLAMF6 in ERC, ERC-siSLAMF6, ERC-Exo, and ERC-siSLAMF6 Exo (**P < 0.01). F Confocal microscopy was used to detect the uptake of PKH26-labeled Exos by T cells after they were incubated with T cells. The left side shows representative images, and the right side shows the changes in the proportion of exosome uptake per 20 cells. Scale bars = 100 μm (***P < 0.001)
Fig. 3
Fig. 3
ERC-Exo loaded with siSLAMF6 suppressed the proliferation of T cells and the activation of the T cell receptor signaling pathway. A Flow cytometry was used to calculate the percentage of CD4+Ki67+ T cells after 48 h of coculture with exosomes from different groups. The vector represents CD4+ T cells that did not receive any treatment. B The histogram represents the change in the percentage of CD4+Ki67+ T cells (ERC-siSLAMF6 Exo group versus vector group, P < 0.001; ERC-Exo group versus ERC-siNC Exo group, P > 0.05; ERC-siSLAMF6 Exo group versus ERC-Exo group, P < 0.05; and ERC-Exo group versus vector group, P < 0.01). C A colony formation assay was used to investigate the proliferation ability of CD4+ T cells cocultured with different groups of exosomes. D The histogram presents the number of CD4+ T cells (ERC-siSLAMF6 Exo group versus vector group, P < 0.0001; ERC-Exo group versus ERC-siNC Exo group, P < 0.05; ERC-siSLAMF6 Exo group versus ERC-Exo group, P < 0.001; ERC-Exo group versus vector group, P < 0.01). E The molecular docking model predicted the binding region of SLAMF6 and SH2D1A. F Co-IP assays revealed SLAMF6 and SH2D1A interactions in T cells. G Western blotting was used to detect the expression of SH2D1A, ZAP70, P-ZAP70, LCK, P-LCK, PI3K, P-PI3K, AKT, and P-AKT in the T cell receptor signaling pathway (TCR pathway) in CD4+ T cells cocultured with ERC-Exos or ERC-siSLAMF6 Exos for 48 h. GAPDH was used as the loading control. HJ ELISA was used to evaluate the levels of IL-4, IFNγ, and IL-17A secreted by the cell culture supernatant after 48 h of coculture with different groups of exosomes. n.s., P > 0.05, *P < 0.05, **P < 0.01 and ***P < 0.001
Fig. 4
Fig. 4
ERC-Exo loaded with siSLAMF6 regulated T cell differentiation in vitro. AC Flow cytometry was used to determine the proportions of Treg (CD4+CD25+FOXP3+) cells, Th1 (CD4+IFNγ+) cells, and Th17 (CD4+IL-17A+) cells after the CD4+ T cells were treated with exosomes. The left panel shows representative images, while the right panel shows a histogram of each groups proportion statistics. n.s., P > 0.05, *P < 0.05, **P < 0.01, ***P < 0.001, and ****P < 0.0001. D The enriched KEGG signaling pathways were selected to identify the top ten pathways in which SLAMF6 plays a major biological role. E RT–PCR analysis was used to determine the influence of SLAMF6 on the expression of RORγT mRNA (ERC-siSLAMF6 Exo group versus ERC-Exo group, P < 0.01). F Chromatin immunoprecipitation assays revealed that SLAMF6 knockdown impaired RORγT binding to the promoter of IL-17A. G The effect of SLAMF6 RORγT on IL-17A transcriptional activity was assessed using a luciferase reporter assay. The influence of the RORγT system on IL-22 transcriptional activity was employed as a positive control. n.s., P > 0.05, and ***P < 0.001
Fig. 5
Fig. 5
ERC-Exo loaded with siSLAMF6 regulated T cell activation and secretion of inflammatory factors through desialylation. A Confocal microscopy was used to detect the uptake of PKH26-labeled Exos by T cells after they were incubated with T cells. Scale bars = 100 μm. B Changes in the proportion of exosomes taken up by 20 cells shown in A (ERC-siSLAMF6 Exo group versus ERC-Exo group, P < 0.05; ERC-siSLAMF6 Exo group versus ERC-Exo + sialic acid group, P > 0.05; ERC-Exo group versus ERC-Exo + sialic acid group, P < 0.05). C Western blot analysis was used to detect the expression of SH2D1A, ZAP70, P-ZAP70, LCK, P-LCK, PI3K, P-PI3K, AKT, and P-AKT in the TCR pathway in CD4+T cells cocultured with ERC-Exo or ERC-siSLAMF6 Exo for 48 h. Sialic acid was added for 3 h before the cell protein was harvested to neutralize the sialic acid receptor. GAPDH was used as the loading control. D Lectin blot analysis was used to determine the glycosylation levels of SNA, MALII, ConA, and SBA in T cells cocultured with ERC-Exos and ERC-siSLAMF6 Exos. Coomassie brilliant blue (CBB) was used as the loading control. E The correlation of SLAMF6 and ST6GAL1 expression was analyzed with Spearman correlation in the acute and no-rejection groups. F Western blot analysis was used to detect the protein expression of ST6GAL1 and SNA in T cells cocultured with ERC-Exos or ERC-siSLAMF6 Exos. GAPDH was used as the loading control. GI ELISA was used to evaluate the levels of IL-4, IFNγ, and IL-17A secreted by the cell culture supernatant after 48 h of coculture with different groups of exosomes. Sialic acid was added for 3 h to neutralize sialic acid receptors before extraction of the cellular mRNA. n.s., P > 0.05, *P < 0.05, **P < 0.01, and ***P < 0.001
Fig. 6
Fig. 6
ERC-Exo loaded with siSLAMF6 significantly attenuated acute cardiac allograft rejection through desialylation. A The percentage variation in graft survival over time in each C57BL/6 mouse group (n = 6). The log‐rank (Mantel–Cox) test was used for statistical analysis (ERC-siSLAMF6 Exo group versus untreated group, P < 0.001; ERC0-Exo group versus ERC-siNC Exo group, P > 0.05; ERC-siSLAMF6 Exo group versus ERC-Exo group, P < 0.01; and ERC-Exo group versus vector group, P < 0.01). B Representative images of H&E staining of cardiac allograft rejection. The arrows show the perivascular infiltrate with or without necrosis. Scale bars = 100 μm. C The rejection score of each group is shown on the left, while the statistical results of the score are shown on the right (ERC-siSLAMF6 Exo group versus untreated group, P < 0.001; ERC-Exo group versus ERC-siNC Exo group, P > 0.05; ERC-siSLAMF6 Exo group versus ERC-Exo group, P < 0.01; and ERC-Exo group versus untreated group, P < 0.05). D Flow cytometry was used to detect the proportion of CD3+CD4+ T cells among the recipient splenocytes. The statistical analysis results are shown on the right (*P < 0.05, **P < 0.01, and ***P < 0.001). E Flow cytometry was used to detect the proportion of CD3+CD8+ T cells among the recipient splenocytes. E Percentages of CD3+CD4+ T cells and CD3+CD8+ T cells; *P < 0.05, **P < 0.01, ***P < 0.001, and ****P < 0.0001. F Western blot analysis was used to detect the expression of SH2D1A, ZAP70, P-ZAP70, LCK, P-LCK, PI3K, P-PI3K, AKT, and P-AKT in the TCR pathway in recipient grafts from each group. GI ELISA was used to evaluate the levels of IL-4, IFNγ, and IL-17A secreted by recipient serum in each group. n.s., P > 0.05, *P < 0.05, **P < 0.01, and ***P < 0.001
Fig. 7
Fig. 7
ERC-Exo loaded with siSLAMF6 regulated acute transplant rejection-related T cell differentiation in vivo. A Flow cytometry was used to detect the proportion of Tregs in recipient splenocytes. The statistical analysis results are shown on the right (ERC-siSLAMF6 Exo group versus untreated group, P < 0.001; ERC-Exo group versus ERC-siNC Exo group, P > 0.05; ERC-siSLAMF6 Exo group versus ERC-Exo group, P < 0.01; and ERC-Exo group versus untreated group, P < 0.05). B Flow cytometry was used to detect the proportion of Th1 cells in recipient splenocytes. The statistical analysis results are shown on the right (ERC-siSLAMF6 Exo group versus untreated group, P < 0.001; ERC-Exo group versus ERC-siNC Exo group, P > 0.05; ERC-siSLAMF6 Exo group versus ERC-Exo group, P < 0.01; and ERC-Exo group versus untreated group, P < 0.05). C Flow cytometry was used to detect the proportion of Th17 cells in the recipient splenocyte population. The statistical analysis results are shown on the right (ERC-siSLAMF6 Exo group versus untreated group, P < 0.001; ERC-Exo group versus ERC-siNC Exo group, P > 0.05; ERC-siSLAMF6 Exo group versus ERC-Exo group, P < 0.01; and ERC-Exo group versus untreated group, P < 0.05). D Flow cytometry was used to detect the proportion of Tregs in heart mononuclear cells. The statistical analysis results are shown on the right (ERC-siSLAMF6 Exo group versus untreated group, P < 0.001; ERC-Exo group versus ERC-siNC Exo group, P < 0.05; ERC-siSLAMF6 Exo group versus ERC-Exo group, P < 0.01; and ERC-Exo group versus untreated group, P < 0.05). E Flow cytometry was used to detect the proportion of Th1 cells in heart mononuclear cells. The statistical analysis results are shown on the right (ERC-siSLAMF6 Exo group versus untreated group, P < 0.001; ERC-Exo group versus ERC-siNC Exo group, P > 0.05; ERC-siSLAMF6 Exo group versus ERC-Exo group, P < 0.01; and ERC-Exo group versus untreated group, P < 0.05). F Flow cytometry was used to detect the proportion of Th17 cells among heart mononuclear cells. The statistical analysis results are shown on the right (ERC-siSLAMF6 Exo group versus untreated group, P < 0.0001; ERC-Exo group versus ERC-siNC Exo group, P < 0.05; ERC-siSLAMF6 Exo group versus ERC-Exo group, P < 0.001; and ERC-Exo group versus untreated group, P < 0.01)
Fig. 8
Fig. 8
Schematic diagram of this study. ERC-siSLAMF6 Exos play a role in desialylation. In brief, ERC-siSLAMF6 Exos can reduce sialic acid residues at the termini of N-linked glycan chains on the cell surface, which are typically connected by α-2,6 bonds. This reduction facilitates increased uptake of therapeutic exosomes by CD4+ T cells, thereby preventing the activation of the TCR signaling pathway and inhibiting the binding of RORγT to the IL-17A promoter region. As a result, CD4+ T-cell proliferation and differentiation into Th1 and Th17 subsets are suppressed, while the generation and proliferation of Tregs are promoted. These effects collectively contribute to the effective inhibition of acute transplant rejection. This schematic diagram was created with BioRender.com

References

    1. Strohmaier S, Wallisch C, Kammer M, Geroldinger A, Heinze G, Oberbauer R, Haller MC. Survival benefit of first single-organ deceased donor kidney transplantation compared with long-term dialysis across ages in transplant-eligible patients with kidney failure. JAMA Netw Open. 2022;5(10): e2234971. - PMC - PubMed
    1. Hariharan S, Israni AK, Danovitch G. Long-term survival after kidney transplantation. N Engl J Med. 2021;385(8):729–43. - PubMed
    1. Ekberg H, Tedesco-Silva H, Demirbas A, Vitko S, Nashan B, Gurkan A, Margreiter R, Hugo C, Grinyo JM, Frei U, et al. Reduced exposure to calcineurin inhibitors in renal transplantation. N Engl J Med. 2007;357(25):2562–75. - PubMed
    1. Kotton CN, Fishman JA. Viral infection in the renal transplant recipient. J Am Soc Nephrol. 2005;16(6):1758–74. - PubMed
    1. Ponticelli C, Favi E, Ferraresso M. New-onset diabetes after kidney transplantation. Medicina (Kaunas). 2021;57(3):1928. - PMC - PubMed