. 2024 Oct 1;22(1):881.
doi: 10.1186/s12967-024-05663-0.

Artificial intelligence driven definition of food preference endotypes in UK Biobank volunteers is associated with distinctive health outcomes and blood based metabolomic and proteomic profiles

Affiliations

Artificial intelligence driven definition of food preference endotypes in UK Biobank volunteers is associated with distinctive health outcomes and blood based metabolomic and proteomic profiles

Hana F Navratilova et al. J Transl Med. .

Abstract

Background: Specific food preferences can determine an individual's dietary patterns and therefore, may be associated with certain health risks and benefits.

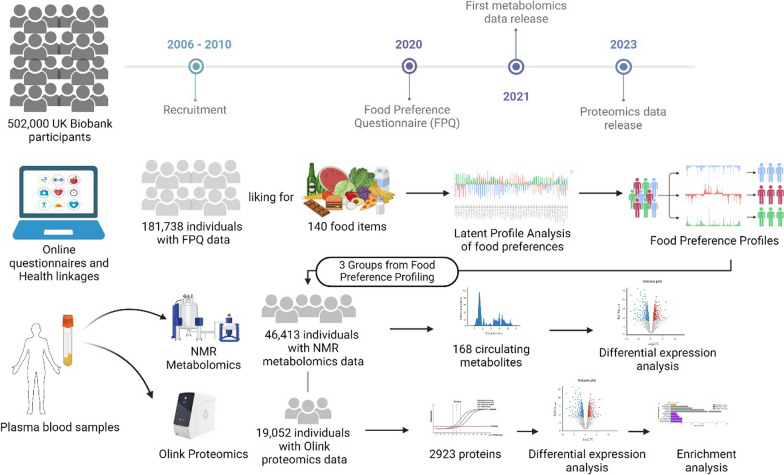
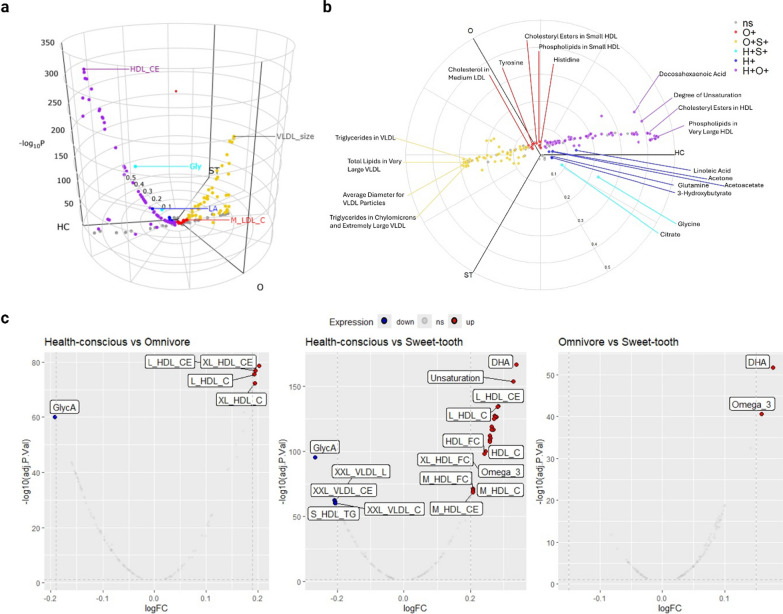
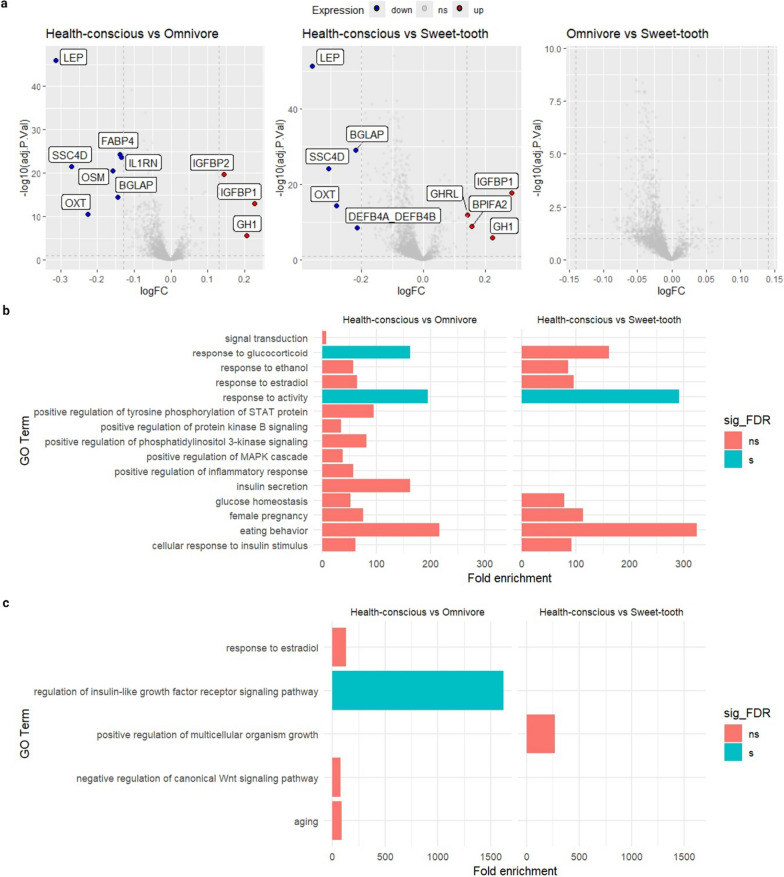
Methods: Using food preference questionnaire (FPQ) data from a subset comprising over 180,000 UK Biobank participants, we employed Latent Profile Analysis (LPA) approach to identify the main patterns or profiles among participants. blood biochemistry across groups/profiles was compared using the non-parametric Kruskal-Wallis test. We applied the Limma algorithm for differential abundance analysis on 168 metabolites and 2923 proteins, and utilized the Database for Annotation, Visualization and Integrated Discovery (DAVID) to identify enriched biological processes and pathways. Relative risks (RR) were calculated for chronic diseases and mental conditions per group, adjusting for sociodemographic factors.

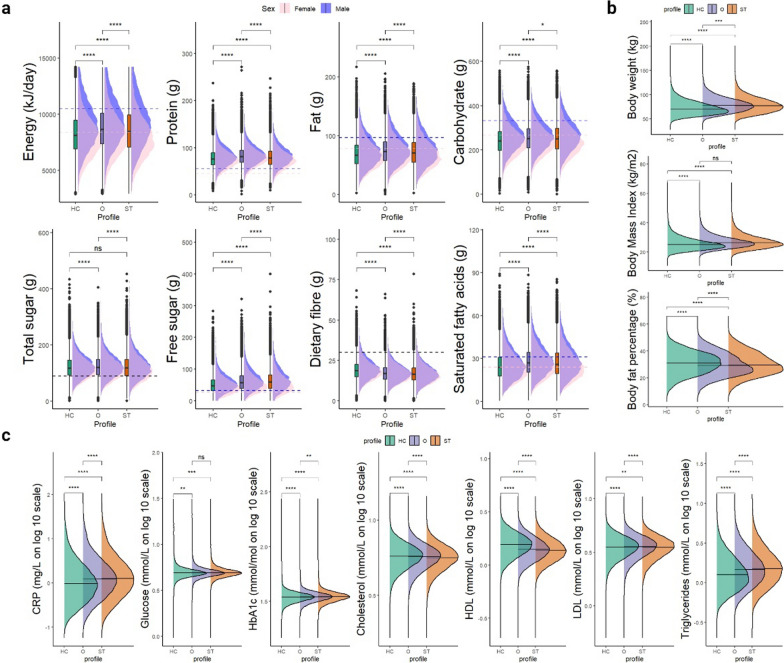
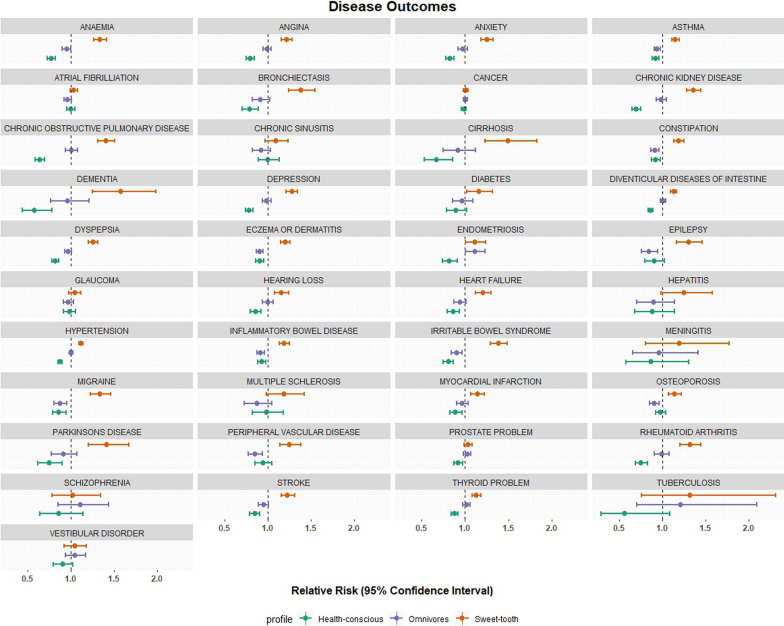
Results: Based on their food preferences, three profiles were termed: the putative Health-conscious group (low preference for animal-based or sweet foods, and high preference for vegetables and fruits), the Omnivore group (high preference for all foods), and the putative Sweet-tooth group (high preference for sweet foods and sweetened beverages). The Health-conscious group exhibited lower risk of heart failure (RR = 0.86, 95%CI 0.79-0.93) and chronic kidney disease (RR = 0.69, 95%CI 0.65-0.74) compared to the two other groups. The Sweet-tooth group had greater risk of depression (RR = 1.27, 95%CI 1.21-1.34), diabetes (RR = 1.15, 95%CI 1.01-1.31), and stroke (RR = 1.22, 95%CI 1.15-1.31) compared to the other two groups. Cancer (overall) relative risk showed little difference across the Health-conscious, Omnivore, and Sweet-tooth groups with RR of 0.98 (95%CI 0.96-1.01), 1.00 (95%CI 0.98-1.03), and 1.01 (95%CI 0.98-1.04), respectively. The Health-conscious group was associated with lower levels of inflammatory biomarkers (e.g., C-reactive Protein) which are also known to be elevated in those with common metabolic diseases (e.g., cardiovascular disease). Other markers modulated in the Health-conscious group, ketone bodies, insulin-like growth factor-binding protein (IGFBP), and Growth Hormone 1 were more abundant, while leptin was less abundant. Further, the IGFBP pathway, which influences IGF1 activity, may be significantly enhanced by dietary choices.

Conclusions: These observations align with previous findings from studies focusing on weight loss interventions, which include a reduction in leptin levels. Overall, the Health-conscious group, with preference to healthier food options, has better health outcomes, compared to Sweet-tooth and Omnivore groups.

Keywords: Biomarkers; Food preferences; Latent Profile Analysis; Metabolomics; Proteomics; Relative risk; Unsupervised machine learning.


Conflict of interest statement

The authors declare that they have no competing interests.

Figures

Fig. 1
Fig. 1
Schematic methodological approach. The figure illustrates the step-by-step process used in our study to identify food preference patterns and their biomarkers. Figure created with BioRender.com
Fig. 2
Fig. 2
Food preference profiles are distinctly clustered by dietary choices and behaviours. Three food preferences profiles were generated through unsupervised machine learning method: putative Health-conscious, Omnivore, and putative Sweet-tooth. Bars toward outer circle represent high preference, bars toward inner circle represent low preference
Fig. 3
Fig. 3
Characteristics dietary intake, body composition and blood biomarkers for each food preference profiles. A Boxplot for the average intake of nutrients across the three food preference profiles with a density plot delineates the variation in intake stratified by sex (pink for female, blue for male). Dashed lines refers to reference intake value based on UK Government Dietary Recommendations 2016. B Comparison of body weight, BMI, and body fat percentage among the three groups. C Blood biochemistry levels (in log 10 scale) associated with each food preference profile. HC = Health-conscious, O = Omnivore, ST = Sweet-tooth. The density plots in a, b and c indicate the median and distribution. Statistical analysis was performed using Kruskal–Wallis tests with Dunn’s test (post-hoc test). A one-sided p-value < 0.05 (uncorrected for multiple testing) suggests that the difference is statistically significance
Fig. 4
Fig. 4
Differential metabolite abundance revealed by comparison of 168 circulating metabolites across the three food preference profiles. a Three-dimensional volcano plots for inter-group comparison were employed. Vectors for Pathotype Mean Z Score per metabolite are projected onto a polar coordinate space analogous to RGB (red-green-blue) colour space, mapped to HSV (hue-saturation-value). The Health-conscious, Omnivore, and Sweet-tooth groups are mapped to three axes: Health-conscious (HC), Omnivore (O), and Sweet-tooth (ST) using polar coordinates in the horizontal plane. The z-axis represents – log10 p-value for the likelihood ratio test. Metabolites with an adjusted p-value for the likelihood ratio test < 0.05 (z-axis) were considered significant (non-significant genes are coloured grey). Colours demonstrate pairwise comparisons (FDR < 0.05) between the three food preference profiles (Blue: Health-conscious (H+); Red: Omnivore (O+); Green: Sweet-tooth (S+)). Composite colours show genes significantly upregulated in two groups (Purple: Health-conscious + Omnivore (H + O+); Yellow: Omnivore + Sweet-tooth (O + S+); Cyan: Health-conscious + Sweet-tooth(H + S+)) (b) a lateral view and 2D polar plots of three-way comparisons for further visualization. c Volcano plot of differentially expressed metabolites using Limma. This plot illustrates the differential abundance of proteins between two groups: Health-conscious vs. Omnivore, Health-conscious vs. Sweet-tooth, and Omnivore vs. Sweet-tooth. Blue dots represent significantly differentially expressed metabolites (decrease), red dot represent significantly increased metabolites
Fig. 5
Fig. 5
Food preference groups show differential abundance of 2923 proteins. a Volcano plot of differentially expressed proteins using limma. This plot illustrates the differential abundance of proteins between two groups: Health-conscious vs. Omnivore, Health-conscious vs. Sweet-tooth, and Omnivore vs. Sweet-tooth. Blue dot represent significantly decreased proteins, red dot represent significantly increased proteins. b The enrichment analysis revealed biological process that are significantly overrepresented with respect to proteins with lower abundance in the Health-conscious group compared to the Omnivores and Sweet-tooth groups. A higher fold enrichment score suggests a more pronounced overrepresentation of proteins within a specific pathway, highlighting distinct biological processes that are characteristic of the Health-conscious group. c This section identifies biological process GO terms enriched with target genes corresponding to proteins of increased abundance. Terms with significance interaction (P-value < 0.05) are shown. The blue bars indicate significance after multiple-testing correction (FDR < 0.05)
Fig. 6
Fig. 6
The relative risk (RR) of several disease outcomes related to multimorbidity within each profile. Dashed vertical line set at 1 indicates no association

References

    1. Guertin KA, Moore SC, Sampson JN, Huang WY, Xiao Q, Stolzenberg-Solomon RZ, et al. Metabolomics in nutritional epidemiology: identifying metabolites associated with diet and quantifying their potential to uncover diet-disease relations in populations. Am J Clin Nutr. 2014;100(1):208–17. - PMC - PubMed
    1. Playdon MC, Moore SC, Derkach A, Reedy J, Subar AF, Sampson JN, et al. Identifying biomarkers of dietary patterns by using metabolomics. Am J Clin Nutr. 2017;105(2):450–65. - PMC - PubMed
    1. García-Bailo B, Brenner DR, Nielsen D, Lee HJ, Domanski D, Kuzyk M, et al. Dietary patterns and ethnicity are associated with distinct plasma proteomic groups. Am J Clin Nutr. 2012;95(2):352–61. - PubMed
    1. Walker ME, Song RJ, Xu X, Gerszten RE, Ngo D, Clish CB, et al. Proteomic and metabolomic correlates of healthy dietary patterns: the Framingham Heart Study. Nutrients. 2020;12(5):1476. - PMC - PubMed
    1. Costello E, Goodrich JA, Patterson WB, Walker DI, Chen J, Baumert BO. Proteomic and metabolomic signatures of diet quality in young adults. Nutrients. 2024;16(3):429. - PMC - PubMed

LinkOut - more resources