. 2024 Oct 1;22(1):883.
doi: 10.1186/s12967-024-05670-1.

Application of a single-cell-RNA-based biological-inspired graph neural network in diagnosis of primary liver tumors

Affiliations

Application of a single-cell-RNA-based biological-inspired graph neural network in diagnosis of primary liver tumors

Dao-Han Zhang et al. J Transl Med. .

Abstract

Single-cell technology depicts integrated tumor profiles including both tumor cells and tumor microenvironments, which theoretically enables more robust diagnosis than traditional diagnostic standards based on only pathology. However, the inherent challenges of single-cell RNA sequencing (scRNA-seq) data, such as high dimensionality, low signal-to-noise ratio (SNR), sparse and non-Euclidean nature, pose significant obstacles for traditional diagnostic approaches. The diagnostic value of single-cell technology has been largely unexplored despite the potential advantages. Here, we present a graph neural network-based framework tailored for molecular diagnosis of primary liver tumors using scRNA-seq data. Our approach capitalizes on the biological plausibility inherent in the intercellular communication networks within tumor samples. By integrating pathway activation features within cell clusters and modeling unidirectional inter-cellular communication, we achieve robust discrimination between malignant tumors (including hepatocellular carcinoma, HCC, and intrahepatic cholangiocarcinoma, iCCA) and benign tumors (focal nodular hyperplasia, FNH) by scRNA data of all tissue cells and immunocytes only. The efficacy to distinguish iCCA from HCC was further validated on public datasets. Through extending the application of high-throughput scRNA-seq data into diagnosis approaches focusing on integrated tumor microenvironment profiles rather than a few tumor markers, this framework also sheds light on minimal-invasive diagnostic methods based on migrating/circulating immunocytes.

Keywords: Diagnostic model; Graph neural network; Primary liver tumors; Single-cell transcriptome; Tumor microenvironment.


Conflict of interest statement

All authors claim that there is no conflict of interest.

Figures
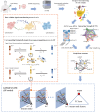
Fig. 1
Fig. 1
The architecture of the Gossip Flow (GF) framework. The figure illustrates the workflow and architecture of the Gossip Flow (GF) framework for processing scRNA-seq data from tissue samples. Sample Collection and Sequencing: Tissue samples are collected from each patient and subjected to scRNA-sequencing. Dimensionality Reduction and Clustering: The gene expression matrix generated from the scRNA-seq data undergoes dimensionality reduction and clustering analysis, resulting in multiple cell clusters for each sample. Pathway Enrichment Scores (PES) Matrix: For each cell cluster, GSVA pathway enrichment scores are calculated for K selected functional pathways, forming the PES matrix, which serves as the node features of the input graph structure. Inter-cluster communication features (CNT) Matrix: The unidirectional intercellular communication probability between N cell clusters is calculated via CellChat based on overexpressed ligands and receptors, forming the CNT matrix, which serves as the edge weights of the input graph structure. Graph Construction: Shown in the yellow dotted frame. The PES matrix and CNT matrix are used to construct the input graph structure. A master node (node 0) is added to receive projections from all other nodes, integrating features for readout. Directed Graph Convolutional Network (DGCN): Shown in the blue dotted frame. The graph structure is input into a DGCN with L layers. All DGCN layers share the same set of trainable parameters (W1&W2) to avoid overfitting. The master node collects global features. The red dotted frame dipcts part of the message-propagation details of node 1 in the first layer of DCGN as an example, which is biologically-inspired by intercellular signal transduction process in vivo. Output Projection: The feature vector of the master node in the final layer (h0L) is projected to the output node via a fully connected (FC) layer. * Created with BioRender.com
Fig. 2
Fig. 2
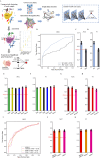
GF robustly classified primary liver cancer (iCCA&HCC) from benign tumours (FNH). A. Schematic figures of GF framework (blue arrow) and control diagnostic MLP model following traditional single-cell RNA analysis pipeline (grey arrow). B-D. Receiver operating characteristic (ROCs), accuracy (ACCs) and F1 scores (F1s) of GF framework and control MLP model following traditional single-cell RNA analysis pipeline (MLP). Each LOOCV test was repeated 10 times. E, F. ACCs and F1s of 3-layer directional GF models with different top k differentiate pathways of 6 cell groups. Each LOOCV test was repeated 5 times. G, H. ACCs and F1s of testing results of GF models with different DGCN layers and message propagating directions. Each LOOCV test was repeated 5 times. I-K. ROCs, ACCs and F1s of the GF models tested on data generate from different PCA resolution (RES = 0.3,0.5,0.7). Each LOOCV test was repeated 10 times. All the ACCs and F1s are presented as means ± standard deviations (SDs). All the error bars depict SDs, while red horizontal dotted lines represent the level of random chance (50%)
Fig. 3
Fig. 3
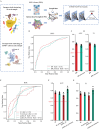
The GF model is a biologically inspired network that successfully integrates pathway enrichment features and unidirectional intercellular communication probabilities while performing diagnoses. A. Schematic figures showing GF models tested on on normal data, CNT polluted data (PES) and PES polluted data (CNT). B-D. ROCs, ACCs and F1s of GF models tested on normal data and data partially polluted (PES and CNT). Each LOOCV test was repeated 10 times. Without edge weights calculated from intercellular communication probabilities, PES reached an AUC of 0.46, an ACC of 0.49 ± 0.01, and an F1 of 0.51 ± 0.01. Similarly, without pathway enrichment scores, CNT reached an AUC of 0.56, an ACC of 0.51 ± 0.02, and an F1 of 0.53 ± 0.01. Integrating both pathway enrichment features and inter-clustercommunication features is of vital significance for the efficacy of the GF model. E. Schematic figures showing toy GF models with transdirected message-propagation direction (TGF) and unidirected message-propagation direction (UGF). Other hyperparameters were set identical to those of the best GF model. F-H. ROCs, ACCs and F1s of GF models, TGF toy model and UGF toy model. UGF achieved an AUC of merely 0.51, an ACC of 0.49 ± 0.02, and an F1 of 0.52 ± 0.02, while TGF achieved an AUC of merely 0.50, an ACC of 0.53 ± 0.02, and an F1 of 0.55 ± 0.02, indicating that GF relies on a biologically plausible message propagation direction. All the models were tested on ten rounds of LOOCV tests. All the ACCs and F1s are presented as means ± standard deviations (SD). All the error bars depict SDs, while red horizontal dotted lines represent the level of random chance (50%)
Fig. 4
Fig. 4
The GF model can be applied to scRNA data of immunocytes and distinguish subtypes of primary liver tumours. A. Schematic figures showing GF models applied on scRNA data of all cells and immunocytes only. B-D. ROCs, ACCs and F1s of GF model applied on transcriptome data consisting of whole cells and immunocytes (BM_immuno). An AUC of 0.77, an ACC of 0.70 ± 0.02 and an F1 of 0.70 ± 0.02 were achieved when testing on immunocytes, verifying the capacity of the GF framework to capture the systemic features of tumour microenvironments and its robustness in tackling tissue samples with high heterogeneity. E-G. ROCs, ACCs and F1s of the best GF model in terms of distinguishing subtypes (iCCA and HCC) of primary liver tumours when applied on transcriptome data consisting of whole cells (IH)/immunocytes (IH_immuno). An AUC of 0.74, an ACC of 0.75 ± 0.02 and an F1 of 0.72 ± 0.03 were achieved by IH model of whole cells. An AUC of 0.72, an ACC of 0.72 ± 0.03 and an F1 of 0.70 ± 0.03 were achieved by IH model of immunocytes. An AUC of 0.75, an ACC of 0.67 ± 0.04 and an F1 of 0.67 ± 0.05 were achieved when testing on public data of whole cells. An AUC of 0.72, an ACC of 0.83 ± 0.04 and an F1 of 0.82 ± 0.04 were achieved on public data of immunocytes. For all the models tested on internal datasets via cross-validation, tests were performed through ten rounds of LOOCV tests. Each test performed on public data was repeated 10 times. All the ACCs and F1s are presented as means ± standard deviations (SDs). All the error bars depict SDs, while red horizontal dotted lines represent the level of random chance (50%)

References

    1. Sung H, Ferlay J, Siegel RL, et al. Global Cancer statistics 2020: GLOBOCAN estimates of incidence and Mortality Worldwide for 36 cancers in 185 countries. CA Cancer J Clin. 2021;71(3):209–49. - PubMed
    1. Valle JW, Kelley RK, Nervi B, Oh D-Y, Zhu AX. Biliary tract cancer. Lancet. 2021;397(10272):428–44. - PubMed
    1. Singal AG, Lok AS, Feng Z, Kanwal F, Parikh ND. Conceptual model for the hepatocellular carcinoma screening continuum: current status and research agenda. Clin Gastroenterol Hepatol. 2022;20(1):9–18. - PMC - PubMed
    1. National Comprehensive Cancer Network Guidelines for Hepatobiliary Cancers. (Version 1.2022). https://www.nccn.org/guidelines/guidelines-process/transparency-process-.... Published 2022. Accessed May 4, 2023, 2023.
    1. Hu C, Xia T, Cui Y, et al. Trustworthy multi-phase liver tumor segmentation via evidence-based uncertainty. Eng Appl Artif Intell. 2024;133:108289.

MeSH terms

LinkOut - more resources