. 2025 Mar 21;16(9):mjae042.
doi: 10.1093/jmcb/mjae042.

HIV-1 inhibits IFITM3 expression to promote the infection of megakaryocytes

Affiliations

HIV-1 inhibits IFITM3 expression to promote the infection of megakaryocytes

Cyrine Bentaleb et al. J Mol Cell Biol. .

Abstract

Despite an undetectable plasma viral load as a result of antiretroviral therapy, HIV-1-infected individuals with poor immune reconstitution harbor infectious HIV-1 within their platelets. Megakaryocytes, as platelet precursors, are the likely cellular origin of these HIV-1-containing platelets. To investigate the mechanisms that allow megakaryocytes to support HIV-1 infection, we established in vitro models of viral infection using hematopoietic stem cell-derived megakaryocytes and the megakaryocytic MEG-01 cell line. We observed HIV-1 DNA provirus integration into the megakaryocyte cell genome, self-limiting virus production, and HIV-1 protein and RNA compartmentalization, which are hallmarks of HIV-1 infection in myeloid cells. In addition, following HIV-1 infection of megakaryocyte precursors, the expression of interferon-induced transmembrane protein 3 (IFITM3), an antiviral factor constitutively expressed in megakaryocytes, was inhibited in terminally differentiated HIV-1-infected megakaryocytes. IFITM3 knockdown in MEG-01 cells prior to infection led to enhanced HIV-1 infection, indicating that IFITM3 acts as an HIV-1 restriction factor in megakaryocytes. Together, these findings indicate that megakaryocyte precursors are susceptible to HIV-1 infection, leading to terminally differentiated megakaryocytes harboring virus in a process regulated by IFITM3. Megakaryocytes may thus constitute a neglected HIV-1 reservoir that warrants further study in order to develop improved antiretroviral therapies and to facilitate HIV-1 eradication.

Keywords: HIV-1; IFITM3; megakaryocytes.


Figures

Figure 1
Figure 1
Megakaryocyte differentiation in vitro. (A) Multiparametric flow cytometry and UMAP analyses of megakaryocytes after 14, 18, and 21 days of differentiation, showing undifferentiated, immature, and mature megakaryocyte populations. (B) Frequencies (modal) of megakaryocytes with different ploidy (2N–32N) up to Day 21 of differentiation. (C) A CD61+ megakaryocyte after 14 days of differentiation with typical megakaryocyte multilobular nuclei. Intracellular maturation marker vWF sequestered in pro-platelets (inset, arrows) was observed as assessed in three-dimensional image xy/xz projections. (D) Pro-platelet formation (arrows) in megakaryocyte preparations, observed by phase contrast (left) and confocal microscopy after CD61 immunostaining (right). Results were representative of four different cord blood HSPC donors.
Figure 2
Figure 2
Expression of cell receptors and coreceptors for HIV-1 entry in HSPCs. (A) Frequencies (modal) of CD34+ cells among total HSPCs in culture (left) and frequencies of CD4+ cells among CD34+ HSPCs in culture (right). CD4 expression was assessed by flow cytometry (FACS) in HSPCs after HSPC expansion. (B) CXCR4 and CCR5 expression in CD4+CD34+ HSPCs were assessed by flow cytometry at Day 7 of differentiation. Results are representative of three different cord blood HSPC donors. (C) mRNA expression levels of CD4, CXCR4, and CCR5 were assessed in HSCs, CMPs, bipotent MEPs, and unipotent MegPs. Results represented as expression values assessed using the GSE77439 dataset. The pathway of HSC differentiation toward the megakaryocyte progenitors MEP and MegP is shown by dotted-line arrows. Expression values represented in colorimetric scale ranging from black–purple (low expression, negative values) to orange–yellow (high expression, positive values) according to the progenitor.
Figure 3
Figure 3
In vitro HIV-1 infection of megakaryocytes. (A) Experimental design for HIV-1 infection of megakaryocytes. Cells were infected at Day 7 of the differentiation regimen (Day 0 post-infection corresponds to Day 7 of HSPC differentiation). (B) Cumulative production of p24-Gag in HSPC culture supernatants over a 14-day period post-infection. (C) Integrated HIV-1 DNA copies/106 cells in infected HSPC-derived megakaryocytes. Data show results from two independent donors (orange and purple). A pool of PBMCs (red) from three donors was infected in vitro and used as a positive control. Gag-only probing as technical negative control. (D) HIV-1 RNA was detected in megakaryocytes by FISH-flow. Left: combined detection of HIV-1 RNA and p24-Gag in megakaryocyte preparations that were or were not infected by HIV-1. Right: p24+/HIV-1 RNA+ double-positive cells backgated as red dots into megakaryocytes UMAP plots (CD42b+ mature megakaryocytes in purple region). The frequency of p24+/HIV-1 RNA+ megakaryocytes among the mature purple population is presented with SEM in brackets (= 3 donors). (E) Frequency of mature (CD42b+) and immature (CD42bneg) megakaryocytes among CD61+ cells infected or not by HIV-1. ns: no statistically significant differences (Mann–Whitney test, > 0.05, n = 4 different cord blood HSPC donors). (F) Confocal microscopy after HIV-1 RNA in situ hybridization combined with immunostaining for HIV-1 p24-Gag protein and megakaryocyte marker CD61, revealing viral compartmentalization in VCC-like structures (arrows).
Figure 4
Figure 4
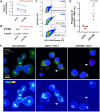
HIV-1 infection decreases the expression of IFITM3 in megakaryocytes in vitro. (A) Non-infected (upper) and HIV-1-infected megakaryocytes (bottom) were immunostained for HIV-1 p24-Gag (arrowheads) and IFITM3 and observed in three-dimensional xy/xz/yz projections. Nuclei were stained with DAPI. IFITM3 fluorescence intensity represented by colorimetric scale (from blue to red as expression increases), with nuclei (DAPI) in white (Right). (B) FACS gating strategy to assess IFITM3 expression in megakaryocytes derived from two different cord blood donors, infected (red histograms) or not (gray histograms) by HIV-1 (7 days post-infection). (C) IFITM3 expression (GeoMean MFI) in megakaryocytes infected or not, per HSPCs donor (left), and as percentage of decrease normalized by the non-infected group (right, Mann–Whitney test, *< 0.05). Results were representative of two different cord blood HSPC donors and two independent experiments. (D and E) IFITM3 GeoMean MFI in non-infected samples (HIV-1 RNAneg population) and HIV-1-infected samples (HIV-1 RNA+ or HIV-1 RNAneg populations) at Day 7 post-infection. HIV-1 RNA+ or HIV-1 RNAneg populations were defined by FISH-flow staining of HIV-1 RNA. IFITM3 GeoMean MFI in colorimetric scale (from blue to red as expression increases). Results representative of one experiment using HSPCs from two donors. (E) IFITM3 expression levels in HIV-1 RNA+ or HIV-1 RNAneg gated populations from HIV-infected cell cultures normalized to the expression levels in the HIV-1 RNAneg gated population from non-infected cell cultures. ANOVA, *< 0.05. Results were representative of two independent experiments.
Figure 5
Figure 5
IFITM3 knockdown enhances HIV-1 infection in MEG-01 cells. (A and B) Relative IFITM3 expression measured in MEG-01 cells transfected with an siRNA targeting IFITM3 (siIFITM3) or a non-targeting control siRNA (siNTC) 48 h post-transfection. The mean percentage (±SEM) of silencing efficiency is shown in red. (A) IFITM3 mRNA expression fold change in normalized to RNaseP expression. Blue line indicates mean of independent experiments (gray lines), normalized to siNTC. (B) Western blotting of protein lysates from siNTC- and siIFITM3-transfected cells probed with anti-IFITM3 and β-actin antibodies. (C) p24+/HIV-1 RNA+ cell frequency detected by FISH-flow in cells for non-infected control (top), infected siNTC-transfected (middle) and infected siIFITM3-transfected (bottom) cells. (D) Frequency of p24+/HIV-1 RNA+ cells among siNTC- and siIFITM3-transfected infected cells, after subtracting the frequency of p24+/HIV-1 RNA+ events in non-infected control cultures. Each dot represents an independent experiment (= 3). Student's t-test, *< 0.05. (E) HIV-1 RNA in situ hybridization coupled to the immunolabeling of IFITM3 in non-infected control (left), infected siNTC-transfected (middle), and infected siIFITM3-transfected cells (right), as observed by confocal microscopy. Arrows point to infected cells.

References

    1. Ahi Y.S., Yimer D., Shi G. et al. (2020). IFITM3 Reduces retroviral envelope abundance and function and is counteracted by glycoGag. mBio 11, e03088-19. - PMC - PubMed
    1. Baker J.V., Peng G., Rapkin J. et al. (2008). Poor initial CD4+ recovery with antiretroviral therapy prolongs immune depletion and increases risk for AIDS and non-AIDS diseases. J. Acquir. Immune Defic. Syndr. 48, 541–546. - PMC - PubMed
    1. Baumer Y., Weatherby T.M., Mitchell B.I. et al. (2021). Hiding in plain sight—platelets, the silent carriers of HIV-1. Platelets 32, 1038–1042. - PMC - PubMed
    1. Boilard E., Flamand L. (2019). The role of the megakaryocyte in immunity has gone viral. Blood 133, 2001–2002. - PubMed
    1. Boukour S., Masse J.M., Benit L. et al. (2006). Lentivirus degradation and DC-SIGN expression by human platelets and megakaryocytes. J. Thromb. Haemost. 4, 426–435. - PubMed