. 2025 Jan 13;15(1):179-201.
doi: 10.1158/2159-8290.CD-24-0134.

TIMP1 Mediates Astrocyte-Dependent Local Immunosuppression in Brain Metastasis Acting on Infiltrating CD8+ T Cells

Affiliations

TIMP1 Mediates Astrocyte-Dependent Local Immunosuppression in Brain Metastasis Acting on Infiltrating CD8+ T Cells

Neibla Priego et al. Cancer Discov. .

Abstract

Immunotherapies against brain metastases have shown clinical benefits when applied to asymptomatic patients, but they are largely ineffective in symptomatic cases for unknown reasons. Here, we dissect the heterogeneity in metastasis-associated astrocytes using single-cell RNA sequencing and report a population that blocks the antitumoral activity of infiltrating T cells. This protumoral activity is mediated by the secretion of tissue inhibitor of metalloproteinase-1 (TIMP1) from a cluster of pSTAT3+ astrocytes that acts on CD63+ CD8+ T cells to modulate their function. Using genetic and pharmacologic approaches in mouse and human brain metastasis models, we demonstrate that combining immune checkpoint blockade antibodies with the inhibition of astrocyte-mediated local immunosuppression may benefit patients with symptomatic brain metastases. We further reveal that the presence of tissue inhibitor of metalloproteinase-1 in liquid biopsies provides a biomarker to select patients for this combined immunotherapy. Overall, our findings demonstrate an unexpected immunomodulatory role for astrocytes in brain metastases with clinical implications. Significance: This study presents a significant advancement in understanding immune modulation in brain tumors and offers new insights into the potential therapeutic interventions for brain metastases. See related commentary by Lorger and James, p. 11.


Conflict of interest statement

N. Priego reports grants from Asociación Española Contra el Cáncer during the conduct of the study. A. de Pablos-Aragoneses reports grants from Fundación La Caixa during the conduct of the study. L. Álvaro-Espinosa reports grants from Spanish Ministry of Economy and Competitiveness during the conduct of the study. R. Rudà reports grants from Bayer, as well as personal fees from Novocure, Servier, Genenta, and CureVac outside the submitted work. M. Schmitz reports grants from Federal Ministry of Education and Research, cofunded by the European Commission, and the Federal Ministry of Education and Research during the conduct of the study. M. Valiente reports grants from AstraZeneca outside the submitted work. No disclosures were reported by the other authors.

Figures

Figure 1.
Figure 1.
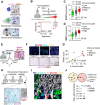
Clusters of brain metastasis–associated reactive astrocytes suggest functional diversity including immune modulation. A, Schema of the experimental design. Three different brains from C57BL/6J mice intracranially injected with B16/F10-BrM cells were enzymatically digested and pooled. ACSA2 labeling was used to enrich the sample in glial cells, obtaining 7,762 cells identified as astrocytes. A pool of three brains without tumor was used as the control for comparisons. B, Uniform manifold approximation and projection (UMAP) plot (0.2 resolution) of the different subpopulations of reactive astrocytes in brain metastasis. Dotted lines surround Stat3+ clusters. C, Stat3 expression in the different clusters of brain metastasis–associated astrocytes. Dot size represents the dimension of the subpopulation compared with total cells and a colored scale indicates the level of expression: blue, low expression and red, high expression. D and E, Representation of the top upregulated gene set enrichment analysis (GSEA) pathways in Stat3+ astrocytic clusters of brain metastasis according to the normalized enrichment score (NES) and a cutoff of P value < 0.05 and FDR <0.25. ECM, extracellular matrix. Colored pathways according to the biological category the gene sets belong to, correspond to more than half of the total pathways analyzed (total percentage of 100%). Detailed information of the pathways in Supplementary Table S4. F, Schema of the experimental design. Two human brain metastases from patients with lung cancer and breast cancer were fixed, digested and profiled for single-cell RNA-sequencing (scRNA-seq), 2,612 astrocytes and 1,338 astrocytes were identified, respectively. G, UMAP plot (k = 20) of the different subpopulations of reactive astrocytes in human brain metastasis. Dotted lines surround clusters with STAT3 high expression. H, STAT3 expression in the different clusters of brain metastasis-associated astrocytes. Dot size represents the dimension of the subpopulation compared with total cells and a colored scale indicates the level of expression: blue, low expression and red, high expression. I, Normalized enrichment score (NES) of GSEA pathways comparing clusters 3, 4, and 5 of human brain metastases–associated astrocytes. KEGG_Cytokine–cytokine receptor interaction, p.adjust = 1,05E−05; Reactome_Extracellular matrix (ECM) organization, p.adjust = 1,03E−03; Reactome_Signaling by Interleukins, p.adjust = 8,65E−03; Reactome_Antigen processing: Ubiquitination and Proteasome degradation, p.adjust = 1,67E−02; Reactome_Cell Cycle Checkpoints, p.adjust = 3,43E−03; Hallmark_Epithelial_mesenchymal_transition (EMT), p.adjust = 5E−09; KEGG_ECM–receptor interaction, p.adjust = 7.08E−05; HALLMARK_Interferon_alpha response, p.adjust = 1.11E−02; KEGG_Proteasome, p.adjust = 6.53E−04; HALLMARK_Myc Targets V1, p.adjust = 2.88E−07.
Figure 2.
Figure 2.
The protumoral role of STAT3+ reactive astrocytes involves immune modulation. A, Schema of the experimental design. Green cells: pSTAT3 astrocytes; red cells: pSTAT3+ astrocytes. Preactivated CD8+ lymphocytes incubated with CM generated by pSTAT3 and pSTAT3+ astrospheres (as described in the “Methods” section) were processed for bulk RNA-seq. B, GSEA of biological process of T-cell activation downregulated in T cells incubated with pSTAT3+ astrospheres CM compared with pSTAT3 astrospheres CM. n = 3 independent T cells in in vitro cultures per condition. C, Schema of the experimental design. C57BL/6J mice were intracranially injected with B16/F10-BrM cells, control brains and brains from mice treated during 6 days with the STAT3 inhibitor, silibinin (Legasil 200 mg/kg, daily) were processed to obtain the immune infiltrate fraction, which was depleted from monocytes. Rhapsody system was used to single-cell sequence a total of 3,055 immune cells identifying different CD3+ T-cell clusters. D, Quantification showing the percentage of cytotoxic-like T cells (clusters 4, 7, and 13; Supplementary Fig. S2C–S2E) in the brains of control and silibinin treated mice. Values are shown in box-and-whisker plots, in which each dot is a mouse and the line in the box corresponds to the median. The boxes go from top to bottom quartiles, and the whiskers go from minimum to maximum values (n = 8 control mice; n = 9 mice treated with silibinin). P value was calculated using two-tailed t test between control and silibinin experimental groups. E, Schema of the experimental design. Tamoxifen (Tmx)-treated and untreated cKOGFAP-Stat3 mice intracranially injected with B16/F10-BrM cells were sacrificed at the experimental endpoint, their brains were processed to obtain the immune fraction for flow cytometry analysis or sorted for CD3+CD8+ lymphocytes for RNA isolation and qRT-PCR analysis of gene expression. F, Representative flow cytometry analysis of Granzyme B expression in CD3+CD8+ T cells from control and cKOGFAP-Stat3 brains intracranially injected with B16/F10-BrM cells. G, Quantification of the experiment in F. Error bars, SEM. Every dot is a different animal (n = 8). P value was calculated using the two-tailed t test. H, Schema of the experimental design. Brains from untreated or Tmx-treated cKOGFAP-Stat3 with IgG2 or anti-CD8 (10 mg/kg, every 2 days starting at day 3 after inoculation of cancer cells), 2 weeks after being inoculated with B16/F10-BrM cells intracardially, were analyzed. I, Representative images of ex vivo brains in H. Images show the BLI intensity. J, Quantification of ex vivo BLI. Values are shown in box-and-whisker plots in which every dot represents a different animal. Values were obtained from normalizing the ex vivo brain signal to the in vivo head signal 3 days after intracardiac injection when treatment was initiated (n = 39/28/28 mice per experimental condition, eight independent experiments). P value was calculated using the two-tailed t test.
Figure 3.
Figure 3.
TIMP1 and STAT3 in reactive astrocytes correlate with a high immune cluster classifier in human brain metastases. A, Representative images showing pSTAT3+ TIMP1+ reactive astrocytes (arrowheads) in different samples: astrospheres enriched in STAT3, established brain metastasis induced by intracardiac inoculation of B16/F10-BrM cells and human breast cancer brain metastasis. Dotted line surrounds the cancer cells (CC). Scale bar, 20 μm. B, Schema of the experimental design. Sequencing data from patients’ samples with brain metastases were stratified into low, medium, and high immune categories or clusters. Immune clusters were calculated according to an initial algorithm and then complemented with a three-gene classifier representing key cell types of the microenvironment. C and D, STAT3 (C) and TIMP1 (D) expression in human samples from low, medium, and high immune clusters. Values are shown in box-and-whisker plots, in which each dot is a patient and the line in the box corresponds to the median. The boxes go from top to bottom quartiles, and the whiskers go from minimum to maximum values (n = 32 samples, low; n = 64 samples, medium; n = 12 samples, high). P value was calculated using the two-tailed t test. One-way ANOVA is shown to compare the three immune categories. E, Schema of the experimental design. A cohort of 12 human samples with extended resection including peritumoral microenvironment was used to validate sequencing data with IHC profile. In the IHC image, STAT3+ reactive astrocytes are shown. cc, cancer cells; RA, reactive astrocytes. Scale bar, 40 μm. F, Multiplex representative images of low/medium/high immune clusters in the cohort of human samples in E. STAT3 staining and TIMP1 RNAscope were performed in consecutive sections and allocated on the specific patient categories. n = 4 samples in low immune cluster, n = 4 samples in medium immune cluster, n = 4 samples in high immune cluster. Scale bar, 50 μm, magnification 15 μm. G, Graph showing the correlation between the percentage of immune cells as quantified by multiplex and the percentage of TIMP1+ events per cell in the microenvironment of 12 brain metastasis samples. Dots are colored according to the immune cluster calculated for the cohort of samples: low (green)/medium (grey)/high (red) immune clusters. P value was calculated using the two-tailed t test. H, Representative image of a patient with melanoma brain metastasis treated with ICB showing pSTAT3+ reactive astrocytes surrounding brain metastasis lesion next to CD8+ T cells. The patient showed extracranial response but failed to respond to ICB intracranially. The dotted line surrounds the cancer cells (cc). Scale bar, 15 μm. I, Representative image of multiplex in a sample of a patient in H. Magnification showing CD8+ Granzyme B+ T cells (yellow arrowheads) and CD8+ Granzyme B 3 T cells (pink arrowheads). Scale bar, 20 μm. J, Quantification of experiment in I. The graph represents the number of pSTAT3+ reactive astrocytes surrounding a CD8+ T cell with or without Granzyme B positivity in a ratio of 100 μm. A total of 40 CD8+ T cells from five different patients in which GRZ+CD8+ T cells could be identified belonging to the cohort in H were quantified. Error bars, SEM. Every dot is a different CD8+ T cell. P value was calculated using the two-tailed t test.
Figure 4.
Figure 4.
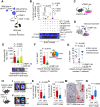
TIMP1 mediates brain metastasis in a CD8+ T-cell–dependent manner. A, Schema of the experimental design. pSTAT3 and pSTAT3+wt and pSTAT3+ cKOGFAP-Timp1 CM (with or without rTIMP1 100 ng/mL or control IgG/anti-TIMP1 10 μg/mL) was added to CD8+ T cells and cultured with BrM cells in a 1:4 ratio (BrM-OVA cancer cells: OT-I T cells specific for the OVA-derived SIINFEKL peptide) or a 1:5 ratio (BrM cancer cells:CD8+ T cells previously activated). B, Quantification of the BLI signal from the experiment shown in A and representative images of B16/F10-BrM-OVA–derived BLI at the initial time point and 24 hours after adding CD8+ lymphocytes preincubated with CM. Light orange condition refers to coculture of OT-I T cells with B16/F10-BrM no OVA (control for antigen-specific killing). Values correspond to 24 hours BLI normalized to BLI before adding CD8+ T cells expressed in percentage with respect to the mean of control experimental condition (BrM cells). Error bars, SEM. n = 3 different cocultures per condition. P value was calculated using the two-tailed t test. C and D, Schema of the experimental design. Control IgG or anti-TIMP1 (10 μg/mL) was added to the medium in organotypic cultures of mouse brain with B16/F10-BrM established lesions (C) and PDOC that include the brain metastasis–associated microenvironment (D). E, Quantification of the BLI signal emitted by B16/F10-BrM cells in each brain slice normalized by the initial value obtained at day 0, before the addition of control IgG, anti-TIMP1 (10 μg/mL) or anti-CD8 (100 μg/mL). Values are shown in box-and-whisker plots in which every dot represents a different organotypic culture and the line in the box corresponds to the median. Whiskers go from minimum to maximum values (n = 42 IgG, 39 anti-TIMP1 and 27 anti-TIMP1 plus anti-CD8 independent organotypic cultures). Quantification is accompanied by representative images of wells containing brain organotypic cultures with established B16/F10-BrM metastases grown ex vivo for 3 days. The image shows the BLI intensity in each condition for each brain slice. P values were calculated using the two-tailed t test. F, Quantification of the number of Ki67+ cancer cells found in IgG2 and anti-TIMP1-treated PDOCs. Values are shown in box-and-whisker plots in which every dot represents a patient and each patient is an independent experiment (n = 11). The pie chart shows all BrM-PDOCs quantified in the graph and classified according to the specific primary tumor. P value was calculated using two-tailed t test. G, Quantification of the number of Ki67+ cancer cells found in IgG2, anti-TIMP1 (10 μg/mL), and anti-TIMP1 (10 μg/mL) plus anti-CD8 (10 μg/mL) PDOCs. Values are shown in box-and-whisker plots in which every dot represents a patient and each patient is an independent experiment (n = 7). P value was calculated using two-tailed t test. H, Schema of the experimental design. cKOGFAP-Timp1 mice were inoculated with BrM cells intracardially, and after 2 weeks, ex vivo brain BLI was analyzed. I and J, Representative images of brains from control and cKOGFAP-Timp1 mice intracardially injected with B16/F10-BrM (I) or E0771-BrM (J) cells. The image shows the BLI intensity in each condition. K and L, Quantification of ex vivo brain BLI. Values are shown in box-and-whisker plots in which every dot represents a different animal. Values were obtained from normalizing the ex vivo brain signal to the in vivo head signal 3 days after intracardiac injection with either B16/F10-BrM (K) or E0771-BrM (L) cells (n = 26/29 mice four independent experiments in K and n = 28/25 mice three independent experiments in L). P value was calculated using the two-tailed t test. M, Representative images of CD8+ T cells in metastatic lesions growing in the brains from control or cKOGFAP-Timp1 mice intracardially injected with E0771-BrM at experimental endpoint. White arrowhead indicates CD8+ T cells and red arrowheads indicate Ki67+CD8+ T cells. Scale bar, 25 μm, magnification 5 μm. N, Quantification of the total number of CD8+ T cells in control and cKOGFAP-Timp1 mice intracardially injected with E0771-BrM at human endpoint. Values are shown in box-and-whisker plots in which every dot represents a different animal. Ten brains were analyzed in each condition. P value was calculated using the two-tailed t test.
Figure 5.
Figure 5.
Characterization of the influence of TIMP1 in CD8+ T cells. A, Schema of the experimental design. pSTAT3 and pSTAT3+wt and pSTAT3+ cKOGFAP-Timp1 CM were added to CD8+ T cells, and flow cytometry analysis was performed. B, Representative flow cytometry analysis using preactivated CD8+ T cells incubated with CM generated by pSTAT3 and pSTAT3+wt or pSTAT3+ cKOGFAP-Timp1 astrospheres. C, Quantification of CD25 geometric mean fluorescence intensity (gMFI) in effector CD8+ T cells from A. Error bars, SEM. n = 3 different T cells cultures per condition. P value was calculated using the two-tailed t test. D and E, Flow cytometry analysis showing the percentage of IFNγ+TNFα+ (D) and exhausted PD1+LAG3+TIM3+CD39+ (E) CD8+ T cells incubated with CM generated by pSTAT3 and pSTAT3+wt or pSTAT3+ cKOGFAP-Timp1 astrospheres. Error bars, SEM. n = 3 different T cells cultures per condition. P value was calculated using the two-tailed t test. F, Schema of the experimental design. CD8+ lymphocytes from wt and cKOGFAP-Timp1 brains intracranially injected with B16/F10-BrM cells were analyzed by flow cytometry. G and H, Representative flow cytometry analysis of CD44 (G) and quantification of the experiment (H). Error bars, SEM. Every dot is a different animal (n = 5 wt brains and n = 5 cKOGFAP-Timp1 brains). P value was calculated using the two-tailed t test. I and J, Representative flow cytometry analysis of TNFα (I) and quantification of the experiment (J). Error bars, SEM. Every dot is a different animal (n = 8 wt brains and n = 9 cKOGFAP-Timp1 brains). P value was calculated using the two-tailed t test. K and L, Representative flow cytometry analysis of CD39 and PD1 (K) and quantification of the experiment (L). Error bars, SEM. Every dot is a different animal (n = 8 wt brains and n = 9 cKOGFAP-Timp1 brains). P value was calculated using the two-tailed t test.
Figure 6.
Figure 6.
TIMP1 modulates CD8+ T cells through CD63. A, Schema of the experimental design. CD63 expression was analyzed by flow cytometry gating on CD8+ T cells from metastasis free condition and brains intracranially injected with B16/F10-BrM cells. B, Flow cytometry analysis of CD63 expression gated on CD8+ T cells from brains without tumor and brains intracranially injected with B16/F10-BrM cells. Error bars, SEM. Every dot is a different animal (n = 3 metastasis free brains and n = 6 B16/F10-BrM brain metastases). P value was calculated using the two-tailed t test. C, Immunofluorescence of established B16/F10-BrM metastasis. CD63 is expressed on CD8+ T cells surrounding the lesion. Red arrowhead indicates a CD63+CD8+ T cell. Scale bar, 10 μm. D, Representative image showing colocalization of metastasis-associated CD8 and CD63 staining in a patient with lung cancer brain metastasis. White arrowhead indicates a CD8+ T cell and red arrowhead indicates a double CD63+CD8+ T cell. Scale bar, 10 μm. E, Immunoblotting using anti-TIMP1, anti-CD63, and Vinculin antibodies showing secreted TIMP1 and CD63 binding on CD8+ T cells when cocultured with pSTAT3+ astrospheres. Cell lysates (first line) were immunoprecipitated with IgG isotype as the control (second line) and anti-CD63 (third line). F, Proximity ligation assay performed on a melanoma brain metastasis sample showing TIMP1 and CD63 in close molecular proximity on CD8+ T cells. Magnification showing red dots of TIMP1-CD63 interaction (white arrowheads) on a CD8+ T cell highlighted with a red arrowhead in the main picture. Scale bar, 10 μm. G, Schema of the experimental design. Wt or CD63null CD8+ T cells were used in ex vivo organotypic cultures with established B16/F10-BrM metastasis. H, Quantification of the BLI signal emitted by B16/F10-BrM cells in each brain slice normalized by the initial value obtained at time 0, before the addition of wt or CD63null CD8+ T cells. Values are shown in box-and-whisker plots in which every dot represents a different organotypic culture and the line in the box corresponds to the median. Whiskers go from minimum to maximum values (n = 8 no CD8+ T cells, 7 wt CD8+ T cells, and 10 CD63null CD8+ T cells independent organotypic cultures). Quantification is accompanied by representative images of wells containing brain organotypic cultures with established B16/F10-BrM metastases grown ex vivo for 24 hours. The image shows the BLI intensity in each condition for each brain slice. P values were calculated using the two-tailed t test. I, Heatmap generated with the qRT-PCR analysis performed on CD63highCD8+ T cells sorted from wt and cKOGFAP-Timp1 mice 10 days after intracranial injection of B16/F10-BrM cells. n = 12 brains per condition and six brains for control condition (not injected with BrM cells). J, Schema of the experimental design. CD8+ lymphocytes were cultured with STAT3 astrospheres CM and wt or cKOGFAP-Timp1 STAT3+ astrospheres CM and processed for phosphoproteomics analysis. K, Heatmap showing the top 10 enriched sequence motifs found in CD8+ T cells in the absence of TIMP1 from the CM of STAT3+ astrospheres. Clustering enrichment using Fisher exact test was performed. P value < 0.01, FDR < 2%. L, Quantification of the number of pERK+CD8+ T cells in control and cKOGFAP-Timp1 mice intracardially injected with E0771-BrM at the endpoint. Error bars, SEM. Every dot is a different animal (n = 3 brains per condition). M, Quantification of the number of pERK+CD8+ T cells in human brain metastases samples scored with multiplex. Violin plots show the median of percentage pERK+CD8+ T cells among the total CD8+ T cells per field of view (n = 5–10/patient) from three patients analyzed in each condition. P value was calculated using the two-tailed t test. N, Model summarizing main findings on the immunomodulatory role of TIMP1 derived from STAT3+ reactive astrocytes in brain metastasis. Secreted TIMP1 acts on its receptor CD63 receptor on the surface of CD8+ lymphocytes, modulating ERK-mediated signaling and downregulating activation of T-cell markers and cytolytic enzymes and upregulating exhaustion markers, thus affecting effective T-cell–mediated killing of brain metastatic cells.
Figure 7.
Figure 7.
A combined immunotherapy targeting local immunosuppression provides superior control of brain metastasis. A, Schema of the experimental design. C57BL/6J mice were intracardially injected with B16/F10-BrM cells, 3 days after the following treatments were administrated: IgG2 (10 mg/kg), silibinin daily (200 mg/kg), or ICB every 2 days (anti-PD1, 10 mg/kg, plus anti-CTLA4, 10 mg/kg) alone or in combination with silibinin. After 2 weeks, ex vivo analysis and histological analysis of different organs were performed. B, Representative images of control, ICB, silibinin, and ICB+silibinin–treated mice 2 weeks (endpoint) after intracardiac inoculation of B16/F10-BrM cells. In in vivo images, dotted lines surround the brain and lungs, showed in the ex vivo representative images below. Images show BLI intensity. C, Distribution of lesions according to size (small: <5e4 μm2, medium: 2.5e4 μm2 to 2e5 μm2, big: >2e5 μm2). Values are represented as percentage with respect to the total number of lesions per each experimental condition. n = 4 to 6 brains per condition. P values of the different comparison calculated using the two-tailed t test are shown in Supplementary Table S16. D, Representative images of perforin and Granzyme B staining at endpoint in brains from mice treated with ICB and ICB+silibinin. Arrowheads indicate positive staining. Scale bar, 50 μm. E, Quantification showing the number of cells expressing cytotoxic markers in D. Values are shown in box-and-whisker plots in which every dot is a different lesion (n = 6 lesions in three brains are quantified in ICB and n = 4 lesions in three brains are quantified in ICB+silibinin). P value was calculated using the two-tailed t test. F, Schema of the experimental design. Three days after intracranial inoculation of B16/F10-BrM cells, five doses of 3 Gy WBRT and IgG2 (10 mg/kg), silibinin daily (200 mg/kg), or ICB every 2 days (anti-PD1, 10 mg/kg, plus anti-CTLA4, 10 mg/kg) alone or in combination with silibinin were administrated. G, Kaplan–Meier curve showing survival proportions of mice without radiotherapy (dotted gray line, n = 12) and with radiotherapy (Rx; IgG2, red line, n = 8; ICB, blue line, n = 8; silibinin, gray line, n = 8; and ICB+silibinin, green line, n = 8). P value was calculated using log-rank (Mantel–Cox) test between Rx and Rx+ICB+silibinin groups. H, Representative images of cleaved caspase-3 staining of intracranially inoculated brains with B16/F10-BrM cells at endpoint from irradiated mice treated with ICB and ICB+silibinin. Scale bar, 75 μm; magnification, 25 μm. I, Quantification of experiment in H. Percentage of cleaved caspase-3 is normalized with tumor area. Values are shown in box-and-whisker plots in which every dot is a different field of view. Four brains per condition are quantified. P value was calculated using the two-tailed t test. J, Representative images of Ki67 (white arrowheads) and Ki67+ (red arrowheads) CD8+ T cells infiltrating brain metastases from mice intracranially inoculated with B16/F10-BrM cells and treated with radiotherapy with either ICB or ICB+silibinin. Scale bar, 25 μm. K, Quantification of experiment in J. Values are shown in box-and-whisker plots in which every dot is a different field of view. Three brains per condition are quantified. P value was calculated using the two-tailed t test. L, Quantification of TIMP1 levels measured in patients’ CSF. Noncancer control condition: n = 6 and brain metastasis condition: n = 12 (matched CSF samples from the same patients in Supplementary Fig. S9A) plus n = 2 unmatched CSF values. Each dot represents a different patient. Patients shown in N are colored in green. P value was calculated using the two-tailed t test. M and N, Schema of the strategy to perform an ex vivo proof-of-concept validation of TIMP1 as a biomarker of response to blockade of CD8+ T-cell local immunosuppression. Heatmap showing immune cluster category (according to total percentage of immune cells, and mean percentage of immune cells present in low immune cluster samples in Fig. 3G is used as reference), TIMP1 levels in the CSF (mean of TIMP1 levels in the CSF of noncancer patients is used as the reference) and response to anti-TIMP1 and anti-TIMP1+anti-CD8 (viability of cancer cells in percentage of Ki67+ cancer cells; IgG2 condition is used as the reference) in PDOCs of patients shown in L (green dots). Results from the PDOCs are in Fig. 4F and G and Supplementary Table S15. Represented values are shown in Supplementary Fig. S9C.

References

    1. Valiente M, Ahluwalia MS, Boire A, Brastianos PK, Goldberg SB, Lee EQ, et al. . The evolving landscape of brain metastasis. Trends Cancer 2018;4:176–96. - PMC - PubMed
    1. Margolin K, Ernstoff MS, Hamid O, Lawrence D, McDermott D, Puzanov I, et al. . Ipilimumab in patients with melanoma and brain metastases: an open-label, phase 2 trial. Lancet Oncol 2012;13:459–65. - PubMed
    1. Tawbi HA, Forsyth PA, Algazi A, Hamid O, Hodi FS, Moschos SJ, et al. . Combined nivolumab and ipilimumab in melanoma metastatic to the brain. N Engl J Med 2018;379:722–30. - PMC - PubMed
    1. Goldberg SB, Schalper KA, Gettinger SN, Mahajan A, Herbst RS, Chiang AC, et al. . Pembrolizumab for management of patients with NSCLC and brain metastases: long-term results and biomarker analysis from a non-randomised, open-label, phase 2 trial. Lancet Oncol 2020;21:655–63. - PMC - PubMed
    1. Gadgeel SM, Lukas RV, Goldschmidt J, Conkling P, Park K, Cortinovis D, et al. . Atezolizumab in patients with advanced non-small cell lung cancer and history of asymptomatic, treated brain metastases: exploratory analyses of the phase III OAK study. Lung Cancer 2019;128:105–12. - PubMed

Substances