. 2024 Sep 3;6(5):fcae291.
doi: 10.1093/braincomms/fcae291. eCollection 2024.

Visual mismatch negativity in Parkinson's psychosis and potential for testing treatment mechanisms

Affiliations

Visual mismatch negativity in Parkinson's psychosis and potential for testing treatment mechanisms

Miriam Vignando et al. Brain Commun. .

Abstract

Psychosis and visual hallucinations are a prevalent non-motor symptom of Parkinson's disease, negatively affecting patients' quality of life and constituting a greater risk for dementia. Understanding neural mechanisms associated to these symptoms is instrumental for treatment development. The mismatch negativity is an event-related potential evoked by a violation in a sequence of sensory events. It is widely considered an index of sensory change-detection. Reduced mismatch negativity response is one of the most replicated results in schizophrenia and has been suggested to be a superior psychosis marker. To understand whether this event-related potential component could be a similarly robust marker for Parkinson's psychosis, we used electroencephalography with a change-detection task to study the mismatch negativity in the visual modality in 20 participants with Parkinson's and visual hallucinations and 18 matched Parkinson's participants without hallucinations. We find that visual mismatch negativity is clearly present in participants with Parkinson's disease without hallucinations at both parieto-occipital and frontal sites, whereas participants with Parkinson's and visual hallucinations show reduced or no differences in the two waveforms, confirming the sensitivity of mismatch negativity to psychosis, even within the same diagnostic group. We also explored the relationship between hallucination severity and visual mismatch negativity amplitude, finding a negative correlation between visual hallucinations severity scores and visual mismatch negativity amplitude at a central frontal and a parieto-occipital electrodes, whereby the more severe or complex (illusions, formed visual hallucinations) the symptoms the smaller the amplitude. We have also tested the potential role of the serotonergic 5-HT2A cascade in visual hallucinations in Parkinson's with these symptoms, following the receptor trafficking hypothesis. We did so with a pilot study in healthy controls (N = 18) providing support for the role of the Gi/o-dependent pathway in the psychedelic effect and a case series in participants with Parkinson's and visual hallucinations (N = 5) using a double-blind crossover design. Positive results on psychosis scores and mismatch amplitude add further to the potential role of serotonergic modulation of visual hallucinations in Parkinson's disease.

Keywords: 5-HT2A; Parkinson’s disease; Parkinson’s psychosis; mismatch negativity; visual hallucinations.


Conflict of interest statement

The authors do not have any competing interests to declare.

Figures

Graphical Abstract
Graphical Abstract
Figure 1
Figure 1
Visual summary of the vMMN task. vMMN (visual mismatch negativity) task sequence of events and channels of interest in our analyses.
Figure 2
Figure 2
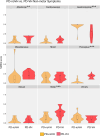
NMSQ (non-motor symptom questionnaire) by symptom cluster. ** P < 0.005, *** P = < 0.001 Median (blue dot) and interquartile range (black bar in the centre of each plot) are represented in the figure. We performed a one-way ANOVA with Hallucinations (Y/N) as between-subjects factor; PD-VH = 20, PD-noVH = 17; one PD-noVH had missing data for this questionnaire.
Figure 3
Figure 3
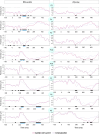
Results of within group ANOVA comparing standard versus deviant. Standard (violet) and deviant (pink) waveforms in PD-noVH and PD-VH in the within group ANOVA performed in EEGlab. The black bars indicate the latencies at which the two waveforms significantly differ (P < 0.05). The blue lines indicate the latencies at which such differences survive multiple comparisons correction (P-FDR < 0.05); multiple comparisons correction computed for each datapoint individually.
Figure 4
Figure 4
Within group scalp topography averaged across the 100–180 ms interval. Power spectra and event-related measures were computed for each group separately, with rare deviant/standard being entered as condition in a one-way ANOVA design. Multiple comparisons across channels were false discovery rate corrected (P-FDR < 0.05). When computing the analyses, a threshold was set so that only the electrodes where the rare deviant-standard difference was significant (correcting for multiple comparisons) were going to be displayed. Top row: scalp topography for PD-noVH. The channels represented with a red dot are those where a significant difference between standard and deviant (deviant was more negative posteriorly or more positive frontally) was found. Bottom row: the same analysis was used for PD-VH patients. The lateral insets show (clearly in PD-noVH) the parieto-occipital negative and frontal positive pattern we observed in the vMMN analysis (plots created with ggplot2 in R).
Figure 5
Figure 5
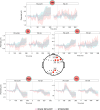
Results of the vMMN between groups analysis. Electrodes (red dots) that presented significant deviant-standard vMMN amplitude differences in the between-group ANOVAs (P < 0.05, corrected for multiple comparisons with the Benjamini–Hochberg correction). Standard (violet) and deviant (pink) waveforms for PD-VH (N = 20) and PD-noVH (N = 18). The shaded area represents the variance. vMMN amplitude was compared for the 100–180 ms interval for frontal electrodes and in the 100–125 ms for parieto-occipital electrodes.
Figure 6
Figure 6
NEVHI hallucination subtypes in the PD-VH group and clinical variables correlations. (A) Proportion of patients with a specific type of VH as detected by the NEVHI visual hallucinations semi-structured interview. (B) Pearson's product moment correlation coefficients for the clinical variables and neuropsychiatric assessments (PD-VH only). (Motor: SCOPA-Motor score).
Figure 7
Figure 7
Correlational analyses between mismatch amplitude in FZ and POZ and hallucinations severity. Spearman correlations between hallucination severity scores and mismatch amplitude. Left: SAPS-PD scores as a function of mismatch positivity and negativity at FZ after considering the sign of the mismatch between standard and deviant (N = 20). Right: NEVHI temporal severity for complex VH as a function of MMN for electrode POZ. We note that in this case values that correspond to a normal [rare deviant—standard] difference are negative in the case of POZ and in this study specifically positive for FZ (for the NEVHI analysis N = 17 PD-VH; we focussed only on those who had complex VH).
Figure 8
Figure 8
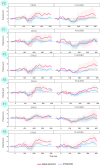
Standard and deviant waveforms for each participant enrolled in the drug study. Left column: frontal electrodes in the drug arm, Right column: frontal electrodes in the placebo arm. Deviant is shown in pink, standard in violet. The difference between the drug and placebo was captured in a comparison of individual peaks conducted using Wilcoxon signed ranked tests, whereby each participant acted as their own control, as described in the text; individual waveforms are displayed in Supplementary Information 10.

References

    1. Näätänen R, Kujala T, Kreegipuu K, et al. The mismatch negativity: An index of cognitive decline in neuropsychiatric and neurological diseases and in ageing. Brain. 2011;134:3435–3453. - PubMed
    1. Garrido MI, Kilner JM, Stephan KE, Friston KJ. The mismatch negativity: A review of underlying mechanisms. Neurophysiol Clin. 2009;120(3):453–463. - PMC - PubMed
    1. Feldman H, Friston KJ. Attention, uncertainty, and free-energy. Front Hum Neurosci. 2010;4:215. - PMC - PubMed
    1. Friston K. A theory of cortical responses. Philos Trans R Soc Lond B Biol Sci. 2005;360(1456):815–836. - PMC - PubMed
    1. Rao RP, Ballard DH. Predictive coding in the visual cortex: A functional interpretation of some extra-classical receptive-field effects. Nat Neurosci. 1999;2(1):79–87. - PubMed

LinkOut - more resources