. 2024 Sep 19;6(5):fcae321.
doi: 10.1093/braincomms/fcae321. eCollection 2024.

Age-related differences in human cortical microstructure depend on the distance to the nearest vein

Affiliations

Age-related differences in human cortical microstructure depend on the distance to the nearest vein

Christoph Knoll et al. Brain Commun. .

Abstract

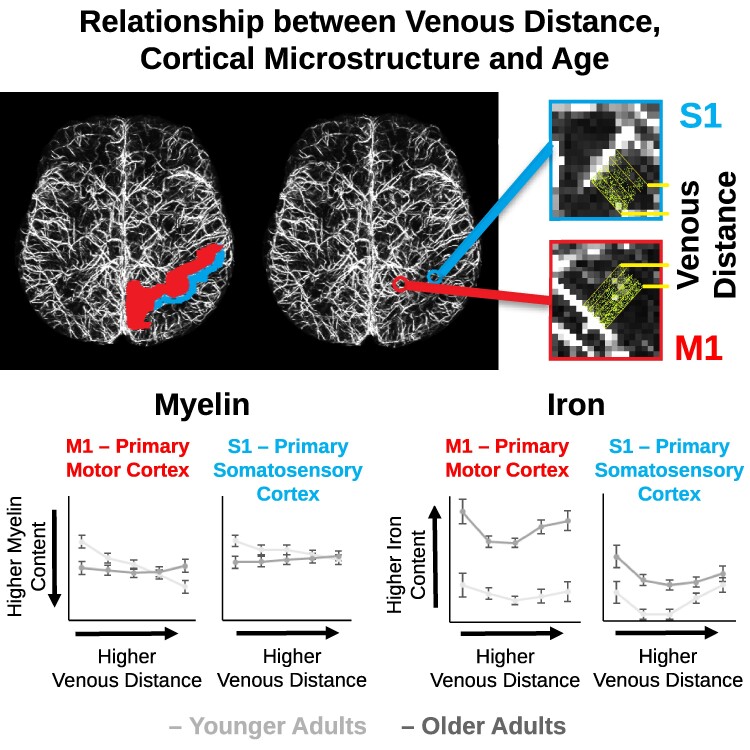
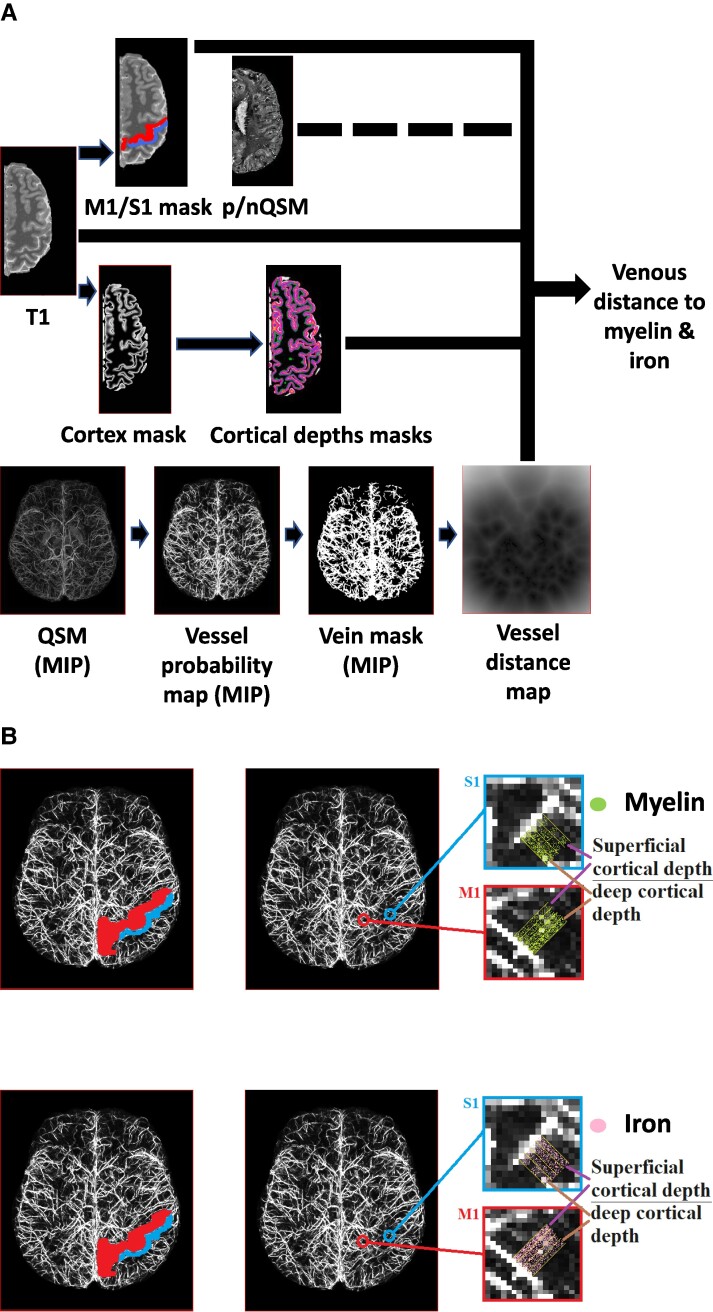
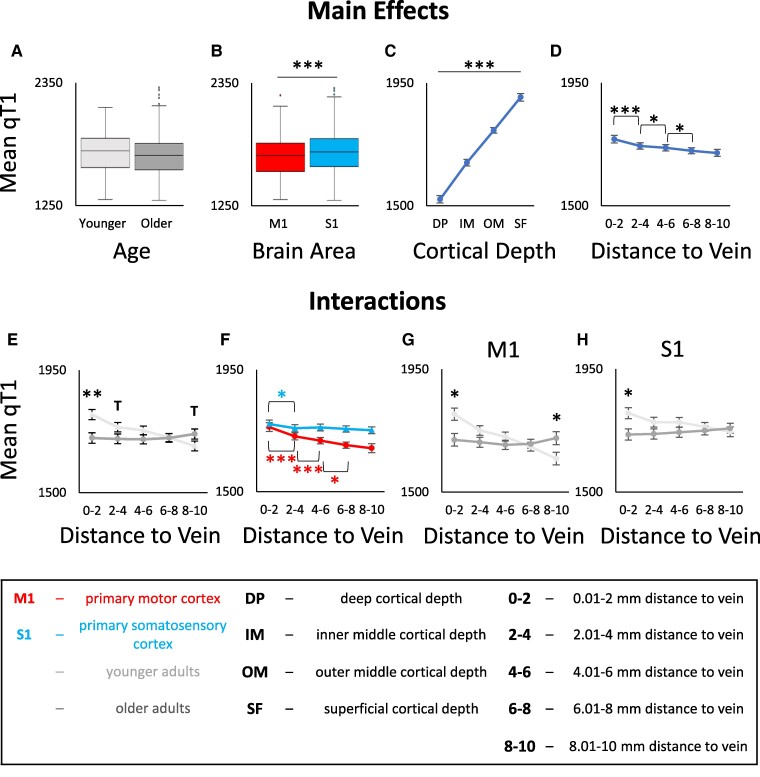
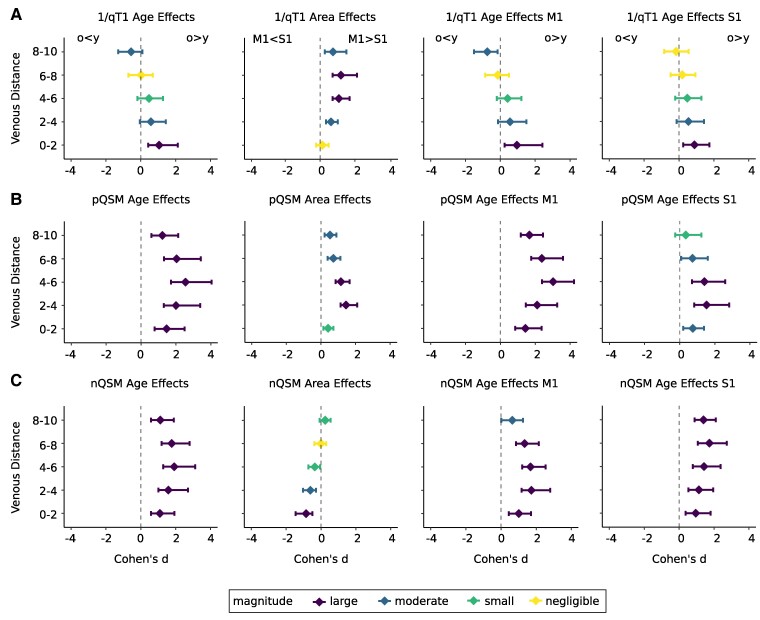
Age-related differences in cortical microstructure are used to understand the neuronal mechanisms that underlie human brain ageing. The cerebral vasculature contributes to cortical ageing, but its precise interaction with cortical microstructure is poorly understood. In a cross-sectional study, we combine venous imaging with vessel distance mapping to investigate the interaction between venous distances and age-related differences in the microstructural architecture of the primary somatosensory cortex, the primary motor cortex and additional areas in the frontal cortex as non-sensorimotor control regions. We scanned 18 younger adults and 17 older adults using 7 Tesla MRI to measure age-related changes in longitudinal relaxation time (T1) and quantitative susceptibility mapping (QSM) values at 0.5 mm isotropic resolution. We modelled different cortical depths using an equi-volume approach and assessed the distance of each voxel to its nearest vein using vessel distance mapping. Our data reveal a dependence of cortical quantitative T1 values and positive QSM values on venous distance. In addition, there is an interaction between venous distance and age on quantitative T1 values, driven by lower quantitative T1 values in older compared to younger adults in voxels that are closer to a vein. Together, our data show that the local venous architecture explains a significant amount of variance in standard measures of cortical microstructure and should be considered in neurobiological models of human brain organisation and cortical ageing.

Keywords: arteries; iron; laminar imaging; neurodegeneration; ultra-high field MRI.


Conflict of interest statement

The authors report no competing interests.

Figures

Graphical Abstract
Graphical Abstract
Figure 1
Figure 1
Overview methodology and analysis. (A) Quantitative T1 (qT1) and quantitative susceptibility mapping (QSM) images were sampled at different cortical depths (cortical depths masks) after cortex segmentation (cortex masks). Masks were applied to extract data from the primary motor cortex (M1, red mask) and primary somatosensory cortex (S1, blue mask). As a non-sensorimotor control region, data was extracted from the pre-frontal cortex (covering the superior frontal gyrus, SFG; the caudal middle frontal cortex, CMF; the rostral middle frontal cortex, RMF; not shown). QSM images (displayed as maximum intensity projections, MIP) were used to extract vessel probability maps (including intensity values between 0 and 1) to identify venous vasculature. A hysteresis filter was used to generate binarized vein masks before a Euclidean distance transformation was applied to compute the vessel distance map (VDM). Individual VDMs were multiplied with binarized cortical depth masks and then applied to the qT1 image before resulting parameter maps were multiplied with binarized M1/S1/SFG/CMF/RMF masks (analysis pathway shown as black lines). Please note that the same analysis pathway was applied to the positive QSM (pQSM) and negative QSM (nQSM) data (black dotted line). B: Shown are masks covering left M1 (red) and left S1 (blue) together with the vessel probability map of one example participant. Magnified images show extracted cortical depth compartments in relation to the distance to the nearest vein.
Figure 2
Figure 2
Interaction between age, brain area, cortical depth and venous distance for cortical quantitative T1 (qT1) values. qT1 values are given in milliseconds (lower values indicate higher myelin content). A: No significant main effect of age on qT1 values. Shown are medians, interquartile ranges and lower and upper quartiles for younger (n = 18, light grey) and older (n = 17, dark grey) adults. Dots above a box mark outliers. B: Significant main effect of brain area (i.e. primary motor cortex, M1 (red) and primary somatosensory cortex, S1 (blue)) on qT1 values. C: Significant main effect of cortical depth on qT1 values; dots represent mean qT1 values for the different cortical depths averaged across age groups, distances and brain areas. Error bars show standard errors of the mean (SEM). D: Significant main effect of venous distance on qT1 values (0–2 = 0.01–2 mm, 2–4 = 2.01–4 mm, 4–6 = 4.01–6 mm, 6–8 = 6.01–8 mm, 8–10 = 8.01–10 mm). E: Significant interaction effect between venous distance and age on qT1 values. F: Significant interaction effect between venous distance and brain area on qT1 values. G/H: Significant interaction effect between venous distance, age and brain area (G: data for M1, H: data for S1). Significant results of post hoc t-tests to follow-up mixed-effects ANOVA results (see Table 2 for statistical results) are marked by asterisks: * P ≤ 0.05, ** P ≤ 0.005, *** P ≤ 0.0005 (uncorrected). Trends above P = 0.05 are marked by a T.
Figure 3
Figure 3
Effect sizes for the effects of age and brain area on quantitative T1 (qT1), positive QSM (pQSM) and negative QSM (nQSM) values plotted in relation to venous distances. Effect sizes (coloured dots) are given as Cohen’s d (standardized difference between group means), venous distances are given in millimetres. qT1 and nQSM values were reversed before effect size calculations, so that larger effect sizes always indicate higher substance in older compared to younger adults (o > y) and in primary motor cortex (M1) compared to primary somatosensory cortex (S1) (M1 > S1). Different colours indicate the magnitude of the effect sizes (large effects: purple, moderate effects: blue, small effects: green, negligible effects: yellow). Horizontal lines indicate 95% confidence intervals. A: Effect sizes shown for 1/qT1 values. From left to right: age effects averaged across areas (S1 and M1), area effects averaged across age groups (younger and older adults), age effects for M1, age effects for S1. B: Same as in A but effect sizes shown for pQSM values. C: Same as in A but effect sizes shown for nQSM values.
Figure 4
Figure 4
Distribution of vascular health risks in older adults. Individual vascular health risks (i.e. binary variable indicating the presence of hypertension and/or signs of cerebral small vessel diseases according to the STRIVE-2 criteria; green: no risk, magenta: increased risk) shown in relation to the distance to the nearest vein (given in millimetres). A: Distribution of vascular health risks for older adults (n = 17) in primary motor cortex (M1) in relation to quantitative T1 values (qT1, given in milliseconds, i.e. ms). B: Same as in A but for positive QSM values (pQSM, given in parts per million, i.e. ppm). C: Same as in A but for negative QSM values (nQSM, given in ppm). D: Distribution of vascular health risks for older adults in primary somatosensory cortex (S1) in relation to qT1 values. E: Same as in D but for pQSM values. F: Same as in D but for nQSM values.
Figure 5
Figure 5
Interaction between age, brain region, cortical depth and venous distance for positive QSM (pQSM) values. A: Significant main effect of age on pQSM values. Shown are medians, interquartile ranges and lower and upper quartiles for younger (n = 18, light grey) and older (n = 17, dark grey) adults. Dots mark outliers. pQSM values are given in parts per million (higher values indicate higher iron content). B: Significant main effect of brain area (primary motor cortex, M1 (red); primary somatosensory cortex, S1 (blue)) on pQSM values. C: Significant main effect of cortical depth on pQSM values. Dots indicate mean pQSM values for different cortical depths averaged across age groups, distances and brain areas. Error bars indicate standard errors of the mean (SEM). D: Significant main effect of venous distance on pQSM values (0–2 = 0.01− 2 mm, 2–4 = 2.01–4 mm, 4–6 = 4.01–6 mm, 6–8 = 6.01–8 mm, 8–10 = 8.01–10 mm). E: No significant interaction effect between venous distance and age on pQSM values. F: No significant interaction effect between venous distance and brain area on pQSM values. G/H: No significant interaction effect between venous distance, age and brain area (G: data for M1, H: data for S1). Significant results of post hoc t-tests to follow-up mixed-effects ANOVA results (see Table 3 for statistical results) are marked by asterisks: * P ≤ 0.05, ** P ≤ 0.005, *** P ≤ 0.0005 (uncorrected). Trends above P = 0.05 are marked by a T.

Similar articles

Cited by

References

    1. Bernier M, Cunnane SC, Whittingstall K. The morphology of the human cerebrovascular system. Hum Brain Mapp. 2018;39(12):4962–4975. - PMC - PubMed
    1. Huck J, Wanner Y, Fan AP, et al. High resolution atlas of the venous brain vasculature from 7 T quantitative susceptibility maps. Brain Struct Funct. 2019;224(7):2467–2485. - PubMed
    1. Perosa V, Priester A, Ziegler G, et al. Hippocampal vascular reserve associated with cognitive performance and hippocampal volume. Brain. 2020;143(2):622–634. - PMC - PubMed
    1. Vockert N, Perosa V, Ziegler G, et al. Hippocampal vascularization patterns exert local and distant effects on brain structure but not vascular pathology in old age. Brain Commun. 2021;3(3):fcab127. - PMC - PubMed
    1. Schreiber S, Bernal J, Arndt P, et al. Brain vascular health in ALS is mediated through motor cortex microvascular integrity. Cells. 2023;12(6):957. - PMC - PubMed

LinkOut - more resources