

Single-voxel delay map from long-axial field-of-view PET scans
- PMID: 39355217
- PMCID: PMC11440851
- DOI: 10.3389/fnume.2024.1360326
Single-voxel delay map from long-axial field-of-view PET scans
Abstract
Objective: We present an algorithm to estimate the delay between a tissue time-activity curve and a blood input curve at a single-voxel level tested on whole-body data from a long-axial field-of-view scanner with tracers of different noise characteristics.
Methods: Whole-body scans of 15 patients divided equally among three tracers, namely [15O]H2O, [18F]FDG and [64Cu]Cu-DOTATATE, which were used in development and testing of the algorithm. Delay times were estimated by fitting the cumulatively summed input function and tissue time-activity curve with special considerations for noise. To evaluate the performance of the algorithm, it was compared against two other algorithms also commonly applied in delay estimation: name cross-correlation and a one-tissue compartment model with incorporated delay. All algorithms were tested on both synthetic time-activity curves produced with the one-tissue compartment model with increasing levels of noise and delays between the tissue activity curve and the blood input curve. Whole-body delay maps were also calculated for each of the three tracers with data acquired on a long-axial field-of-view scanner with high time resolution.
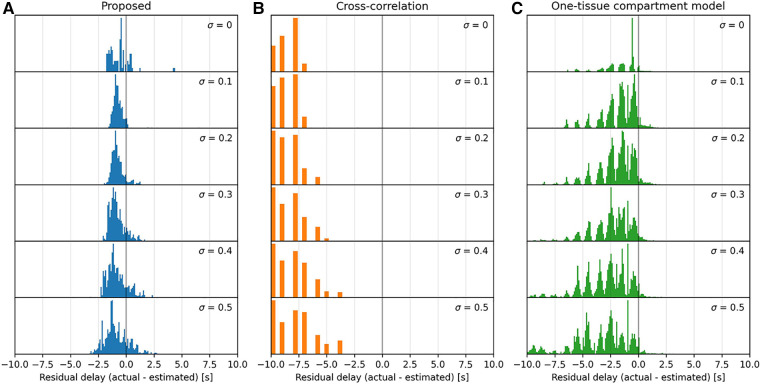
Results: Our proposed model performs better for low signal-to-noise ratio time-activity curves compared to both cross-correlation and the one-tissue compartment models for non-[15O]H2O tracers. Testing on synthetically produced time-activity curves showed only a small and even residual delay, while the one-tissue compartment model with included delay showed varying residual delays.
Conclusion: The algorithm is robust to noise and proves applicable on a range of tracers as tested on [15O]H2O, [18F]FDG and [64Cu]Cu-DOTATATE, and hence is a viable option offering the ability for delay correction across various organs and tracers in use with kinetic modeling.
Keywords: delay correction; delay map; dynamic whole-body PET; kinetic modeling; one-tissue compartmental modeling.
© 2024 Nielsen, Lindberg, Bordallo, Johnbeck, Law, Fischer, Andersen and Andersen.
Conflict of interest statement
The authors declare that the research was conducted in the absence of any commercial or financial relationships that could be construed as a potential conflict of interest.
Figures


References
-
- Watabe H, Jino H, Kawachi N, Teramoto N, Hayashi T, Ohta Y, et al. Parametric imaging of myocardial blood flow with 15O-water and PET using the basis function method. J Nucl Med. (2005) 46(7):1219–24. - PubMed
-
- Larsson HBW, Law I, Andersen TL, Andersen FL, Fischer BM, Vestergaard MB, et al. Brain perfusion estimation by Tikhonov model-free deconvolution in a long axial field of view PET/CT scanner exploring five different PET tracers. Eur J Nucl Med Mol Imaging. (2023) 51(3):707–20. 10.1007/s00259-023-06469-w - DOI - PMC - PubMed
-
- Bertoldo A, Rizzo G, Veronese M. Deriving physiological information from PET images: from SUV to compartmental modelling. Clin Transl Imaging. (2014) 2:239–51. 10.1007/s40336-014-0067-x - DOI
LinkOut - more resources
Full Text Sources