. 2024 Sep 17:15:1457690.
doi: 10.3389/fimmu.2024.1457690. eCollection 2024.

The iNKT cell ligand α-GalCer prevents murine septic shock by inducing IL10-producing iNKT and B cells

Affiliations

The iNKT cell ligand α-GalCer prevents murine septic shock by inducing IL10-producing iNKT and B cells

Yun Hoo Park et al. Front Immunol. .

Abstract

Introduction: α-galactosylceramide (α-GalCer), a prototypical agonist of invariant natural killer T (iNKT) cells, stimulates iNKT cells to produce various cytokines such as IFNγ and IL4. Moreover, repeated α-GalCer treatment can cause protective or pathogenic outcomes in various immune-mediated diseases. However, the precise role of α-GalCer-activated iNKT cells in sepsis development remains unclear. To address this issue, we employed a lipopolysaccharide (LPS)/D-galactosamine (D-GalN)-induced murine sepsis model and two alternative models.

Methods: Sepsis was induced in wild-type (WT) C57BL/6 (B6) mice by three methods (LPS/D-GalN, α-GalCer/D-GalN, and cecal slurry), and these mice were monitored for survival rates. WT B6 mice were intraperitoneally injected with α-GalCer or OCH (an IL4-biased α-GalCer analog) one week prior to the induction of sepsis. To investigate the effects of α-GalCer-mediated iNKT cell activation on sepsis development, immune responses were analyzed by flow cytometry using splenocytes and liver-infiltrating leukocytes. In addition, a STAT6 inhibitor (AS1517499) and an IL10 inhibitor (AS101) were employed to evaluate the involvement of IL4 or IL10 signaling. Furthermore, we performed B cell adoptive transfers to examine the contribution of α-GalCer-induced regulatory B (Breg) cell populations in sepsis protection.

Results: In vivo α-GalCer pretreatment polarized iNKT cells towards IL4- and IL10-producing phenotypes, significantly attenuating LPS/D-GalN-induced septic lethality in WT B6 mice. Furthermore, α-GalCer pretreatment reduced the infiltration of immune cells to the liver and attenuated pro-inflammatory cytokine production. Treatment with a STAT6 inhibitor was unable to modulate disease progression, indicating that IL4 signaling did not significantly affect iNKT cell-mediated protection against sepsis. This finding was confirmed by pretreatment with OCH, which did not alter sepsis outcomes. However, interestingly, prophylactic effects of α-GalCer on sepsis were significantly suppressed by treatment with an IL10 antagonist, suggesting induction of IL10-dependent anti-inflammatory responses. In addition to IL10-producing iNKT cells, IL10-producing B cell populations were significantly increased after α-GalCer pretreatment.

Conclusion: Overall, our results identify α-GalCer-mediated induction of IL10 by iNKT and B cells as a promising option for controlling the pathogenesis of postoperative sepsis.

Keywords: B cells; IL10; iNKT cells; sepsis; α-GalCer.


Conflict of interest statement

LVK is a scientific advisory board member of Isu Abxis Co., Ltd. Republic of Korea. The remaining authors declare that the research was conducted in the absence of any commercial or financial relationships that could be construed as a potential conflict of interest.

Figures
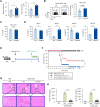
Figure 1
Figure 1
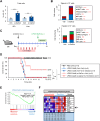
α-GalCer pretreatment alters iNKT cell subsets and attenuates sepsis severity. WT B6 mice were injected i.p. with α-GalCer (2 μg/mouse) and, seven days later, the spleens were harvested for the following analyses. (A) Weight and total cell number of spleens. (B) The frequency and cell number of splenic iNKT cells (α-GalCer/CD1d-dimer+CD3+). (C) The frequency of CD4+ iNKT cells in the spleen. (D) The relative frequencies of iNKT cell subsets (i.e., T-bet+ iNKT1, PLZF+ iNKT2, RORγt+ iNKT17, and E4BP4+ iNKT10 cells) were determined by flow cytometry. (E) Experimental outline: WT B6 mice were injected i.p. with α-GalCer (2 μg/mouse) and, seven days later, these mice were injected i.p. with LPS (2 µg/mouse) plus D-GalN (25 mg/mouse) for induction of sepsis. (F) Subsequently, these mice were monitored to evaluate their survival for three days. (G, H) H&E staining of liver sections (CV, central vein) (G) and serum levels of AST and ALT (H) were analyzed five hours after LPS/D-GalN injection. The mean values ± SD (n = 3 in (A–D, H); per group in the experiment; Student’s t-test; *p < 0.05, **p < 0.01, and ***p < 0.001) are shown. The survival rate was analyzed by Kaplan-Meier plots with a log-rank test (*p < 0.05). One representative experiment of two experiments is shown. ns, not significant.
Figure 2
Figure 2
α-GalCer pretreatment attenuates the pro-inflammatory cytokine production by immune cells. WT B6 mice were injected i.p. with α-GalCer (2 μg/mouse) and, seven days later, these mice were injected i.p. with LPS (2 µg/mouse) plus D-GalN (25 mg/mouse) for induction of sepsis. Five hours later, the spleens and livers from these mice were harvested for the following analyses. (A–F) The frequencies of IL1β- (A, B), IL17A- (C, D), and TNFα-expressing populations (E, F) among neutrophils (Gr1+ CD11b+), T cells (CD3+ NK1.1-), NK cells (CD3- NK1.1+), and NKT cells (CD3+ NK1.1+) in the spleen and liver. The mean values ± SD (n = 3 in (A–F); per group in the experiment; Student’s t-test; *p < 0.05, **p < 0.01, and ***p < 0.001) are shown. One representative experiment of two experiments is shown. ns, not significant.
Figure 3
Figure 3
The preventive effects of α-GalCer pretreatment on sepsis do not correlate with the IL4-STAT6 signaling pathway. WT B6 mice were injected i.p. with α-GalCer (2 μg/mouse) or OCH (2 μg/mouse) and, seven days later, the spleens were harvested. (A) The frequency and absolute cell number of splenic iNKT cells were determined by flow cytometry. (B) Flow cytometric analysis for the expression of transcription factors (T-bet, PLZF, RORγt, and E4BP4) by splenic iNKT cells. (C) WT B6 mice were injected i.p. with α-GalCer (2 μg/mouse) or OCH (2 μg/mouse) and, seven days later, mice were injected i.p. with LPS (2 µg/mouse) plus D-GalN (25 mg/mouse) for induction of sepsis. Subsequently, these mice were monitored to evaluate their survival for three days after LPS/D-GalN injection. (D) Experimental outline: WT B6 mice were injected i.p. with α-GalCer (2 μg/mouse) on day 0 and, seven days later, mice were injected i.p. with LPS (2 µg/mouse) plus D-GalN (25 mg/mouse) for induction of sepsis. To evaluate the effect of IL4 signaling on α-GalCer-mediated attenuation of sepsis, WT B6 mice were injected i.p. four times with a STAT6 inhibitor (AS1517499, 10mg/kg) every other day starting from day 0. (E) Subsequently, these mice were monitored to evaluate their survival for three days after LPS/D-GalN injection. The mean values ± SD (n = 4 in (A, B); per group in the experiment; Student’s t-test; **p < 0.01 and ***p < 0.001) are shown. The survival rate was analyzed by Kaplan-Meier plots with a log-rank test (**p < 0.01 and ***p < 0.001). One representative experiment of two experiments is shown. ns, not significant.
Figure 4
Figure 4
The preventive effects of α-GalCer pretreatment correlate with the expansion of IL10+ immune cells. WT B6 mice were injected i.p. with α-GalCer (2 μg/mouse) and, seven days later, the spleens and livers were harvested for the following analyses. (A) The frequency of IL10+ cells in the spleen and liver. (B) The absolute cell numbers of IL10-producing cells (i.e., T cells, B cells, DCs, macrophages, iNKT cells, and others) in the spleen and liver were determined by flow cytometry. (C) Experimental outline: WT B6 mice were injected i.p. with α-GalCer (2 μg/mouse) on day 0. Subsequently, these mice were injected i.p. with an IL10 inhibitor (AS101, 10 μg/mouse) daily for one week starting from day 0. On day 7, these mice were injected i.p. with LPS (2 µg/mouse) plus D-GalN (25 mg/mouse) for induction of sepsis. (D) Subsequently, these mice were monitored to evaluate their survival for three days after LPS/D-GalN injection. (E, F) Comparison of transcriptional profiles of inflammatory response genes in PBMCs of either non-survivors (red) or survivors (blue) of sepsis in human subjects by relevant gene set enrichment plots from GSEA (NES, normalized enrichment score; FDR, false discovery rate). The mean values ± SD (n = 4 in (A, B); per group in the experiment; Student’s t-test; *p < 0.05, **p < 0.01, and ***p < 0.001) are shown. The survival rate was analyzed by Kaplan-Meier plots with a log-rank test (*p < 0.05 and **p < 0.01). One representative experiment of two experiments is shown. ns, not significant.
Figure 5
Figure 5
α-GalCer pretreatment expands IL10-producing B cells. WT B6 mice were injected i.p. with α-GalCer (2 μg/mouse) and, seven days later, the spleens and livers were harvested for the following analyses. (A, B) The total CD19+ B cell numbers (A) and the frequency and absolute cell numbers (B) of IL10-producing B cells in the spleen and liver. (C) The frequencies of B cell subsets (FOB, MZB, and B1 cells) in the spleen and liver. (D, E) The frequencies (D) and absolute cell numbers (E) of IL10-producing B cell subsets (FOB, MZB, and B1 cells) in the spleen and liver. (F) Experimental outline: WT B6 mice were injected i.p. with α-GalCer (2 μg/mouse) and, seven days later, splenic CD19+ B cells were isolated by the MACS system. Subsequently, MACS-purified CD19+ B cells (5 × 10⁶ cells/mouse) were adoptively transferred to recipient mice. The recipient mice were injected i.p. with LPS (2 µg/mouse) plus D-GalN (25 mg/mouse) for induction of sepsis. (G) Subsequently, these mice were monitored to evaluate their survival for 3 days after LPS/D-GalN. The mean values ± SD (n = 4 in (A, B, D, E); per group in the experiment; Student’s t-test; *p < 0.05, **p < 0.01, and ***p < 0.001) are shown. The survival rate was analyzed by Kaplan-Meier plots with a log-rank test (*p < 0.05 and **p < 0.01). One representative experiment of two experiments is shown. ns, not significant.

Similar articles

References

    1. Liu V, Escobar GJ, Greene JD, Soule J, Whippy A, Angus DC, et al. . Hospital deaths in patients with sepsis from 2 independent cohorts. JAMA. (2014) 312:90–2. doi: 10.1001/jama.2014.5804 - DOI - PubMed
    1. Hotchkiss RS, Moldawer LL, Opal SM, Reinhart K, Turnbull IR, Vincent JL. Sepsis and septic shock. Nat Rev Dis Primers. (2016) 2:16045. doi: 10.1038/nrdp.2016.45 - DOI - PMC - PubMed
    1. Kinjo Y, Illarionov P, Vela JL, Pei B, Girardi E, Li X, et al. . Invariant natural killer T cells recognize glycolipids from pathogenic gram-positive bacteria. Nat Immunol. (2011) 12:966–74. doi: 10.1038/ni.2096 - DOI - PMC - PubMed
    1. Lee SW, Park HJ, Van Kaer L, Hong S, Hong S. Graphene oxide polarizes inkt cells for production of tgfβ and attenuates inflammation in an inkt cell-mediated sepsis model. Sci Rep. (2018) 8:10081. doi: 10.1038/s41598-018-28396-9 - DOI - PMC - PubMed
    1. Leung B, Harris HW. Nkt cells in sepsis. Clin Dev Immunol. (2010) 2010:414650. doi: 10.1155/2010/414650 - DOI - PMC - PubMed

LinkOut - more resources