. 2024 Oct 1;8(10):e2024GH001078.
doi: 10.1029/2024GH001078. eCollection 2024 Oct.

Blowin' in the Wind: Mapping the Dispersion of Metal(loid)s From Atacama Mining

Affiliations

Blowin' in the Wind: Mapping the Dispersion of Metal(loid)s From Atacama Mining

Nicolás C Zanetta-Colombo et al. Geohealth. .

Abstract

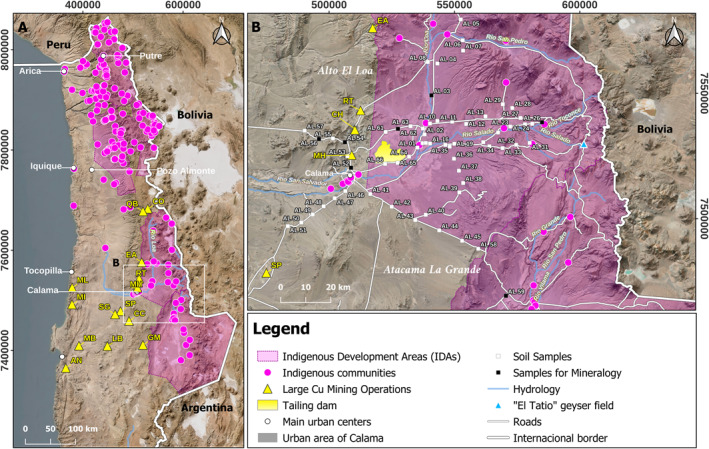
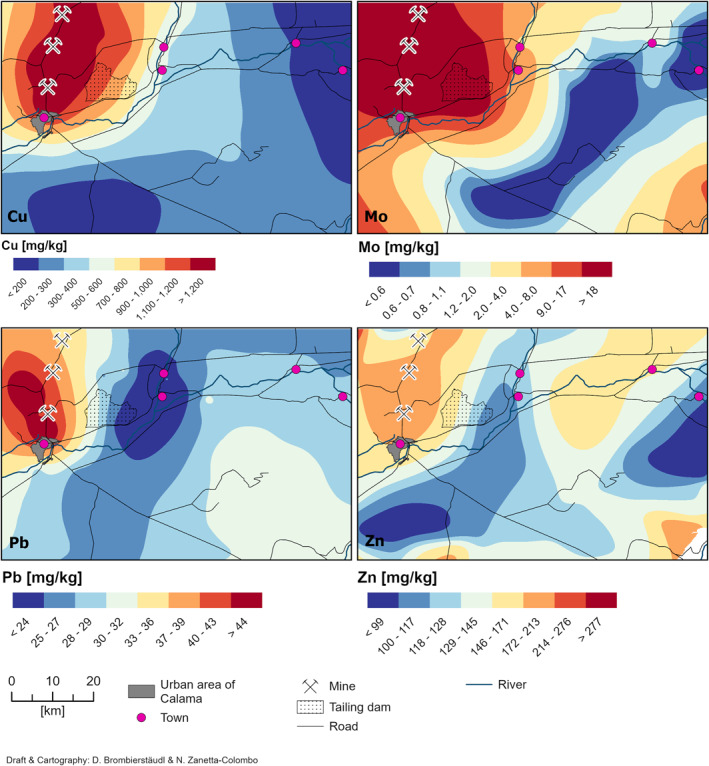
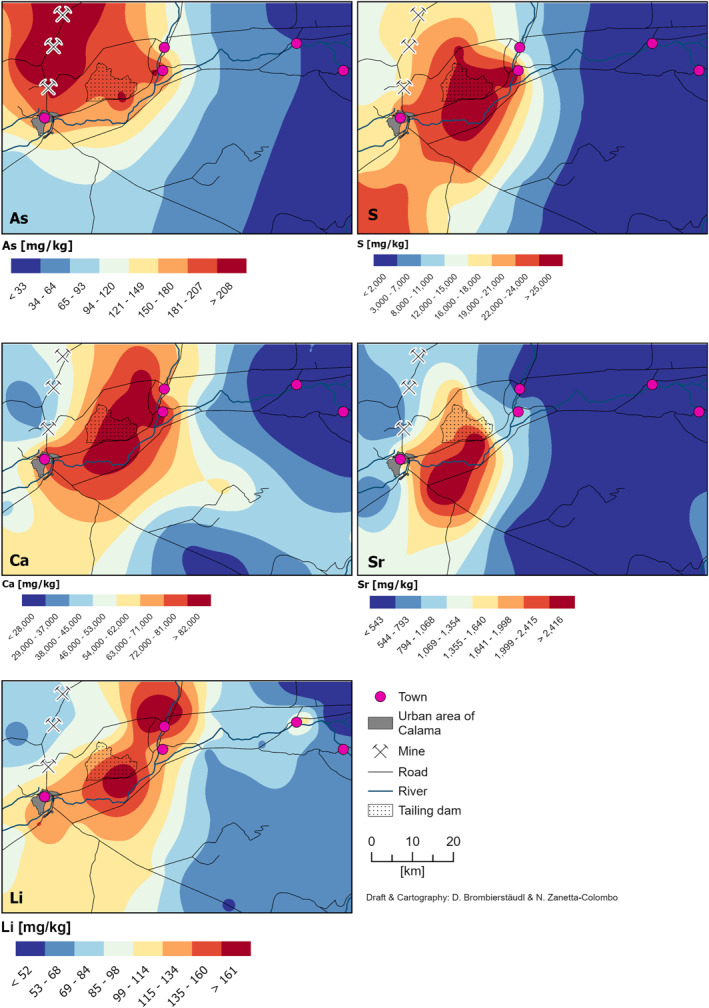
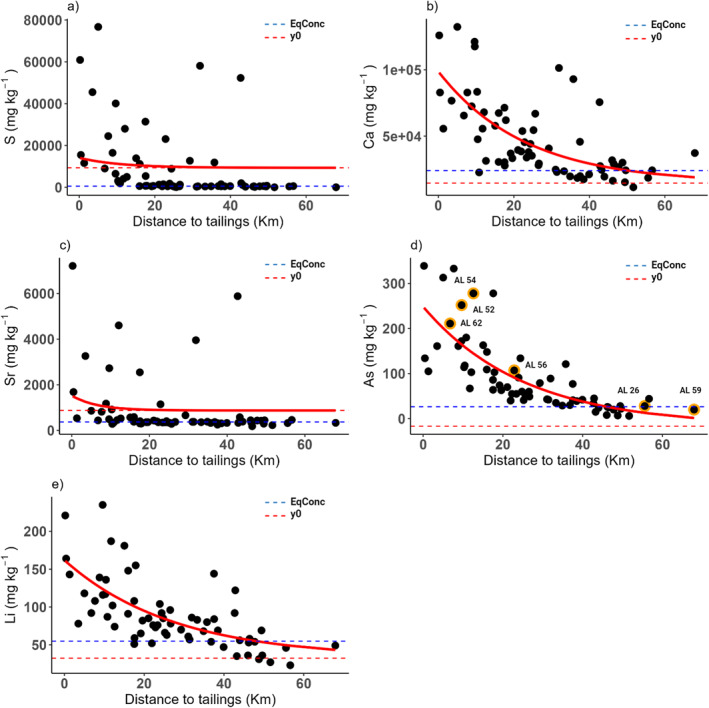
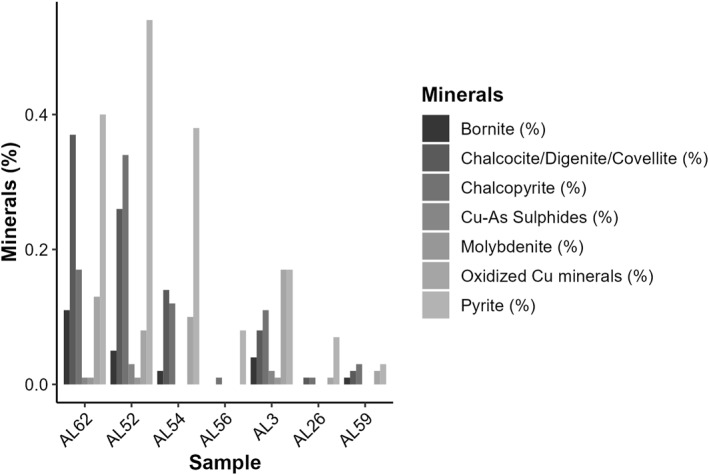
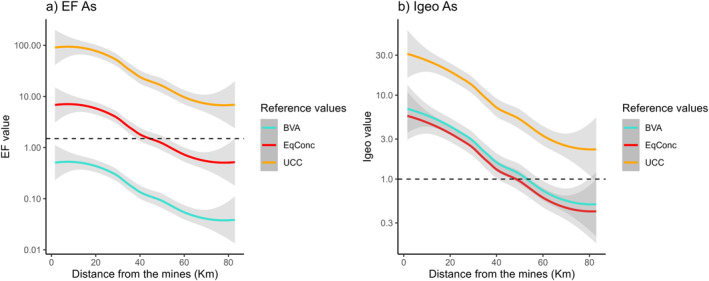
The Atacama Desert's naturally elevated metal(loid)s pose a unique challenge for assessing the environmental impact of mining, particularly for indigenous communities residing in these areas. This study investigates how copper mining influences the dispersion of these elements in the wind-transportable fraction (<75 μm) of surface sediments across an 80 km radius. We employed a multi-pronged approach, utilizing spatial modeling to map element distributions, exponential decay analysis to quantify concentration decline with distance, regime shift modeling to identify dispersion pattern variations, and pollution assessment to evaluate impact. Our results reveal significant mining-driven increases in surface concentrations of copper (Cu), molybdenum (Mo), and arsenic (As). Notably, within the first 20 km, concentrations peaked at 1,016 mg kg⁻1 for Cu, 31 mg kg⁻1 for Mo, and a remarkable 165 mg kg⁻1 for As. Cu and Mo displayed significant dispersion, extending up to 50 km from the source. However, As exhibited the most extensive reach, traveling up to 70 km downwind, highlighting the far-reaching ecological footprint of mining operations. Mineralogical analyses corroborated these findings, identifying mining-related minerals in surface sediments far beyond the immediate mining area. Although pollution indices based on the proposed Local Geochemical Background reveal significant contamination across the study area, establishing accurate pre-industrial baseline values is essential for a more reliable assessment. This study challenges the concept of "natural pollution" by demonstrating that human activities exacerbate baseline metal(loid)s levels. Expanding monitoring protocols is imperative to comprehensively assess the combined effects of multiple emission sources, including mining and natural processes, in safeguarding environmental and human health for future generations.

Keywords: Atacama Desert; environmental protection; indigenous communities; mining impact; soils; spatial distribution.


Conflict of interest statement

The authors declare no conflicts of interest relevant to this study.

Figures

Figure 1
Figure 1
Regional and local settings. The map shows (a) the general view of northern Chile, highlighting the extensive distribution of mining sites, cities, protected indigenous areas and communities, and the location of the air quality stations of the national network. (b) Study area, including surface sediment sampling sites and potential sources of contaminants. Note that while the main mining sites are outside the protected area (IDA), the Talabre tailings impoundment is located within it. In (b), from north to south: EA = El Abra; RT = Radomiro Tomic; CH = Chuquicamata; MH = Ministro Hales; and SP = Spence. Other operations in (a), CO = Collahuasi; QB = Quebrada Blanca; ML = Mantos de la Luna; ML = Michilla; SG = Sierra Gorda; CC = Centinela; GM = Gabriela Mistral; LB = Lomas Bayas; MB = Mantos Blancos; and AN = Alto Norte.
Figure 2
Figure 2
Spatial Distribution of copper (Cu), molybdenum (Mo), lead (Pb), and zinc (Zn) concentrations (PC2) in the wind transportable fraction (wtf) extracted from sediments in Alto El Loa, relative to potential emission sources.
Figure 3
Figure 3
Spatial Distribution of arsenic (As), sulfur (S), calcium (Ca), strontium (Sr), and Lithium (Li) concentrations (PC3) in the wind transportable fraction (wtf) extracted from sediments in Alto El Loa, relative to potential emission sources.
Figure 4
Figure 4
Scatter plots of metal concentrations in the wind‐transportable fraction (wtf) in sediments of the Alto El Loa IDA (n = 64) corresponding to an increasing distance from the mine tailing dam for Cu, Mo, As, Pb, and Zn (PC2). Red trend lines depict exponential decay models. The horizontal dashed red line represents the plateau (y0) obtained from the model, while the dashed blue line indicates the Equilibrium Concentration (EqConc) post‐regimen shift analysis. Samples highlighted in orange were used for detailed mineralogical analyses (see Section 3.3.2).
Figure 5
Figure 5
Scatter plots of metal concentrations in the wind‐transportable fraction (wtf) in sediments of the Alto El Loa IDA (n = 64) corresponding to an increasing distance from the mine tailing dam for S, Ca, Sr, As, and Li (PC3). Red trend lines depict exponential decay models. The horizontal dashed red line represents the plateau (y0) obtained from the model, while the dashed blue line indicates the Equilibrium Concentration (EqConc) post‐regimen shift analysis. Samples highlighted in orange were used for detailed mineralogical analyses (see Section 3.3.2).
Figure 6
Figure 6
Mineralogy (sulfide phases) of the <75 μm fraction (wtf) of selected surface sediment samples as a function of the distance from the possible pollution sources (Distance < 20 km: Samples Al62, AL52, and AL54; Distance 20–40 km: Samples Al56 and AL3; Distance >40 km: Samples Al26 and AL59). See Figure 1 for the location of the samples used for this analysis.
Figure 7
Figure 7
Comparison of contamination index results for arsenic using different reference levels. (a) Enrichment Factor (EF) and (b) Geoaccumulation Index (Igeo). In the legend, BVA corresponds to the geochemical background values of the Antofagasta region and UCC to those of the Upper Continental Crust. The values proposed as Equilibrium Concentration, EqConc are presented with the red curve.

References

    1. Agyeman, P. C. , Kebonye, N. M. , John, K. , Borůvka, L. , Vašát, R. , & Fajemisim, O. (2022). Prediction of nickel concentration in peri‐urban and urban soils using hybridized empirical Bayesian kriging and support vector machine regression. Scientific Reports, 12(1), 3004. Article 1. 10.1038/s41598-022-06843-y - DOI - PMC - PubMed
    1. Alam, M. A. , Mukherjee, A. , Bhattacharya, P. , & Bundschuh, J. (2023). An appraisal of the principal concerns and controlling factors for Arsenic contamination in Chile. Scientific Reports, 13(1), 11168. Article 1. 10.1038/s41598-023-38437-7 - DOI - PMC - PubMed
    1. Ambrus, J. (1977). Geology of the El Abra porphyry copper deposit, Chile. Economic Geology, 72(6), 1062–1085. 10.2113/gsecongeo.72.6.1062 - DOI
    1. Apata, M. , Arriaza, B. , Llop, E. , & Moraga, M. (2017). Human adaptation to arsenic in Andean populations of the Atacama Desert. American Journal of Physical Anthropology, 163(1), 192–199. 10.1002/ajpa.23193 - DOI - PubMed
    1. Aránguiz‐Acuña, A. , Luque, J. A. , Pizarro, H. , Cerda, M. , Heine‐Fuster, I. , Valdés, J. , et al. (2020). Aquatic community structure as sentinel of recent environmental changes unraveled from lake sedimentary records from the Atacama Desert, Chile. PLoS One, 15(2), e0229453. 10.1371/journal.pone.0229453 - DOI - PMC - PubMed

LinkOut - more resources