. 2024 Sep 16:11:1398114.
doi: 10.3389/fcvm.2024.1398114. eCollection 2024.

Cellular and extracellular proteomic profiling of paradoxical low-flow low-gradient aortic stenosis myocardium

Affiliations

Cellular and extracellular proteomic profiling of paradoxical low-flow low-gradient aortic stenosis myocardium

Manar Elkenani et al. Front Cardiovasc Med. .

Abstract

Aims: Patients with severe aortic stenosis (AS), low transvalvular flow (LF) and low gradient (LG) with normal ejection fraction (EF)-are referred to as paradoxical LF-LG AS (PLF-LG). PLF-LG patients develop more advanced heart failure symptoms and have a worse prognosis than patients with normal EF and high-gradient AS (NEF-HG). Despite its clinical relevance, the mechanisms underlying PLF-LG are still poorly understood.

Methods: Left ventricular (LV) myocardial biopsies of PLF-LG (n = 5) and NEF-HG patients (n = 6), obtained during transcatheter aortic valve implantation, were analyzed by LC-MS/MS after sequential extraction of cellular and extracellular matrix (ECM) proteins using a three-step extraction method. Proteomic data are available via ProteomeXchange with identifier PXD055391.

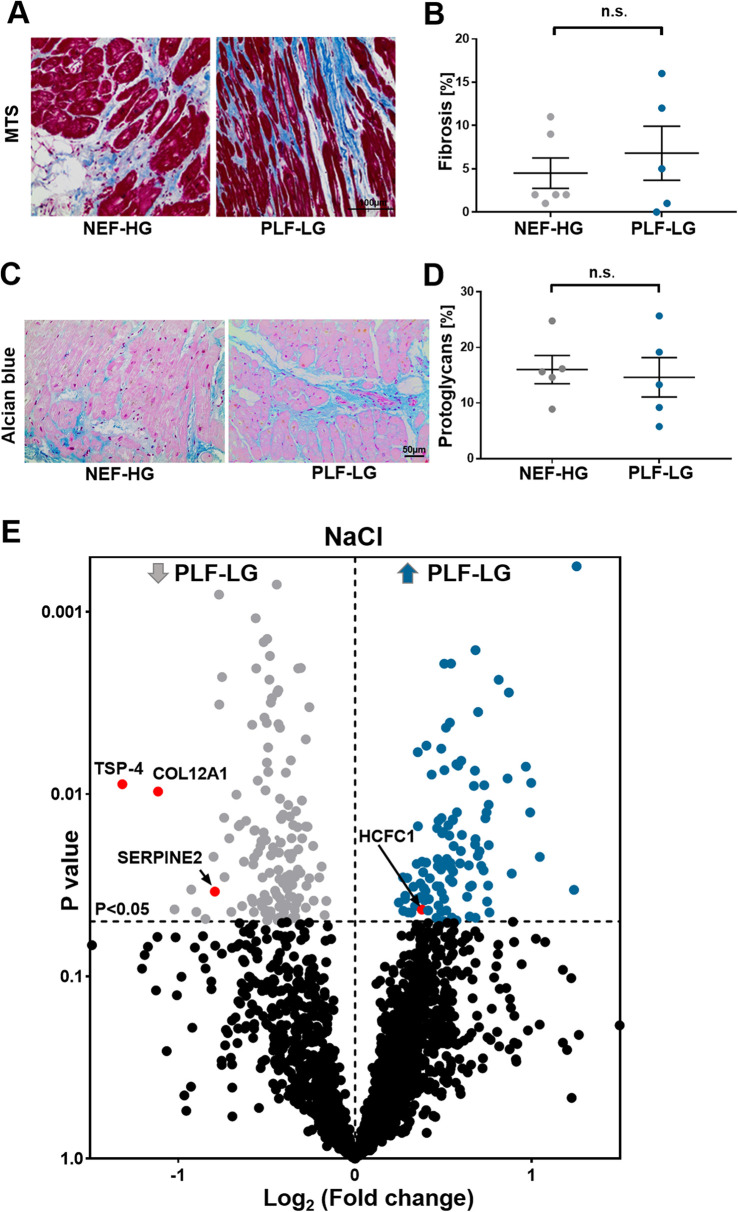
Results: 73 cellular proteins were differentially abundant between the 2 groups. Among these, a network of proteins related to muscle contraction and arrhythmogenic cardiomyopathy (e.g., cTnI, FKBP1A and CACNA2D1) was found in PLF-LG. Extracellularly, upregulated proteins in PLF-LG were related to ATP synthesis and oxidative phosphorylation (e.g., ATP5PF, COX5B and UQCRB). Interestingly, we observed a 1.3-fold increase in cyclophilin A (CyPA), proinflammatory cytokine, in the extracellular extracts of PLF-LG AS patients (p < 0.05). Consistently, immunohistochemical analysis confirmed its extracellular localization in PLF-LG AS LV sections along with an increase in its receptor, CD147, compared to the NEF-HG AS patients. Levels of core ECM proteins, namely collagens and proteoglycans, were comparable between groups.

Conclusion: Our study pinpointed novel candidates and processes with potential relevance in the pathophysiology of PLF-LG. The role of CyPA in particular warrants further investigation.

Keywords: cellular and extracellular matrix proteomics; myocardial biopsies; normal ejection fraction high-gradient aortic stenosis; paradoxical low-flow low-gradient aortic stenosis; transcatheter aortic valve implantation (TAVI).


Conflict of interest statement

The authors declare that the research was conducted in the absence of any commercial or financial relationships that could be construed as a potential conflict of interest.

Figures

Figure 1
Figure 1
Proteomic profiling of cellular protein extracts from PLF-LG and NEF-HG patients. (A) Volcano plot of the quantified TMT labelled cellular proteins following SDS extraction. The X-axis represents the log2 fold change ratio (PLF-LG/NEF-HG) plotted against its significance level (p value). The blue and the grey dots represent the up- and downregulated proteins in PLF-LG vs. NEF-HG. n = 5 (PLF-LG) and 6 (NEF-HG). Proteins of interest with essential cardiac functions are additionally highlighted as red dots. (B) GO cellular component enrichment analysis of downregulated proteins in PLF-LG vs. NEF-HG. Y-axis represents the enriched GO terms, X-axis the number of downregulated DAPs. The color indicates the p value following Benjamini-Hochberg correction. (C) Protein-protein interaction network of differentially abundant proteins (DAPs) in PLF-LG vs. NEF-HG. Network nodes represent proteins and edges reflect physical and/or functional interactions of proteins. Node color reflects the protein abundance ratio (log2 fold change) ranging from low (blue) to high (red). Node size is proportional to node degree (i.e., number of edges adjacent to the node). Border color indicates cluster membership of each node.
Figure 2
Figure 2
ECM proteomic profiling in LV biopsies from PLF-LG and NEF-HG patients. (A) Representative histological sections using Masson's trichrome staining (MTS) to assess fibrotic regions (blue). Scale bar: 100 μm. (B) Quantification of fibrotic area (% area). Data are presented as mean ± SEM, unpaired Student's t-test was used for statistical analysis, n. s., not significant. (C) Representative images of alcian blue staining showing proteoglycan accumulation (blue color). Scale bar: 50 μm. (D) Quantification of total accumulated proteoglycans (% area). Data are presented as mean ± SEM, unpaired Student's t-test was used for statistical analysis, n. s., not significant. (E) Volcano plots of the NaCl extraction. The X-axis represents the log2 fold change ratio (PLF-LG/NEF-HG) plotted against its significance level (p value). The blue and the grey dots represent the up- and the downregulated proteins in PLF-LG. n = 5 (PLF-LG) and 5 (NEF-HG). Proteins of interest with essential cardiac functions are additionally highlighted as red dots.
Figure 3
Figure 3
Analysis of non-ECM protein in the extracellular extracts (naCl and guHCl) in PLF-LG. Further analysis was performed in results from NaCl extracts. Bar graphs show the top ten most enriched GO terms of biological process category (A), cellular component category (B), and molecular function category (C) Y-axis represents the enriched GO terms; X-axis represents the number of downregulated DAPs in each term. The color indcates the p value following Benjamini-Hochberg correction. (D) Volcano plots of the GuHCl extraction. The X-axis represents the log2 fold change ratio (PLF-LG/NEF-HG) plotted against its significance level (p value). The blue and the grey dots represent the up- and the downregulated proteins in PLF-LG. Proteins of interest with essential cardiac functions are additionally highlighted as red dots. (E) Violin plot of CyPA abundance level in PLF-LG vs. NEF-HG. Dashed line indicates median; dotted lines indicate quartiles. Unpaired Student's t-test was used for statistical analysis; *p < 0.05 between the groups. n = 5 (PLF-LG) and 5 (NEF-HG).
Figure 4
Figure 4
Subcellular myocardial localization of cyclophilin A (CyPA) and its receptor emmprin in PLF-LG and NEF-HG. Representative histological images showing LV myocardial sections immunostained for CyPA (A) and Emmprin (B) Positive immunolocalization for CyPA and Emmprin is indicated by brown staining, and histology/nuclear localization is indicated by blue-violet hematoxylin counter stain (n = 5/group).

References

    1. Eleid MF, Sorajja P, Michelena HI, Malouf JF, Scott CG, Pellikka PA. Flow-gradient patterns in severe aortic stenosis with preserved ejection fraction: clinical characteristics and predictors of survival. Circulation. (2013) 128:1781–9. 10.1161/CIRCULATIONAHA.113.003695 - DOI - PMC - PubMed
    1. Cavaca R, Teixeira R, Vieira MJ, Gonçalves L. Paradoxical aortic stenosis: a systematic review. Rev Port Cardiol (English Ed). (2017) 36:287–305. 10.1016/j.repce.2016.09.007 - DOI - PubMed
    1. Vahanian A, Alfieri O, Andreotti F, Antunes MJ, Barón-Esquivias G, Baumgartner H, et al. Guidelines on the management of valvular heart disease (version 2012). Eur Heart J. (2012) 33:2451–96. 10.1093/eurheartj/ehs109 - DOI - PubMed
    1. Puls M, Beuthner BE, Topci R, Vogelgesang A, Bleckmann A, Sitte M, et al. Impact of myocardial fibrosis on left ventricular remodelling, recovery, and outcome after transcatheter aortic valve implantation in different haemodynamic subtypes of severe aortic stenosis. Eur Heart J. (2020) 41:1903–14. 10.1093/eurheartj/ehaa033 - DOI - PMC - PubMed
    1. Garbi M, MacCarthy P, Shah AM, Chambers JB. Classical and paradoxical low-flow low-gradient aortic stenosis: a heart failure perspective. Struct Hear. (2018) 2:3–9. 10.1080/24748706.2017.1384876 - DOI

LinkOut - more resources