. 2024 Aug;86(3):435-451.
doi: 10.18999/nagjms.86.3.435.

Crucial roles of exosomes secreted from ganglioside GD3/GD2-positive glioma cells in enhancement of the malignant phenotypes and signals of GD3/GD2-negative glioma cells

Affiliations

Crucial roles of exosomes secreted from ganglioside GD3/GD2-positive glioma cells in enhancement of the malignant phenotypes and signals of GD3/GD2-negative glioma cells

Mohammad Abul Hasnat et al. Nagoya J Med Sci. 2024 Aug.

Abstract

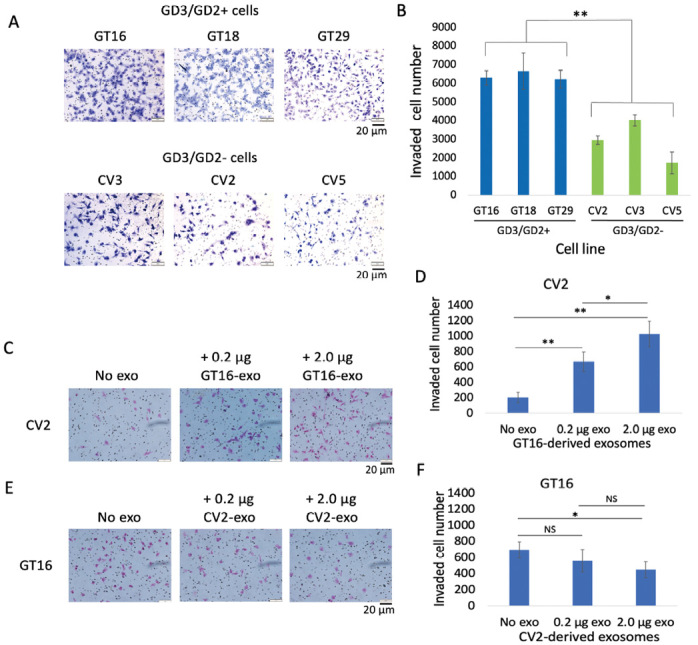
Neuroectoderm-derived tumors characteristically express gangliosides such as GD3 and GD2. Many studies have reported that gangliosides GD3/GD2 enhance malignant phenotypes of cancers. Recently, we reported that human gliomas expressing GD3/GD2 exhibited enhanced malignant phenotypes. Here, we investigated the function of GD3/GD2 in glioma cells and GD3/GD2-expressing glioma-derived exosomes. As reported previously, transfectant cells of human glioma U251 MG expressing GD3/GD2 showed enhanced cancer phenotypes compared with GD3/GD2-negative controls. When GD3/GD2-negative cells were treated with exosomes secreted from GD3/GD2-positive cells, clearly increased malignant properties were observed. Furthermore, increased phosphorylation of signaling molecules was detected after 5-15 min of exosome treatment, ie, higher tyrosine phosphorylation of platelet-derived growth factor receptor, focal adhesion kinase, and paxillin was found in treated cells than in controls. Phosphorylation of extracellular signal-regulated kinase-1/2 was also enhanced. Consequently, it is suggested that exosomes secreted from GD3/GD2-positive gliomas play important roles in enhancement of the malignant properties of glioma cells, leading to total aggravation of heterogenous cancer tissues, and also in the regulation of tumor microenvironments.

Keywords: exosome; ganglioside; glioma; malignancy.


Conflict of interest statement

The authors declare that they have no conflict of interest.

Figures

Fig. 1
Fig. 1
Biosynthesis pathway of gangliosides and expression levels of GD3 and GD2 on GD3 synthase cDNA transfected cells and on control cells Fig. 1A: The ganglioside synthetic pathway and cDNAs of synthetic enzymes used to establish transfectant cells. Fig. 1B: Cell surface expression of GD3/GD2 on the established GD3/GD2(+) and GD3/GD2(–) clones as analyzed by flow cytometry.
Fig. 2
Fig. 2
Expression of GD3, GD2 and tetraspanins on transfectant cells and EVs Fig. 2A: Expression of tetraspanins on GD3/GD2+ GT16 cells and on GD3/GD2– CV2 cells as analyzed by flow cytometry. Anti-CD81, anti-CD63, and anti-CD9 mAbs were used as primary antibodies, and FITC-labeled secondary antibody was employed. Fig. 2B: Expression of tetraspanins and gangliosides on exosomes was analyzed using Tim4 beads flow cytometry as described in 2A. Detection of exosome markers in transfected cells and EVs isolated from them. Fig. 2C: IB of cell lysates (CV2 and GT16) and exosome lysates (derived from CV2 cells and GT16 cells) was performed using specific primary antibodies. IB was performed using antibodies reactive with EV markers, eg, CD9, CD81, Alix, and Tsg101. Fig. 2D: The results of IB of cell lysates and EVs lysates with anti-CD63 mAb. Representative results from repeated experiments (at least 3 times) are presented. EVs: extracellular vesicles IB: Immunoblotting exo: exosome
Fig. 3
Fig. 3
Cell growth analysis of GD3/GD2(+) and (–) cells and effects of exosomes on their growth Fig. 3A: The cell proliferation rate was compared between GD3/GD2(+) cells and GD3/GD2– cells in medium containing 4.0 and 7.5% FCS by the MTT assay. The MTT assay was performed by seeding cells in 96-well plates, and by measuring absorbance at 595–620 nm. Relative absorbance was plotted. Three each of sample group cells were examined by two-way ANOVA. GD3/GD2(+) cells exhibited a higher cell growth when cultured under an FCS concentration of 0–4%, but not in 7.5%. *P < 0.05, **P < 0.01, and ***P < 0.001. Fig. 3B: Effects of EVs on growth of GT16 and CV2 cells were analyzed in 4% FCS-DMEM in the presence or absence of EVs. CV2 cells were treated with GT16 cell-derived EVs (0.2 and 1.0 μg), and showed an increased proliferation rate. In contrast, GT16 cells were treated with CV2 cell-derived EVs (0.2 and 1.0 μg), resulting in the suppression of cell growth. Each analysis was performed in triplicate, and the mean ± SD is presented. The data on days 0, 1, 2, 4, 5 and 6 were analyzed by two-way ANOVA with a Tukey post hoc test. *P < 0.05, **P < 0.01, and ***P < 0.001. exo: exosome FCS: fetal calf serum DMEM: Dulbecco’s modified Eagle medium
Fig. 4
Fig. 4
Invasion activity of GD3/GD2(+) and (–) cells, and effects of EVs Fig. 4A: Microscopic images of invaded cells of both groups (GD3/GD2+ and –). Invasion activity was examined by the Boyden-chamber assay. The upper chamber was coated with matrigel. After 24 hrs of incubation, invaded cells on the reverse side of the membranes were counted under microscope following Giemsa staining. Fig. 4B: The counted cell numbers (4A) were plotted where GD3/GD2(+) cells showed significantly higher invasion activity (**P < 0.01) than GD3/GD2(–) cells. The results are presented as means ± SD, and the data were analyzed with an unpaired Student’s two-tailed t test. Fig. 4C: Invasion activity of CV2 cells was analyzed after treatment with GT16 cell-derived EVs (0.2 and 2.0 μg). EVs were added after seeding the cells. Fig. 4D: The invaded cell numbers (4C) were plotted, showing that GT16 cell-derived EVs enhanced the invasion of CV2 in a dose dependent manner. The unpaired Student’s two-tailed t test was performed for evaluation of the results 4C. *P < 0.05, **P < 0.01, and ***P < 0.001. Fig. 4E: The invasion activity of GD3/GD2+ GT16 cells were analyzed after treatment with CV2 cell-derived EVs (0.2 and 2.0 μg), and counted under microscope. Fig. 4F: The counted cell numbers (4E) were plotted and showing a suppressive effect. The analysis was performed in triplicate, and the mean ± SD is presented. The data were analyzed with an unpaired Student’s two-tailed t test. *P < 0.05, **P < 0.01, and ***P < 0.001. EVs: extracellular vesicles exo: exosome
Fig. 5
Fig. 5
GD3/GD2(+) cells exhibited higher migration activity, and exosomes derived from them enhanced the migration activity of GD3/GD2(–) cells Fig. 5A: Migration activities of cells were analyzed by the wound healing scratch assay. CV5 and GT18 are representative cell lines from GD3/GD2(–) and GD3/GD2(+) cell groups, respectively. Cells were cultured in 7.5% FCS-containing medium and scratched at around 70–80% confluency. Individual cell migration was observed under microscope and pictures were taken of the scratched regions at the time points indicated. Fig. 5B: Graphical presentation of the migration assay of cells. Wound areas are presented as a percentage of the initial wound size (100%). The mean values ± SD (n=3) were plotted for each time point. GD3/GD2(+) cells showed significantly (*P < 0.05) higher motility than the controls. Fig. 5C: Migration activities of CV2 cells and GT16 cells were examined after the addition of EVs (4 μg) derived from GT16 cells and CV2 cells, respectively. Effects of exosomes on wound healing were examined at different time points as indicated. Fig. 5D: The spaces of wound healing were measured and plotted as described in 5C (left). GD3/GD2(+) cell-derived exosomes significantly (**P < 0.01) increased the migration activity of GD3/GD2(–) cells. Fig. 5E: The wound healing spaces as described in 5C (right) were measured at mentioned time points and plotted. No effects of EVs from CV2 cells on invasion of GT16 cells were noted. exo: exosome EVs: extracellular vesicles
Fig. 6
Fig. 6
Effects of GD3/GD2 and GD3/GD2(+) cell-derived exosomes on cell adhesion Fig. 6A: Adhesion activity of GD3/GD2(+) and (–) cells to collagen-I examined by the real time cell sensing system. Cells (1×10⁴) were seeded in collagen-1-precoated wells containing 100 μL of culture medium and incubated. The data at 17 h (A, upper) and 6 h (A, lower) of incubation were shown. GD3/GD2 enhanced the adhesion activity of cells. Fig. 6B: Adhesion activity of CV2 cells was investigated after treatment with GT16 cell-derived exosomes. Exosomes (0.2 and 2.0 μg) were added at 0 h, and the changes in cell adhesion are expressed as the cell index. GT16 cell-derived exosomes increased the adhesion activity of CV2 cells. The data until 6 h of incubation (B, lower) were analyzed with an unpaired Student’s two-tailed t test. **P < 0.01, and ***P < 0.001. Fig. 6C: GT16 cells were investigated after treatment with CV2 cell-derived exosomes (0.2 and 2.0 μg), resulting in the suppression of adhesion activity in a dose dependent manner. The data until 6 h of incubation (C lower) were also analyzed with an unpaired Student’s two-tailed t test. **P < 0.01, and ***P < 0.001. exo: exosome
Fig. 7
Fig. 7
Cell growth signals during cell growth Tyrosine-phosphorylated protein levels in GD3/GD2(–) cells were increased after treatment with GD3/GD2(+) cell-derived exosomes. Fig. 7A: A schema of lysate preparation during cell growth of GD3/GD2(–) cells and GD3/GD2(+) GT16 cells in 4% FCS-DMEM at a various time points of plating after 48 h starvation of serum. Fig. 7B: The prepared lysates (7A) were used for immunoblotting (IB) with PY20. Higher tyrosine phosphorylation was observed in PDGFRβ, FAK, and paxillin of GT16 cells than those in CV2. Fig. 7C: Band intensities at 188, 125, and 68-kDa in 7B were measured using Amersham Imager 680 software version 2.0, and plotted. Fig. 7D: A schema to prepare lysates during CV2 cell growth in 4% FCS-DMEM in the presence or absence of exosomes derived from GT16 cells at different time points after plating. Cells were prepared as in 7A. Then cells were cultured in the presence or absence of exosomes (4 μg) derived from GT16 cells in 4% FCS-DMEM, and incubated as indicated. After incubation, the cells were lysed. Fig. 7E: The prepared lysates described in 7D were subjected to IB with PY20. Fig. 7F: Band intensities in 7E were measured and plotted in 7F. Higher tyrosine phosphorylation was observed after 15 min of EV treatment. Representative results from repeated experiments (at least 3 times) are presented. FCS-DMEM: fetal calf serum-Dulbecco’s modified Eagle medium EV: extracellular vesicle PDGFRβ: platelet-derived growth factor receptor β FAK: focal adhesion kinase IB: immunoblotting Erk-1: extracellular signal-regulated kinase-1 Erk-2: extracellular signal-regulated kinase-2 exo: exosome
Fig. 8
Fig. 8
Adhesion signals during cell adhesion to collagen-I Tyrosine-phosphorylated protein levels in GD3/GD2(–) cells were increased after treatment with GD3/GD2(+) cell-derived exosomes. Fig. 8A: A schema for preparing cells to obtain lysates during cell adhesion at various time points. After culture of CV2 cells and GT16 cells in 6-cm dishes with regular medium, cells were starved in plain DMEM for 30 h. After cells were detached, the cell suspension was rotated at 37 °C for 1 h. Then, cells were placed in collagen-1-precoated plates in DMEM, and incubated for 0–60 min at 37 °C. After incubation, the cells were lysed. Fig. 8B: The prepared lysates mentioned in 8A were used (4 μg/well) for IB using PY20, and images were taken. Fig. 8C: Band intensities in 8B were measured and plotted. Bands of FAK and paxillin in GT16 cells were higher than CV2 cells after 5 min of incubation. Fig. 8D: A schema of preparing CV2 cells to obtain lysates during their adhesion to collagen-I in the presence or absence of exosomes derived from GT16 cells at several time points. Cells were placed in a collagen-1-precoated plate (6-cm) in plain DMEM, and incubated for 0–60 min at 37 °C in the presence or absence of EVs (4 μg) derived from GT16 cells. After incubation, the cells were lysed. Fig. 8E: The prepared lysates were subjected to SDS-PAGE (4 μg/well). Subsequently, IB was performed with PY20. Fig. 8F: Band intensities in 8E were measured using Amersham Imager 680 software version 2.0, and plotted. Representative results from repeated experiments (at least 3 times) are presented. IB: immunoblotting DMEM: Dulbecco’s modified Eagle medium FAK: focal adhesion kinase Erk-1: extracellular signal-regulated kinase-1 Erk-2: extracellular signal-regulated kinase-2 exo: exosome

Similar articles

Cited by

References

    1. Huse JT, Holland EC. Targeting brain cancer: advances in the molecular pathology of malignant glioma and medulloblastoma. Nat Rev Cancer. 2010;10(5):319–331. doi:10.1038/nrc2818. - DOI - PubMed
    1. Xie Q, Mittal S, Berens ME. Targeting adaptive glioblastoma: an overview of proliferation and invasion. Neuro Oncol. 2014;16(12):1575–1584. doi:10.1093/neuonc/nou147. - DOI - PMC - PubMed
    1. Schengrund CL. Gangliosides: Glycosphingolipids essential for normal neural development and function. Trends Biochem Sci. 2015;40(7):397–406. doi:10.1016/j.tibs.2015.03.007. - DOI - PubMed
    1. Regina Todeschini A, Hakomori SI. Functional role of glycosphingolipids and gangliosides in control of cell adhesion, motility, and growth, through glycosynaptic microdomains. Biochim Biophys Acta. 2008;1780(3):421–433. doi:10.1016/j.bbagen.2007.10.008. - DOI - PMC - PubMed
    1. Yeh SC, Wang PY, Lou YW, et al. Glycolipid GD3 and GD3 synthase are key drivers for glioblastoma stem cells and tumorigenicity. Proc Natl Acad Sci U S A. 2016;113(20):5592–5597. doi:10.1073/pnas.1604721113. - DOI - PMC - PubMed

LinkOut - more resources