Correlating plasma protein profiles with symptomatology and treatment response in acute phase and early remission of major depressive disorder
- PMID: 39355377
- PMCID: PMC11442335
- DOI: 10.3389/fpsyt.2024.1425552
Correlating plasma protein profiles with symptomatology and treatment response in acute phase and early remission of major depressive disorder
Abstract
Objectives: This study aimed to explore the relationship between plasma proteome and the clinical features of Major Depressive Disorder (MDD) during treatment of acute episode.
Methods: In this longitudinal observational study, 26 patients hospitalized for moderate to severe MDD were analyzed. The study utilized Liquid Chromatography with Tandem Mass Spectrometry (LC-MS/MS) alongside clinical metrics, including symptomatology derived from the Montgomery-Åsberg Depression Rating Scale (MADRS). Plasma protein analysis was conducted at the onset of acute depression and 6 weeks into treatment. Analytical methods comprised of Linear Models for Microarray Data (LIMMA), Weighted Correlation Network Analysis (WGCNA), Generalized Linear Models, Random Forests, and The Database for Annotation, Visualization and Integrated Discovery (DAVID).
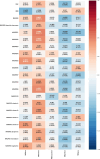
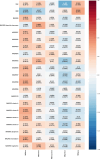
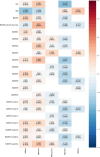
Results: Five distinct plasma protein modules were identified, correlating with specific biological processes, and uniquely associated with symptom presentation, the disorder's trajectory, and treatment response. A module rich in proteins related to adaptive immunity was correlated with the manifestation of somatic syndrome, treatment response, and inversely associated with achieving remission. A module associated with cell adhesion was linked to affective symptoms and avolition, and played a role in the initial episodes and treatment response. Another module, characterized by proteins involved in blood coagulation and lipid transport, exhibited negative correlations with a variety of MDD symptoms and was predominantly associated with the manifestation of psychotic symptoms.
Conclusion: This research points to a complex interplay between the plasma proteome and MDD's clinical presentation, suggesting that somatic, affective, and psychotic symptoms may represent distinct endophenotypic manifestations of MDD. These insights hold potential for advancing targeted therapeutic strategies and diagnostic tools.
Limitations: The study's limited sample size and its naturalistic design, encompassing diverse treatment modalities, present methodological constraints. Furthermore, the analysis focused on peripheral blood proteins, with potential implications for interpretability.
Keywords: LC-MS/MS; biomarker in depression; immune response; major depressive disorder; plasma proteomics; symptom presentation; treatment response.
Copyright © 2024 Křenek, Bartečková, Makarová, Pompa, Fialová Kučerová, Kučera, Damborská, Hořínková and Bienertová-Vašků.
Conflict of interest statement
EB reports grants from the Ministry of Health of the Czech Republic and the Ministry of Education, Youth and Sports of the Czech Republic; honoraria from Angelini Pharma S.p.a., H. Lundbeck A/S, consultations for Janssen Pharmaceuticals, and clinical research for Janssen Pharmaceuticals and Ketabon GmbH. JH reports grants from the Ministry of Health of the Czech Republic and the Ministry of Education, Youth and Sports of the Czech Republic and honoraria from Angelini Pharma S.p.a. The remaining authors declare that the research was conducted in the absence of any commercial or financial relationships that could be construed as a potential conflict of interest.
Figures


Similar articles
-
[Milnacipran and venlafaxine at flexible doses (up to 200 mg/d) in the outpatient treatment of adults with moderate-to-severe major depressive disorder: a 24-week randomised, double blind exploratory study].Encephale. 2009 Dec;35(6):595-604. doi: 10.1016/j.encep.2009.10.011. Encephale. 2009. PMID: 20004291 Clinical Trial. French.
-
The serum zinc concentration as a potential biological marker in patients with major depressive disorder.Metab Brain Dis. 2017 Feb;32(1):97-103. doi: 10.1007/s11011-016-9888-9. Epub 2016 Aug 8. Metab Brain Dis. 2017. PMID: 27502410 Free PMC article.
-
Symptom quality versus quantity in judging prognosis: Using NESARC predictive validators to locate uncomplicated major depression on the number-of-symptoms severity continuum.J Affect Disord. 2017 Jan 15;208:325-329. doi: 10.1016/j.jad.2016.09.015. Epub 2016 Oct 14. J Affect Disord. 2017. PMID: 27810714
-
The impact of early remission on disease trajectory and patient outcomes in major depression disorder (MDD): A targeted literature review and microsimulation modeling approach based on the Sequenced Treatment Alternatives to Relieve Depression (STAR*D) study.J Affect Disord. 2023 Mar 15;325:264-272. doi: 10.1016/j.jad.2022.12.147. Epub 2023 Jan 4. J Affect Disord. 2023. PMID: 36608852 Review.
-
[Antipsychotics in bipolar disorders].Encephale. 2004 Sep-Oct;30(5):417-24. doi: 10.1016/s0013-7006(04)95456-5. Encephale. 2004. PMID: 15627046 Review. French.
References
-
- GBD 2017 Disease and Injury Incidence and Prevalence Collaborators . Global, regional, and national incidence, prevalence, and years lived with disability for 354 diseases and injuries for 195 countries and territories, 1990-2017: a systematic analysis for the Global Burden of Disease Study 2017. Lancet. (2018) 392:1789–858. doi: 10.1016/S0140-6736(18)32279-7 - DOI - PMC - PubMed
-
- Sowa-Kućma M, Styczeń K, Siwek M, Misztak P, Nowak RJ, Dudek D, et al. . Lipid peroxidation and immune biomarkers are associated with major depression and its phenotypes, including treatment-resistant depression and melancholia. Neurotox Res. (2018) 33:448–60. doi: 10.1007/s12640-017-9835-5 - DOI - PMC - PubMed
-
- Anderson G. Linking the biological underpinnings of depression: Role of mitochondria interactions with melatonin, inflammation, sirtuins, tryptophan catabolites, DNA repair and oxidative and nitrosative stress, with consequences for classification and cognition. Prog Neuropsychopharmacol Biol Psychiatry. (2018) 80:255–66. doi: 10.1016/j.pnpbp.2017.04.022 - DOI - PubMed
Associated data
LinkOut - more resources
Full Text Sources

