. 2024 Sep 17:15:1439814.
doi: 10.3389/fmicb.2024.1439814. eCollection 2024.

Discovery of anti-infective compounds against Mycobacterium marinum after biotransformation of simple natural stilbenes by a fungal secretome

Affiliations

Discovery of anti-infective compounds against Mycobacterium marinum after biotransformation of simple natural stilbenes by a fungal secretome

Jahn Nitschke et al. Front Microbiol. .

Abstract

Introduction: Mycobacterium tuberculosis (Mtb), the causative agent of tuberculosis, remains a serious threat to human health worldwide and the quest for new anti-tubercular drugs is an enduring and demanding journey. Natural products (NPs) have played a significant role in advancing drug therapy of infectious diseases.

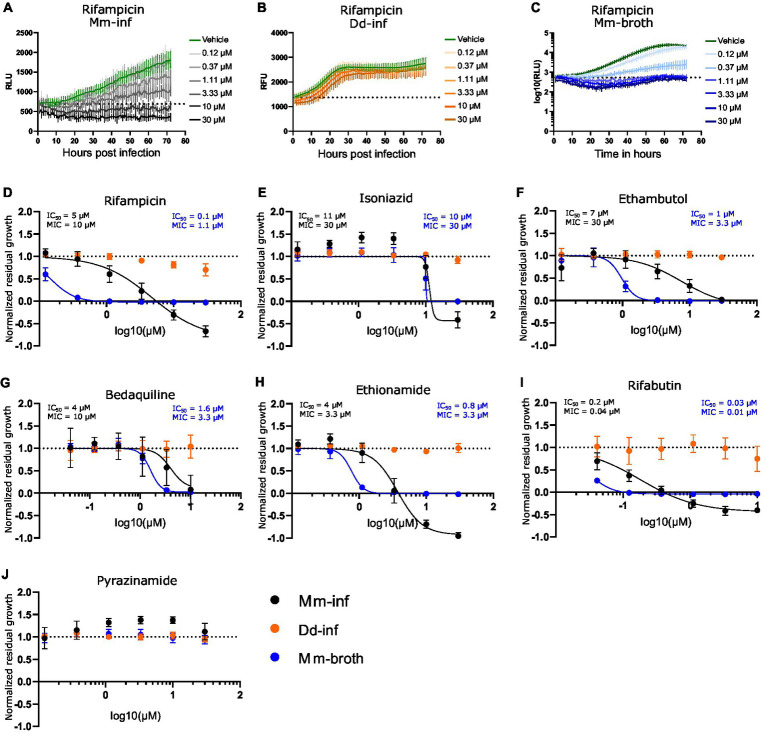
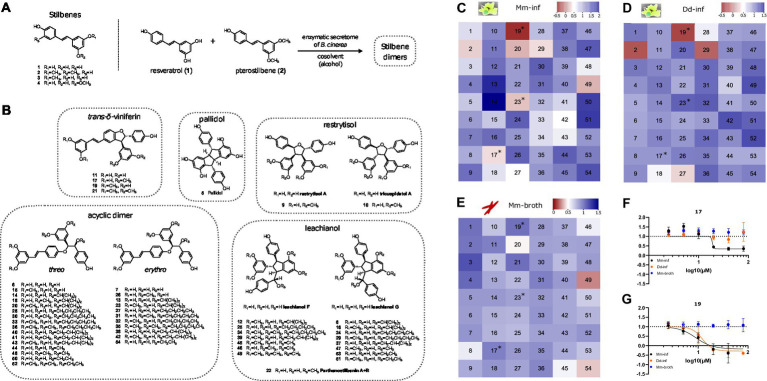
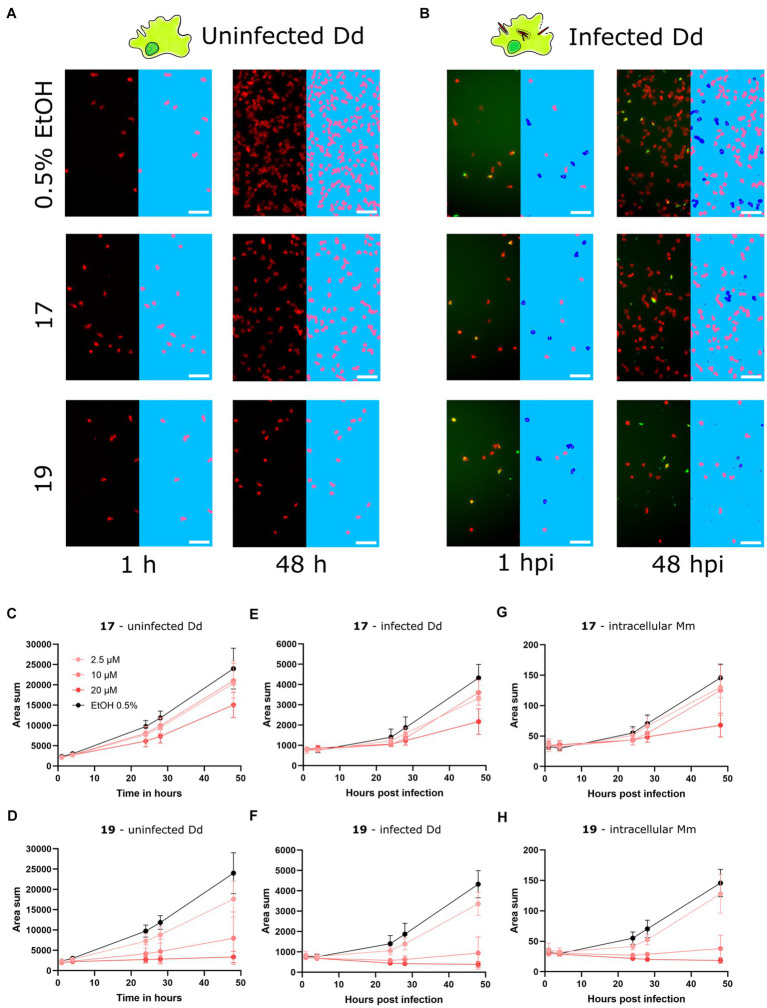
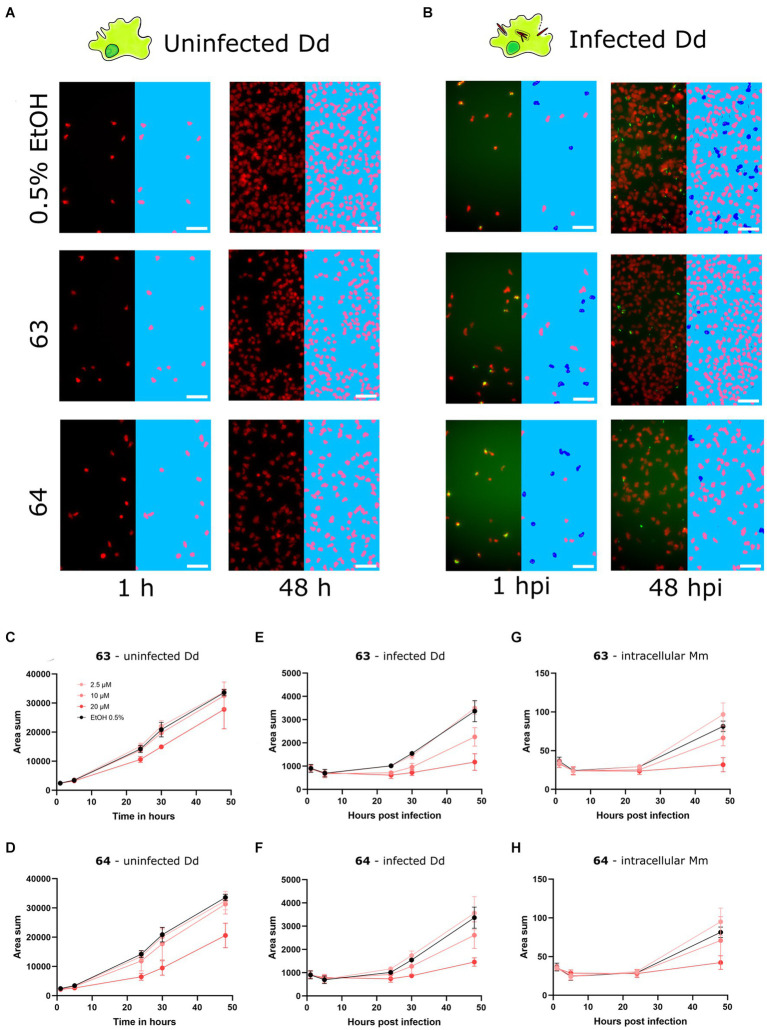
Methods: This study evaluated the suitability of a high-throughput infection system composed of the host amoeba Dictyostelium discoideum (Dd) and Mycobacterium marinum (Mm), a close relative of Mtb, to identify anti-infective compounds. Growth of Dd and intracellular Mm were quantified by using luminescence and fluorescence readouts in phenotypic assays. The system was first benchmarked with a set of therapeutic anti-Mtb antibiotics and then used to screen a library of biotransformed stilbenes.

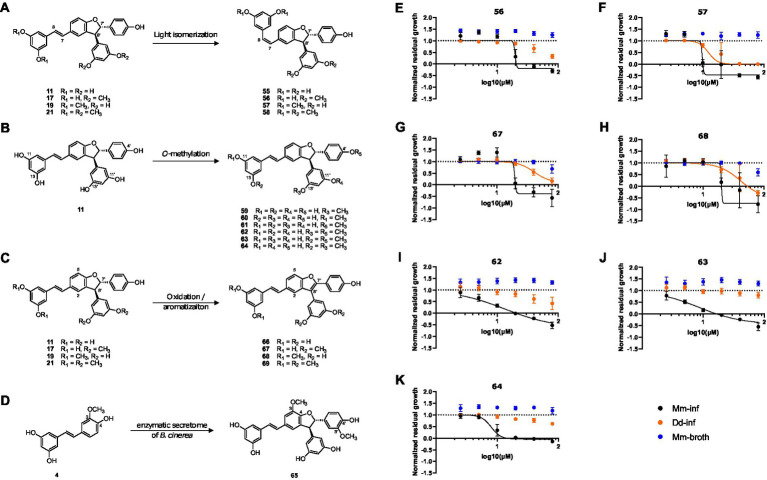
Results: The study confirmed both efficacy of established antibiotics such as rifampicin and bedaquiline, with activities below defined anti-mycobacterium susceptibility breakpoints, and the lack of activity of pyrazinamide against Mm. The screening revealed the promising anti-infective activities of trans-δ-viniferins and in particular of two compounds 17 and 19 with an IC50 of 18.1 μM, 9 μM, respectively. Both compounds had no activity on Mm in broth. Subsequent exploration via halogenation and structure-activity relationship studies led to the identification of derivatives with improved selectivity and potency. The modes of action of the anti-infective compounds may involve inhibition of mycobacterial virulence factors or boosting of host defense.

Discussion: The study highlights the potential of biotransformation and NP-inspired derivatization approaches for drug discovery and underscores the utility of the Dd-Mm infection system in identifying novel anti-infective compounds.

Keywords: Dictyostelium discoideum; Mycobacterium marinum; anti-infectives; natural products; phenotypic screening; stilbene derivatives.


Conflict of interest statement

The authors declare that the research was conducted in the absence of any commercial or financial relationships that could be construed as a potential conflict of interest.

Figures

Figure 1
Figure 1
Dose response curves of benchmarked antibiotics A selection of antibiotics used for treatment of a TB infection were benchmarked in the Dd-Mm high-throughput system, in infection and in broth. In panels (A–C), 72 h growth curves of Mm in infection (Mm-inf), Dd in infection (Dd-inf) and Mm in broth (Mm-broth), respectively, at different concentrations of rifampicin are shown. The dashed line represents the median over the first measurements of all wells of the respective experiment. On the y-axis are random luminescence units (RLU) or random fluorescence units (RFU). The former were log10 transformed in (C). The corresponding dose–response curve of Rifampicin is shown in (D). The dose–response curves depicted in panel (E) isoniazid, (F) (ethambutol), (G) (bedaquiline), (H) (ethionamide), (I) (rifabutin) and (J) (pyrazinamide) were created from growth curves in analogous manner. Black points show Mm-inf, orange points Dd-inf and blue points Mm-broth. Log10 of the test concentration in μM is shown on the x-axis. A dashed line at y = 1 represents the normalized residual growth of the vehicle control. Depicted are means of at least three biological replicates and the respective standard deviations. Black and blue text inlays show the MIC and IC50 of the anti-infective or the antibacterial assay, respectively.
Figure 2
Figure 2
Overview of compound structures in the library and results of the screening. (A) Stilbene monomers (1–4) and biotransformation reaction with the enzymatic secretome of B. cinerea. (B) Structures of the stilbene dimers obtained by biotransformation of resveratrol and pterostilbene (5–54). Heatmaps in (C–E) color code normalized residual growth of Mm-inf (C), Dd-inf (D) and Mm-broth (E) under treatment with compounds at 20 μM each. Values below the cut-off of 0.5 are displayed in shades of red, while values above the cut-off are displayed in shades of blue. Numbers in the heatmap correspond to the compounds described in panels (A,B). Compounds meeting the cut-off in Mm in infection, but not in broth (i.e., Mm-inf ≤ 0.5 and Mm-broth ≥0.5) after a validation in a dose–response curve are marked with an asterisk in all three heatmaps. (F,G) Depict these dose–response curves of 17 and 19, respectively, of which both are analogs of the same scaffold, the trans-δ-viniferins. The corresponding dose–response curve for 23 can be found in Supplementary Figure S1. The log10 of the concentration in μM is shown on the x-axis; a dashed line at y = 1 represents the normalized residual growth of the vehicle control. Black points show Mm-inf, orange points Dd-inf and blue points Mm-broth. Shown are means of at least three biological replicates and the respective standard deviations. Note that in (G), for visual clarity the highest dosage (80 μM, normalized residual growth of –2.2) was omitted for Mm-inf.
Figure 3
Figure 3
Characterization of primary hits with high-content microscopy Panels (A,B) show high-content microscopy panels illustrating the effects in infected and uninfected amoebae under treatment with 17 and 19 at 20 μM or 0.5% ethanol as the vehicle control at 1 and 48 h post infection (hpi). The left parts of the panels show the microscopy image, while the right parts of the panels show the corresponding segmentation. Uninfected Dd are shown in pink, infected Dd are shown in dark blue, intracellular bacteria are shown in white and extracellular bacteria are shown in black. Quantifications over the full time course and at concentrations of 2.5, 10, and 20 μM of 17 and 19 are depicted in (C–H). (C,D) Show the segmented area of uninfected Dd over time. (E,F) Show the segmented area of Dd determined to be infected by Dd-Mm area overlap, over time. (G,H) Show the segmented area of Mm determined to be intracellular by Dd-Mm area overlap, over time. Data points represent the average of three independent biological replicates, error bars are SDs.
Figure 4
Figure 4
Synthesis of trans-δ-viniferin derivatives and corresponding structure activity relationship panel (A) shows light-isomerization leading to cis isomers 55–58. (B) Shows O-methylation of 11 leading to mono-O-methylated derivatives 59–61 and di-O-methylated derivatives 62–64. (C) Shows oxidation resulting in planar structures with a benzofuran moiety, 66–69. (D) Shows a radical coupling reaction of isorhapontigenin (4) leading to a dimer with two added methoxy groups (65) compared to trans-δ-viniferin (11). Panels (E–K) show dose–response curves of normalized residual growth of the aforementioned derivatives. (E,F) Show cis isomers 56 and 57, (G,H) benzofuran derivatives of 17 and 19, 67 and 68, respectively. (I–K) Show di-O-methylated derivatives 62, 63, and 64. Black points show Mm-inf, orange points Dd-inf and blue points Mm-broth; Log10 of the concentration in μM is shown on the x-axis. A dashed line at y = 1 represents the normalized residual growth of the vehicle control. Depicted are means of at least three biological replicates and the respective SDs.
Figure 5
Figure 5
Characterization of improved derivatives with high-content microscopy Panels (A,B) show panels from high-content microscopy, illustrating effects in infected and uninfected amoebae under treatment with 63 and 64 at 20 μM or 0.5% ethanol as the vehicle control at 1 and 48 hpi. The left part of the panels shows the microscopy image, while the right part of the panels shows the segmented cells. Uninfected Dd are shown in pink, infected Dd are shown in dark blue, intracellular bacteria are shown in white and extracellular bacteria are shown in black. Quantifications over the full time-course at concentrations of 5, 10 and 20 μM of 63 and 64 are depicted in (C–H). (C,D) Show the segmented area of uninfected Dd over time. (E,F) Show the segmented area of Dd determined to be infected by Dd-Mm area overlap, over time. (G,H) Show the segmented area of Mm determined to be intracellular by Dd-Mm area overlap, over time. Data points represent the average of three independent biological replicates, error bars are SDs.

Similar articles

Cited by

References

    1. Alderwick L. J., Harrison J., Lloyd G. S., Birch H. L. (2015). The mycobacterial Cell Wall--peptidoglycan and arabinogalactan. Cold Spring Harb. Perspect. Med. 5:a021113. doi: 10.1101/cshperspect.a021113, PMID: - DOI - PMC - PubMed
    1. Alsayed S. S. R., Gunosewoyo H. (2023). Tuberculosis: pathogenesis, current treatment regimens and new drug targets. Int. J. Mol. Sci. 24:5202. doi: 10.3390/ijms24065202 - DOI - PMC - PubMed
    1. Andreu N., Zelmer A., Fletcher T., Elkington P. T., Ward T. H., Ripoll J., et al. . (2010). Optimisation of Bioluminescent Reporters for Use with Mycobacteria. PLoS ONE 5:e10777. doi: 10.1371/journal.pone.0010777 - DOI - PMC - PubMed
    1. Andries K., Verhasselt P., Guillemont J., Göhlmann H. W. H., Neefs J.-M., Winkler H., et al. . (2005). A Diarylquinoline drug active on the ATP synthase of Mycobacterium tuberculosis. Science 307, 223–227. doi: 10.1126/science.1106753, PMID: - DOI - PubMed
    1. Anjard C., Loomis W. F., Dictyostelium Sequencing C. (2002). Evolutionary analyses of ABC transporters of Dictyostelium discoideum. Eukaryot. Cell 1, 643–652. doi: 10.1128/ec.1.4.643-652.2002, PMID: - DOI - PMC - PubMed

LinkOut - more resources