. 2024 Oct 1;8(3):808-836.
doi: 10.1162/netn_a_00387. eCollection 2024.

Individual variability in neural representations of mind-wandering

Affiliations

Individual variability in neural representations of mind-wandering

Aaron Kucyi et al. Netw Neurosci. .

Abstract

Mind-wandering is a frequent, daily mental activity, experienced in unique ways in each person. Yet neuroimaging evidence relating mind-wandering to brain activity, for example in the default mode network (DMN), has relied on population- rather than individual-based inferences owing to limited within-person sampling. Here, three densely sampled individuals each reported hundreds of mind-wandering episodes while undergoing multi-session functional magnetic resonance imaging. We found reliable associations between mind-wandering and DMN activation when estimating brain networks within individuals using precision functional mapping. However, the timing of spontaneous DMN activity relative to subjective reports, and the networks beyond DMN that were activated and deactivated during mind-wandering, were distinct across individuals. Connectome-based predictive modeling further revealed idiosyncratic, whole-brain functional connectivity patterns that consistently predicted mind-wandering within individuals but did not fully generalize across individuals. Predictive models of mind-wandering and attention that were derived from larger-scale neuroimaging datasets largely failed when applied to densely sampled individuals, further highlighting the need for personalized models. Our work offers novel evidence for both conserved and variable neural representations of self-reported mind-wandering in different individuals. The previously unrecognized interindividual variations reported here underscore the broader scientific value and potential clinical utility of idiographic approaches to brain-experience associations.

Keywords: Experience-sampling; Precision functional mapping; Resting-state fMRI; Spontaneous thought.

Plain language summary

While everyone experiences that their mind “wanders” throughout daily life, the content and form of inner experience is different in different people. In this study, we found that brain activity representing mind-wandering is different in each person, reflecting unique mental experiences. While people consistently engaged the brain’s default mode network (DMN) during mind-wandering, there were inconsistencies in the way that the DMN was engaged and in the other networks throughout the brain that were engaged. Our study highlights that personalized approaches, which require that individuals are sampled more densely than is common in current practice, enable accurate insights into relationships between brain activity and inner experience.


Conflict of interest statement

Competing Interests: The authors have declared that no competing interests exist.

Figures

<b>Figure 1.</b>
Figure 1.
Experience-sampling paradigm and mind-wandering ratings. (A) In fMRI runs involving experience-sampling, subjects were instructed to stare at a red fixation circle. They were intermittently probed every 45–90 s with the question (Q1), “How focused were you on the task?” accompanied by an 8-point Likert scale. A focus rating of 5 or greater was deemed a “mind-wandering trial” and triggered an additional set of questions asking about thought contents. During data analyses, ratings were reverse-coded so that a higher rating indicated more mind-wandering. (B) Example time series of single-subject mind-wandering ratings. The plots show subject S1’s trial-by-trial responses to Q1 across runs within each MRI session. Green and red markers, respectively, indicate trials that were labeled as mind-wandering and non-mind-wandering. Trials in which a different response than 1–8 was submitted (see Methods section) are not shown. (C) Histograms displaying the distribution of responses to Q1, including trials in which a 1–8 rating was provided and “Other” trials in which subjects reported being neither focused on task nor engaged in mind-wandering. Pie charts show the proportions of mind-wandering trials (rating > 4), on-task trials (rating < 5), and “Other” trials in each subject.
<b>Figure 2.</b>
Figure 2.
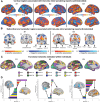
Activation of the DMN, estimated within individuals, is associated with mind-wandering. (A) Two individually estimated networks of the DMN (DNa and DNb) identified among 17 total cortical networks based on multi-session hierarchical Bayesian modeling applied to functional localizer fMRI data. (B) Correlations between trial-by-trial mind-wandering ratings and median DNa blood oxygenation level–dependent (BOLD) percent signal change (%SC) within 10-s pre–thought probe periods. (C) Mean time series plots showing median BOLD %SC in DNa for mind-wandering trials (rating of 6 or higher) and non-mind-wandering trials (rating of 3 or lower) before and after thought probes. Asterisks indicate time points where there was a significant difference in BOLD %SC between trial types (Wilcoxon rank sum test; p < 0.05, false discovery rate–corrected for number of samples within 20-s window prior to thought probes). Shaded error bars indicate standard error of the mean. (D) Same as panel (B) but for DNb. (E) Same as panel (C) but for DNb.
<b>Figure 3.</b>
Figure 3.
Individual variability in networks activated and deactivated during mind-wandering. (A) Cortical surface plots of unthresholded statistical parametric maps showing regions positively (red–yellow) and negatively (blue–light blue) associated with mind-wandering during 10-s pre–thought probe windows. Maps are based on a whole-brain, within-subject general linear model (GLM) analyses combining all fMRI experience-sampling runs and sessions. Whole-brain corrected, statistically significant clusters are outlined in black (FWE-corrected cluster-determining threshold: Z > 3.1, cluster-based p < 0.05). (B) Representative coronal volumes in two subjects who showed significant clusters in subcortical and cerebellar regions. Statistical maps are thresholded to show only significant regions (FWE-corrected cluster-determining threshold: Z > 3.1, cluster-based p < 0.05). (C) 17 personalized cortical networks identified with multi-session hierarchical Bayesian modeling applied to functional localizer fMRI data. Labels are provided for 14 of these networks based on consistency with Du et al. (2024). (D) Rank-ordered median z-score (obtained from GLMs) within each one of the networks shown in panel (B). Cortical surface plots are shown for the networks most positively and negatively associated with mind-wandering, respectively; statistical maps are individually thresholded to retain top voxels showing associations, and network outlines are shown in black. AUD = auditory; CG-OP = cingulo-opercular; dATN = dorsal attention network; DN = default network; FPN = frontoparietal network; LANG = language; SAL/PMN = salience/parietal memory network; SMOT = somatomotor; VIS-C = visual central; VIS-P = visual peripheral.
<b>Figure 4.</b>
Figure 4.
Within-individual connectome-based predictive modeling (CPM) of mind-wandering. (A) Features (left) for CPM included functional connectivity (correlated activity) between regions in a 300-region cortical atlas within 30-s windows prior to thought probes. The CPM outcome to be predicted (right) was mind-wandering rating. (B) Correlation between predicted and observed mind-wandering within each subject based on CPM with leave-one-trial-out cross-validation. (C) Mean correlation between predicted and observed mind-wandering, based on CPM with five-fold cross-validation (see also Supporting Information Table S1D). Error bars show standard deviation of correlations across 120 iterations of cross-validation.
<b>Figure 5.</b>
Figure 5.
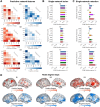
Individual variability in functional anatomy of features important for connectome-based predictive modeling of mind-wandering. (A) Summaries of predictive network features that were selected in CPM to model and predict mind-wandering within each subject. For both positive and negative predictive region-pairs (edges), the proportion of total edges for each pair of networks in the Yeo-Krienen seven-network atlas is shown. (B) Mean correlation between predicted and observed mind-wandering, based on CPMs with different networks virtually lesioned (i.e., all edges involving the “lesioned” network removed for CPM training and testing). (C) Mean correlation between predicted and observed mind-wandering, based on CPMs with all networks removed except for one (i.e., only edges involving the labeled network retained for CPM training and testing). Results shown in panels (B) and (C) are based on five-fold cross-validation. (D) Left hemisphere cortical maps showing node degree (i.e., number of total edge contributions) for regions that positively (red) and negatively (blue) contributed to CPMs within each subject. All error bars indicate standard deviation of correlations across 120 iterations of five-fold cross-validation. DAN = dorsal attention network; DMN = default mode network; FPCN = frontoparietal control network; LIM = limbic network; SAL = salience network; SMN = sensorimotor network; VIS = visual network.
<b>Figure 6.</b>
Figure 6.
Predicting trial-wise mind-wandering from cross-subject and population-derived connectome-based predictive models. (A) Spearman rank correlation coefficients for predicted versus observed mind-wandering using training data from subjects shown on x-axis and test data from subjects shown on y-axis. (B) Spearman rank correlation coefficients for predicted versus observed mind-wandering using two previously published, population-derived CPMs applied to S1, S2, and S3 as test subjects. Asterisks indicate p < 0.05. SITUT-CPM = stimulus-independent, task-unrelated thought CPM; SA-CPM = sustained attention CPM.

Update of

References

    1. Andrews-Hanna, J. R., Reidler, J. S., Huang, C., & Buckner, R. L. (2010). Evidence for the default network’s role in spontaneous cognition. Journal of Neurophysiology, 104(1), 322–335. 10.1152/jn.00830.2009, - DOI - PMC - PubMed
    1. Andrews-Hanna, J. R., Reidler, J. S., Sepulcre, J., Poulin, R., & Buckner, R. L. (2010). Functional-anatomic fractionation of the brain’s default network. Neuron, 65(4), 550–562. 10.1016/j.neuron.2010.02.005, - DOI - PMC - PubMed
    1. Andrews-Hanna, J. R., Smallwood, J., & Spreng, R. N. (2014). The default network and self-generated thought: Component processes, dynamic control, and clinical relevance. Annals of the New York Academy of Sciences, 1316(1), 29–52. 10.1111/nyas.12360, - DOI - PMC - PubMed
    1. Benisty, H., Barson, D., Moberly, A. H., Lohani, S., Tang, L., Coifman, R. R., Crair, M. C., Mishne, G., Cardin, J. A., & Higley, M. J. (2024). Rapid fluctuations in functional connectivity of cortical networks encode spontaneous behavior. Nature Neuroscience, 27(1), 148–158. 10.1038/s41593-023-01498-y, - DOI - PMC - PubMed
    1. Bernard, C. (2023). Brain’s best kept secret: Degeneracy. eNeuro, 10(11), ENEURO.0430-23.2023. 10.1523/ENEURO.0430-23.2023, - DOI - PMC - PubMed

LinkOut - more resources