. 2024 Apr;74(2):103-113.
doi: 10.1270/jsbbs.23060. Epub 2024 Feb 29.

Polyploid QTL-seq revealed multiple QTLs controlling steamed tuber texture and starch gelatinization temperature in sweetpotato

Affiliations

Polyploid QTL-seq revealed multiple QTLs controlling steamed tuber texture and starch gelatinization temperature in sweetpotato

Hiromoto Yamakawa et al. Breed Sci. 2024 Apr.

Abstract

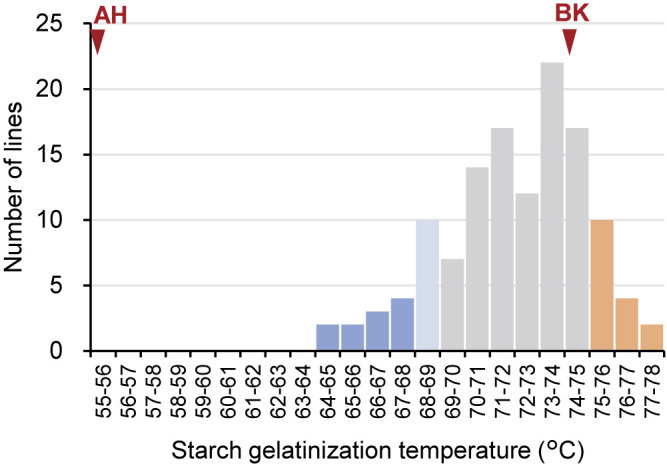
Sweetpotato (Ipomoea batatas) includes diverse cultivars with flesh textures ranging from dry to moist. Moist-fleshed cultivars often contain starch with a lower gelatinization temperature (GT). To elucidate the genetic determinants of flesh texture and starch GT, we conducted a QTL analysis using F1 progenies obtained from a cross between dry-fleshed and moist-fleshed cultivars, 'Benikomachi' (BK) and 'Amahazuki' (AH), by using an updated polyploid QTL-seq pipeline. Flesh texture was assessed based on the wet area ratio (WAR) observed on the cut surface of steamed tubers, as progenies with dry and moist flesh exhibited low and high WAR values, respectively, demonstrating a strong correlation. Three QTLs were found to regulate the WAR. Notably, two AH-derived alleles at 4.30 Mb on Itr_chr05 and 21.01 Mb on Itr_chr07, along with a BK-derived allele at 2.89 Mb on Itr_chr15, were associated with increased WAR. Starch GT, which displayed no correlation with either flesh texture or WAR, was distinctly influenced by two QTLs: a GT-increasing BK-derived allele at 1.74 Mb on Itr_chr05 and a GT-decreasing AH-derived allele at 30.16 Mb on Itr_chr12. Consequently, we developed DNA markers linked to WAR, offering a promising avenue for the targeted breeding of sweetpotato with the desired flesh textures.

Keywords: DNA marker; QTL-seq; flesh texture; polyploid; sweetpotato.


Figures

Fig. 1.
Fig. 1.
Appearance of steamed tuber flesh surfaces and correlation of wet area ratio (WAR) to flesh texture. (A) Surface appearance of steamed tuber sections for ‘Benikomachi’ (BK), ‘Amahazuki’ (AH), and F1 individuals (ABF1). Corresponding WAR values determined visually are provided beneath each sample. (B) Correlation between WAR on steamed tuber surfaces and flesh texture grades, ranging from dry (1) to moist (5).
Fig. 2.
Fig. 2.
Wet area ratio (WAR) on the cut surface of steamed tubers for BK, AH, and ABF1 progenies. WAR averages for tests conducted in 2021 and 2022 are presented. The number of ABF1 lines with specific WAR values is indicated. Red arrowheads highlight WAR values of 50% for BK and 100% for AH. Criteria for defining dry and moist bulks for QTL-seq analysis are denoted in orange and blue, respectively.
Fig. 3.
Fig. 3.
Gelatinization temperature (GT) of tuber starch for BK, AH, and ABF1 progenies. The number of ABF1 lines with specific temperatures is shown. Red arrowheads indicate temperatures of 74.1°C for BK and 55.4°C for AH. Criteria for low- and high-temperature bulks for QTL-seq analysis are denoted in blue (with light blue signifying partial line utilization) and orange, respectively.
Fig. 4.
Fig. 4.
Relationship between steamed tuber texture and starch GT for BK, AH, and ABF1 progenies. (A) Relationship between WAR and starch GT. (B) Relationship between flesh texture and starch GT. Values represent averages from tests in 2021 and 2022. ABF1 individual lines are depicted as gray dots, while BK and AH are shown as red dots.
Fig. 5.
Fig. 5.
Genomic regions associated with WAR in ABF1 progenies. (A) Polyploid QTL-seq analysis using AH-derived simplex variants. (B) Polyploid QTL-seq analysis using BK-derived simplex variants. SNP-index plots of low WAR bulk and high WAR bulk, their superimposed plot, ΔSNP-index plot, window -log10P plot, and QTL variant count plot are depicted. Dark green and orange dots in the SNP-index plots indicate variants with an SNP-index of 0. Green, red, and blue lines indicate the sliding window average of a 100 kb interval with a 20 kb increment for SNP-index and ΔSNP-index. Window -log10P plot is the graph plotting average of -log10P values of all variants included in the sliding window. Orange and red lines on the ΔSNP-index plot and the window -log10P plot delineate 95% and 99% statistical confidence thresholds under the null hypothesis of no QTLs, respectively. QTL variant count plot is the graph plotting the number of QTL-deduced variants in the sliding window. Orange and red dots on the QTL variant count plot show the number of variants deduced as QTL with 95% and 99% statistical confidence, respectively, and red lines indicate the threshold of 20 for the criteria for the determination of QTL candidate regions. In order to divide variants by the direction of the effect of QTLs, those with positive and negative ΔSNP-index values are plotted upward and downward on the QTL variant count plot, respectively. Candidate regions deduced as QTLs are indicated by red frames. The graphs are depicted for Itr_chr05 and Itr_chr07 in the AH-derived simplex analysis and for Itr_chr15 in the BK-derived simplex analysis. Additional chromosomes are presented in Supplemental Fig. 1.
Fig. 6.
Fig. 6.
Genomic regions influencing starch GT in ABF1 progenies. (A) Polyploid QTL-seq analysis using AH-derived simplex variants. (B) Polyploid QTL-seq analysis using BK-derived simplex variants. SNP-index plots of low-temperature (LT) bulk and high-temperature (HT) bulk, their superimposed plot, ΔSNP-index plot, window -log10P plot, and QTL variant count plot are depicted similarly to Fig. 5. Red frames indicate candidate regions deduced as QTLs. The graphs are depicted for Itr_chr12 in the AH-derived simplex analysis and for Itr_chr05 in the BK-derived simplex analysis. Additional chromosomes are shown in Supplemental Fig. 2.
Fig. 7.
Fig. 7.
Genotyping using developed DNA markers. (A) Evaluation of WAR-linked SNP markers derived from AH (Itr_chr05_4.30Mb_A, Itr_chr07_21.01Mb_A) and BK (Itr_chr15_2.89Mb_B) simplex variants. Relationships between marker genotypes (+; presence or –; absence) and WAR are shown for the ABF1 population (n = 123). The effect of the combination of AH markers is indicated. (B) Evaluation of starch GT-linked SNP markers from BK (Itr_chr05_1.74Mb_B) and AH (Itr_chr12_30.16Mb_A) simplex variants. Relationships between marker genotypes and starch GT are presented. The effect of the combination of the markers is shown. The box plots show the minimum, first quartile, median, third quartile and maximum values. The ‘x’ marks in the box plots are the mean values. Amplification with control SSII primers was verified. A: AH-derived simplex, B: BK-derived simplex, -: Absence of respective simplex. Different lower-case letters denote significant differences at P < 0.05.

References

    1. FAOSTAT (2021) URL: https://www.fao.org/faostat/en/#data/QCL/visualize.
    1. Haque, E., Shirasawa K., Suematsu K., Tabuchi H., Isobe S. and Tanaka M. (2023) Polyploid GWAS reveals the basis of molecular marker development for complex breeding traits including starch content in the storage roots of sweetpotato. Front Plant Sci 14: 1181909. - PMC - PubMed
    1. Hirakawa, H., Okada Y., Tabuchi H., Shirasawa K., Watanabe A., Tsuruoka H., Minami C., Nakayama S., Sasamoto S., Kohara M.et al. (2015) Survey of genome sequences in a wild sweet potato, Ipomoea trifida (H. B. K.) G. Don. DNA Res 22: 171–179. - PMC - PubMed
    1. Katayama, K., Komae K., Kohyama K., Kato T., Tamiya S. and Komaki K. (2002) New sweet potato line having low gelatinization temperature and altered starch structure. Starch/Stärke 54: 51–57.
    1. Katayama, K., Tamiya S. and Ishiguro K. (2004) Starch properties of new sweet potato lines having low pasting temperature. Starch/Stärke 56: 563–569.