. 2024 Nov;11(44):e2405318.
doi: 10.1002/advs.202405318. Epub 2024 Oct 2.

Targeting Immunoproteasome in Polarized Macrophages Ameliorates Experimental Emphysema Via Activating NRF1/2-P62 Axis and Suppressing IRF4 Transcription

Affiliations

Targeting Immunoproteasome in Polarized Macrophages Ameliorates Experimental Emphysema Via Activating NRF1/2-P62 Axis and Suppressing IRF4 Transcription

Bingxin Guo et al. Adv Sci (Weinh). 2024 Nov.

Abstract

Chronic obstructive pulmonary disease (COPD) stands as the prevailing chronic airway ailment, characterized by chronic bronchitis and emphysema. Current medications fall short in treatment of these diseases, underscoring the urgent need for effective therapy. Prior research indicated immunoproteasome inhibition alleviated various inflammatory diseases by modulating immune cell functions. However, its therapeutic potential in COPD remains largely unexplored. Here, an elevated expression of immunoproteasome subunits LMP2 and LMP7 in the macrophages isolated from mouse with LPS/Elastase-induced emphysema and polarized macrophages in vitro is observed. Subsequently, intranasal administration of the immunoproteasome-specific inhibitor ONX-0914 significantly mitigated COPD-associated airway inflammation and improved lung function in mice by suppressing macrophage polarization. Additionally, ONX-0914 capsulated in PLGA nanoparticles exhibited more pronounced therapeutic effect on COPD than naked ONX-0914 by targeting immunoproteasome in polarized macrophages. Mechanistically, ONX-0914 activated autophagy and endoplasmic reticulum (ER) stress are not attribute to the ONX-0914 mediated suppression of macrophage polarization. Intriguingly, ONX-0914 inhibited M1 polarization through the nuclear factor erythroid 2-related factor-1 (NRF1) and NRF2-P62 axis, while the suppression of M2 polarization is regulated by inhibiting the transcription of interferon regulatory factor 4 (IRF4). In summary, the findings suggest that targeting immunoproteasome in macrophages holds promise as a therapeutic strategy for COPD.

Keywords: IRF4; NRF1/2‐P62; emphysema; immunoproteasome; macrophage polarization.


Conflict of interest statement

The authors declare no conflict of interest.

Figures
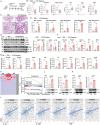
Figure 1
Figure 1
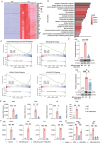
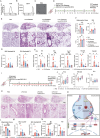
Immunoproteasome Induction in M1 Polarized Macrophages during Experimental Emphysema Development. A) Schematic representation of the COPD mouse model. Briefly, LPS + Elastase was intranasally delivered to C57BL/6JGpt mice weekly for four weeks (n = 7 per group). B) Pulmonary function parameters including Forced Vital Capacity (FVC), Forced Expiratory Volume in 100 milliseconds (FEV100), FEV0.1/FVC ratio (%), Residual Volume (RV), Total Lung Capacity (TLC), and Peak Expiratory Flow (PEF) were measured to evaluate lung function in each group using PFT Pulmonary Maneuvers (n = 7 per group). C) Representative H&E staining images demonstrating enlarged alveolar spaces with abundant inflammatory cell infiltration in the LPS + Elastase group (n = 7 per group). D) Total cell counts in bronchoalveolar lavage (BAL) fluid, including neutrophils and monocytes, were detected in each group using a Sysmex blood analyzer (n = 7 per group). E) Expression levels of immunoproteasome subunits LMP2, LMP7, and M1 marker proteins iNOS, IL‐1β were analyzed in lung tissue of each group by Western blotting analysis. Mean values ± SEM from at least 6 independent samples is presented. F) RT‐qPCR analysis examined the mRNA expression of immunoproteasome subunits Psmb8, Psmb9, and M1 marker genes Nos2, Il1b, and Il12b in lung tissue of each group, respectively, and n = 6 for each group. G) RT‐qPCR analysis detected Psmb8, Psmb9, and M1 marker genes, including Nos2, Il1b, Tnf, Cxcl1, Cxcl2, and Cxcl3, in alveolar macrophages (AMs) of each group. Data was collected from 6 independent samples. H) Bulk RNA‐seq transcriptomes showing the differences in immunoproteasome subunit‐related genes between M0, M1, and M2 phenotype of peritoneal macrophages (PMs) isolated from 8‐week‐old C57BL/6JGpt mice (n = 4 independent samples in each group). I) Hallmark gene sets with significant changes in Gene Set Enrichment Analysis (GSEA) between M1 and M0 phenotype of PMs. False Discovery Rate (FDR) q < 0.05 was considered significant (n = 4 independent samples for each group). J and K) Western blotting analysis showing expression levels of immunoproteasome subunits LMP2 and LMP7 in M0 and M1 (J), M0 and M2 (K) phenotype of AMs, respectively. Data were expressed as means ± SEM from 3 independent experiments. L) The relationship between M1 marker genes IL‐1β, IL‐12β, TNF, and immunoproteasome‐related genes (Psmb8, Psmb9) was reanalyzed using a clinical cohort of sputum transcriptomes from 99 patients with COPD and 36 healthy individuals in China. *p < 0.05, **p < 0.01, ***p < 0.001.
Figure 2
Figure 2
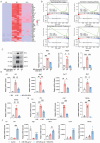
Immunoproteasome Inhibition as a Therapeutic Approach for Emphysema. A) Experimental setup for the COPD experiment and n ≥ 6 for each group. ONX‐0914 intranasal treatment was initiated one day post‐LPS + Elastase administration, administered three times weekly for four weeks to induce COPD. Gradient dosages of ONX‐0914 (1 mg kg−1, 2.5 mg kg−1, 5 mg kg−1) were administered one day post‐LPS + Elastase, three times weekly for 4 weeks. B) Pulmonary function indexes, including FVC, FEV100, FEV0.1/FVC%, RV, PEF, and TLC, were tested in each group using PFT Pulmonary Maneuvers. C) H&E staining observed the alveolar changes in lung tissue in each group. D) Cellular infiltration in BAL fluid was detected in each group by flow cytometry analysis. E) Total BAL cell counts, including neutrophils and monocytes, were measured using a Sysmex blood analyzer in the control, LPS + Elastase, and 5 mg kg−1 ONX‐0914 treatment groups. F) RT‐qPCR analysis detected M1 marker genes Il1b, Il2b, and Tnf in alveolar macrophages (AMs) of each group. Data was collected from 6 independent samples. G) M2 marker genes, such as Arg1, Mrc1, Ccl17, and Retnla, were detected with RT‐qPCR analysis in AMs of each group. Data was collected from 6 independent samples. *p < 0.05, **p < 0.01, ***p < 0.001.
Figure 3
Figure 3
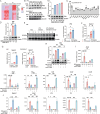
Immunoproteasome Inhibition Suppresses M1 Macrophage Polarization In Vitro. A) Heat maps showing M1 marker genes in PMs in ONX‐0914 and non‐ONX‐0914 groups, including M0, M0+ONX‐0914, M1, M1+ONX‐0914 (n = 4 independent samples in each group). B) GO enrichment analysis of genes downregulated by ONX‐0914 treatment in M1. The y‐axis represents the GO terms, and the x‐axis indicates the gene count. C) GSEA for Differentially Expressed Genes (DEGs) of M1 after ONX‐0914 treatment. The y‐axis represents the enrichment score, and the x‐axis is the ranked list of genes from highest to lowest based on statistical significance after ONX‐0914 treatment. The results show that the increased macrophage cell number, macrophage M1 lineage, IL‐6/JAK/STAT3, and IFN‐γ pathways were significantly repressed by ONX‐0914. D) After pretreatment with 0.2 µM ONX‐0914 for 6 h, the M1 marker protein iNOS was analyzed by Western blotting in M1 polarization of AMs and PMs (n = 3 in each group). E) After pretreatment with 0.2 µM ONX‐0914 for 6 h, the M1 marker genes Nos2, Il12b, Il6, and Ccl2 were examined by qPCR in AMs (n = 3 in each group). F) Pre‐treated with 0.2 µM ONX‐0914 for 6 h, AMs were challenged with 250 µg mL−1 dosage of CSE for 24 h, and the M1 marker genes Nos2, Il1b, Tnf, and Ccl2 were examined by RT‐qPCR (n = 3 in each group). G) Pre‐treated with 0.2 µM ONX‐0914 for 6 h, RAW264.7 cell line was challenged with 40 µg mL−1 CSE for 24 h, and the M1 marker genes Nos2, Il1b were examined by RT‐qPCR (n = 4 in each group). *p < 0.05, **p < 0.01, ***p < 0.001.
Figure 4
Figure 4
Immunoproteasome Inhibition Suppresses M2 Macrophage Polarization In Vitro. A) Heat map shows M2 marker genes in PMs in ONX‐0914 and non‐ONX‐0914 groups, including M0, M0+ONX‐0914, M2, M2+ONX‐0914 (n = 4 independent samples in each group). B) GSEA) for DEGs of M2 after ONX‐0914 treatment. The y‐axis represents the enrichment score, and the x‐axis is the ranked list of genes from highest to lowest based on statistical significance after ONX‐0914 treatment. The results show that the anti‐inflammatory function of macrophage M2 lineage, interleukin‐4 signaling pathway, macrophage M2‐related phagocytosis, PI3K pathway were significantly repressed by ONX‐0914. C) After pre‐treated with 0.2 µM ONX‐0914 for 6 h, the M2 marker protein IRF4, ARG1, YM1/2 was analyzed by Western blotting in M2 polarization of PMs (n = 3 in each group). D) After pre‐treated with 0.2 µM ONX‐0914 for 6 h, the M2 marker genes Irf4, Arg1, Ccl17, Mrc1 and Retnla were examined by RT‐qPCR in AMs (n = 3 in each group). E) After pretreatment with 0.2 µM ONX‐0914 for 6 h, the M2 marker genes Irf4, Arg1, and Retnla were examined by RT‐qPCR in PMs (n = 3 in each group). F) Pre‐treated with 0.2 µM ONX‐0914 for 6 h, AMs were challenged with 250 µg mL−1 dosage of cigarette smoke extract (CSE) for 24 h, and the M2 marker genes Irf4, Arg1, Mrc1, Ccl17 and Retnla were examined by RT‐qPCR (n = 3 in each group). *p < 0.05, **p < 0.01, ***p < 0.001.
Figure 5
Figure 5
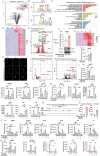
P62 Plays a Key Role in ONX‐0914‐Mediated Suppression of M1 Polarization. A) Heatmaps displaying autophagy‐related genes, especially Sqstm1, in various groups of PMs, including M0, M0+ONX‐0914, M1, and M1+ONX‐0914 (n = 4 independent samples in each group). B) Protein expression levels of P62 were analyzed in PM, AM and RAW264.7 cell line after 0.2 µM ONX‐0914 treatment at different time points by Western blotting analysis (n = 3). C) Autophagy‐related genes were detected after ONX‐0914 treatment in AMs. Mean values ± SEM are acquired from 3 independent experiments. D) After pretreatment with 0.2 µM ONX‐0914 for 6 h, the expression level of P62 was analyzed by Western blotting in M1‐polarized AMs. Statistical analysis were obtained from 3 independent samples in each group. E) The expression of P62 was analyzed in lung tissue after 5 mg kg−1 ONX‐0914 treatment in COPD by Western blotting (n = 3). F) RT‐qPCR analysis detected Sqstm1 expression in AMs after 5 mg kg−1 ONX‐0914 treatment in COPD mice. Mean values ± SEM are from at least 5 independent experiments. G) RAW264.7 cells and AMs were pretreated with 0.2 µM ONX‐0914 for 6 h, followed by stimulation with 40 µg mL−1 and 250 µg mL−1 doses of cigarette smoke extract (CSE) for 24 h, respectively. The gene Sqstm1 was examined by RT‐qPCR (n = 4). H) After 0.2 µM ONX‐0914 treatment in M1‐polarized AMs and silencing of P62 expression with siRNA, the expression of P62 was analyzed by Western blotting (n = 3). I) In M1‐polarized AMs, after silencing the expression of P62 with siRNA and treating with 0.2 µM ONX‐0914, the expression of M1 marker genes (Nos2, Il12b, Il1b, Ccl2, Cxcl2, Cxcl3) was detected by RT‐qPCR (n = 3). J) After knockdown the expression of P62 with siRNA and pretreating with 0.2 µM ONX‐0914, AMs were stimulated with CSE (250 µg mL−1). The expression of Sqstm1 and M1 marker genes (Nos2, Il1b, Tnf, Ccl2) was detected by RT‐qPCR (n = 3). *p < 0.05, **p < 0.01, ***p < 0.001.
Figure 6
Figure 6
ONX‐0914 Suppresses M1 Polarization via NRF1 and NRF2‐P62 Signaling Pathway. A) Differential binding of transcription factors between M1+ONX‐0914 and M1 predicted by TOBIAS. This plot indicates a significant increase in NRF1 (MAFG::Nfe2l1) and NRF2 (MAF::Nfe2l2) binding score following ONX‐0914 treatment. B) Mouse genome NRF1 and NRF2 motifs obtained from JASPAR 2022 database. C) Gene Ontology enrichment analysis of genes upregulated by ONX‐0914 treatment in M1 phenotype of PMs. The y‐axis represents the GO terms, and the x‐axis indicates the gene count. D) Heatmaps displaying proteasome‐related genes, the NRF1 downstream regulated genes, in M0, M0+ONX‐0914, M1, and M1+ONX‐0914 group (n = 4). E) Volcano plot showing DEGs between ONX‐0914‐treated and untreated M1 AMs. Genes meeting dual thresholds of FDR <0.05 and log2 (fold change) >1 are highlighted in red, indicating significant upregulation or downregulation after ONX‐0914 treatment. F) Protein expression level of NRF1 analyzed by Western blotting in ONX‐0914‐treated M1 AMs. Data was obtained from 3 independent samples in each group. G) Heatmaps displaying anti‐oxidative stress‐related genes, the NRF2 downstream regulated genes, in M0, M0+ONX‐0914, M1, and M1+ONX‐0914 group of PMs (n = 4). H) Representative IF images of NRF2 after applying 0.2 µM ONX‐0914 to AMs for 24 h. I) After AMs were pretreated with 0.2 µM ONX‐0914 for 6 h, and then stimulated with 250 µg mL−1 dosage of CSE for 24 h, the gene Nfe2l2 was examined by RT‐qPCR (n = 3). J and K) Transcriptional changes in genes associated with NRF1‐increased binding sites (J) and NRF2‐increased binding sites (K) after ONX‐0914 treatment in M1 of AMs. The plot demonstrates that the regulatory activity of upregulated genes significantly surpasses that of downregulated genes (n = 3). L) After silencing the expression of NRF1 with siRNA and treating M1‐polarized AMs with 0.2 µM ONX‐0914, the expression of Nfe2l1, Sqstm1, and M1 marker genes (Nos2, Il12b) were detected by RT‐qPCR (n = 3). M) After silencing the expression of NRF2 with siRNA and treating M1‐polarized AMs with 0.2 µM ONX‐0914, the expression of Nfe2l2, Sqstm1, and M1 marker genes (Nos2, Il12b, Il1b, Tnf) were detected by RT‐qPCR (n = 3). N) Integrative Genomics Viewer (IGV) plot illustrates the binding landscape of the NRF2 transcription factor to Sqstm1 in M0, M0+ONX‐0914, M1 and M1+ONX‐0914. The upper 4 tracks display the signal intensity of NRF2 binding to Sqstm1, and the lower 4 tracks display the specific locations where NRF2 binding peaks were identified, which suggest the potential regulatory roles in Sqstm1 gene expression after ONX‐0914 treatment in M1 macrophages. O) CUT&Tag‐qPCR shows that the binding affinity of NRF2 to Sqstm1 enhancer and promoter is significantly increased under ONX‐0914 treatment in M1 macrophages. P) RT‐qPCR analysis detected Nfe2l2, Sqstm1 and M1 marker genes Nos2, Il12b, Il1b, and Il6 in each group (n = 3). After silencing the expression of NRF2 with siRNA and overexpression of P62 with p3xFLAG‐P62 var2 plasmid, 0.2 µM ONX‐0914 was used to treat M1‐polarized AMs, and the expression of Nfe2l2, Sqstm1, and M1 marker genes (Nos2, Il12b, Il1b and Il6) were detected by RT‐qPCR (n = 3). Q) After silencing the expression of NRF2 with siRNA and using 0.2 µM ONX‐0914 pretreated CSE (250 µg mL−1) stimulation of AMs, Sqstm1 and M1 marker genes (Nos2, Il12b, Il1b, Tnf) were detected by RT‐qPCR (n = 3). *p < 0.05, **p < 0.01, ***p < 0.001.
Figure 7
Figure 7
ONX‐0914 Suppresses M2 Polarization via IRF4 Signaling Pathway. A) After pre‐treated with 0.2 µM ONX‐0914 for 6 h and ONX‐0914 administration, the expression of P62 was analyzed by Western blotting in M2 polarization of PM (n = 3). B) In M2‐polarized AMs, after silencing the expression of P62 with siRNA and treating with 0.2 µM ONX‐0914, the expression of M2 marker genes (Arg1, Ccl17, Mrc1, and Retnla) was detected by RT‐qPCR (n = 3). C) After silencing the expression of NRF2 with siRNA and treating M2‐polarized AMs with 0.2 µM ONX‐0914, the expression of Nfe2l2, and M2 marker genes (Irf4, and Mrc1) were detected by RT‐qPCR (n = 3). D) After pre‐treated with 0.2 µM ONX‐0914 for 6 h and challenge with ONX‐0914, the expression of STAT6 and p‐STAT6 were detected and analyzed by Western blotting in M2 polarization of PMs (n = 3). E) In M2‐polarized PMs, after the overexpression of IRF4 with plasmid and treating with 0.2 µM ONX‐0914, the M2 marker genes (Irf4, Arg1, Ccl17, and Mrc1) were detected by RT‐qPCR(n = 3). F) After the overexpression of IRF4 with plasmid and pretreatment of 0.2 µM ONX‐0914 for 6 h and followed by treating with IL‐4 induced M2 polarization of AMs for 24 h, the M2 marker genes (Irf4, Arg1, Ccl17) were detected by RT‐qPCR (n = 3). *p < 0.05, **p < 0.01, ***p < 0.001.
Figure 8
Figure 8
Nanoparticle‐Mediated Delivery of ONX‐0914 to Macrophages Shows Therapeutic Potential for Emphysema. A) Dynamic Light Scattering (DLS) analysis of the encapsulated ONX‐0914 nanoparticles. B) ZETA potential of the encapsulated ONX‐0914 nanoparticles. C) Transmission Electron Microscopy (TEM) image of the encapsulated ONX‐0914 nanoparticles. D) Experimental setup for COPD experiment. ONX‐0914 and nanoONX‐0914 were intranasally administered one day post‐LPS + Elastase challenge, three times weekly for four weeks to induce COPD and n ≥ 6 for each group. E) H&E staining observed the changes of in lung tissue of each group. F) The inflammation and structural destruction of lung tissues were statistically analyzed with inflammation score, mean linear intercept (MLI) and destruction index (DI). G) Neutrophil count and neutrophil frequency in BAL fluid detected in each group using Sysmex hematology analyzer (n ≥ 4). H) Relative gene expression of M1 marker genes (Tnf, Il1b, Cxcl1), Psmb8, and Psmb9 in AMs of each group by RT‐qPCR (n ≥ 4). I) Experimental setup for LPS + CS mouse models. ONX‐0914 and nanoONX‐0914 were intranasally administered one day post‐LPS challenge, three times weekly for four weeks to induce COPD and each group contains at least 6 mice. J) Pulmonary function indexes, including FVC, FEV100 and TLC, were recorded in each group using PFT Pulmonary Maneuvers. K) Representative images of H&E staining displayed the alveolar changes in lung tissue in each group. L) The inflammation of lung tissue was statistically analyzed by inflammation score. M) Cellular infiltration in BAL fluid was accessed in each group by flow cytometry analysis. N) RT‐qPCR analysis detected M1 marker genes (Nos2, Il1b, Il12b, Il6 and Tnf) in lung tissue of each group. Data was collected from 8 independent mouse. O) The schematic diagram shows that ONX‐0914 targets immunoproteasome subunits LMP7 and LMP2 in macrophages to suppress M1 polarization via activating NRF1 and NRF2‐P62 axis, while the suppression of M2 polarization is regulated by inhibiting IRF4, which ultimately ameliorates experimental emphysema. *p < 0.05, **p < 0.01, ***p < 0.001.

References

    1. Rabe K. F., Watz H., Lancet 2017, 389, 1931. - PubMed
    1. Schirmer M., Garner A., Vlamakis H., Xavier R. J., Nat. Rev. Microbiol. 2019, 17, 497. - PMC - PubMed
    1. Brightling C., Greening N., Eur. Respir. J. 2019, 54. - PubMed
    1. Leitao Filho F. S., Takiguchi H., Akata K., Ra S. W., Moon J. Y., Kim H. K., Cho Y., Yamasaki K., Milne S., Yang J., Yang C. W. T., Li X., Nislow C., van Eeden S. F., Shaipanich T., Lam S., Leung J. M., Sin D. D., Am J. Respir. Crit. Care Med. 2021, 204, 1143. - PubMed
    1. Labaki W. W., Rosenberg S. R., Ann. Intern. Med. 2020, 173, ITC17. - PubMed

MeSH terms

LinkOut - more resources