. 2024 Oct 8;121(41):e2414037121.
doi: 10.1073/pnas.2414037121. Epub 2024 Oct 2.

Ultrafast transient absorption spectra and kinetics of human blue cone visual pigment at room temperature

Affiliations

Ultrafast transient absorption spectra and kinetics of human blue cone visual pigment at room temperature

Arjun Krishnamoorthi et al. Proc Natl Acad Sci U S A. .

Abstract

The ultrafast photochemical reaction mechanism, transient spectra, and transition kinetics of the human blue cone visual pigment have been recorded at room temperature. Ultrafast time-resolved absorption spectroscopy revealed the progressive formation and decay of several metastable photo-intermediates, corresponding to the Batho to Meta-II photo-intermediates previously observed with bovine rhodopsin and human green cone opsin, on the picosecond to millisecond timescales following pulsed excitation. The experimental data reveal several interesting similarities and differences between the photobleaching sequences of bovine rhodopsin, human green cone opsin, and human blue cone opsin. While Meta-II formation kinetics are comparable between bovine rhodopsin and blue cone opsin, the transition kinetics of earlier photo-intermediates and qualitative characteristics of the Meta-I to Meta-II transition are more similar for blue cone opsin and green cone opsin. Additionally, the blue cone photo-intermediate spectra exhibit a high degree of overlap with uniquely small spectral shifts. The observed variation in Meta-II formation kinetics between rod and cone visual pigments is explained based on key structural differences.

Keywords: blue cone opsin; cone photo-intermediates; cone visual pigments; phototransduction; ultrafast spectroscopy.


Conflict of interest statement

Competing interests statement:The authors declare no competing interest.

Figures
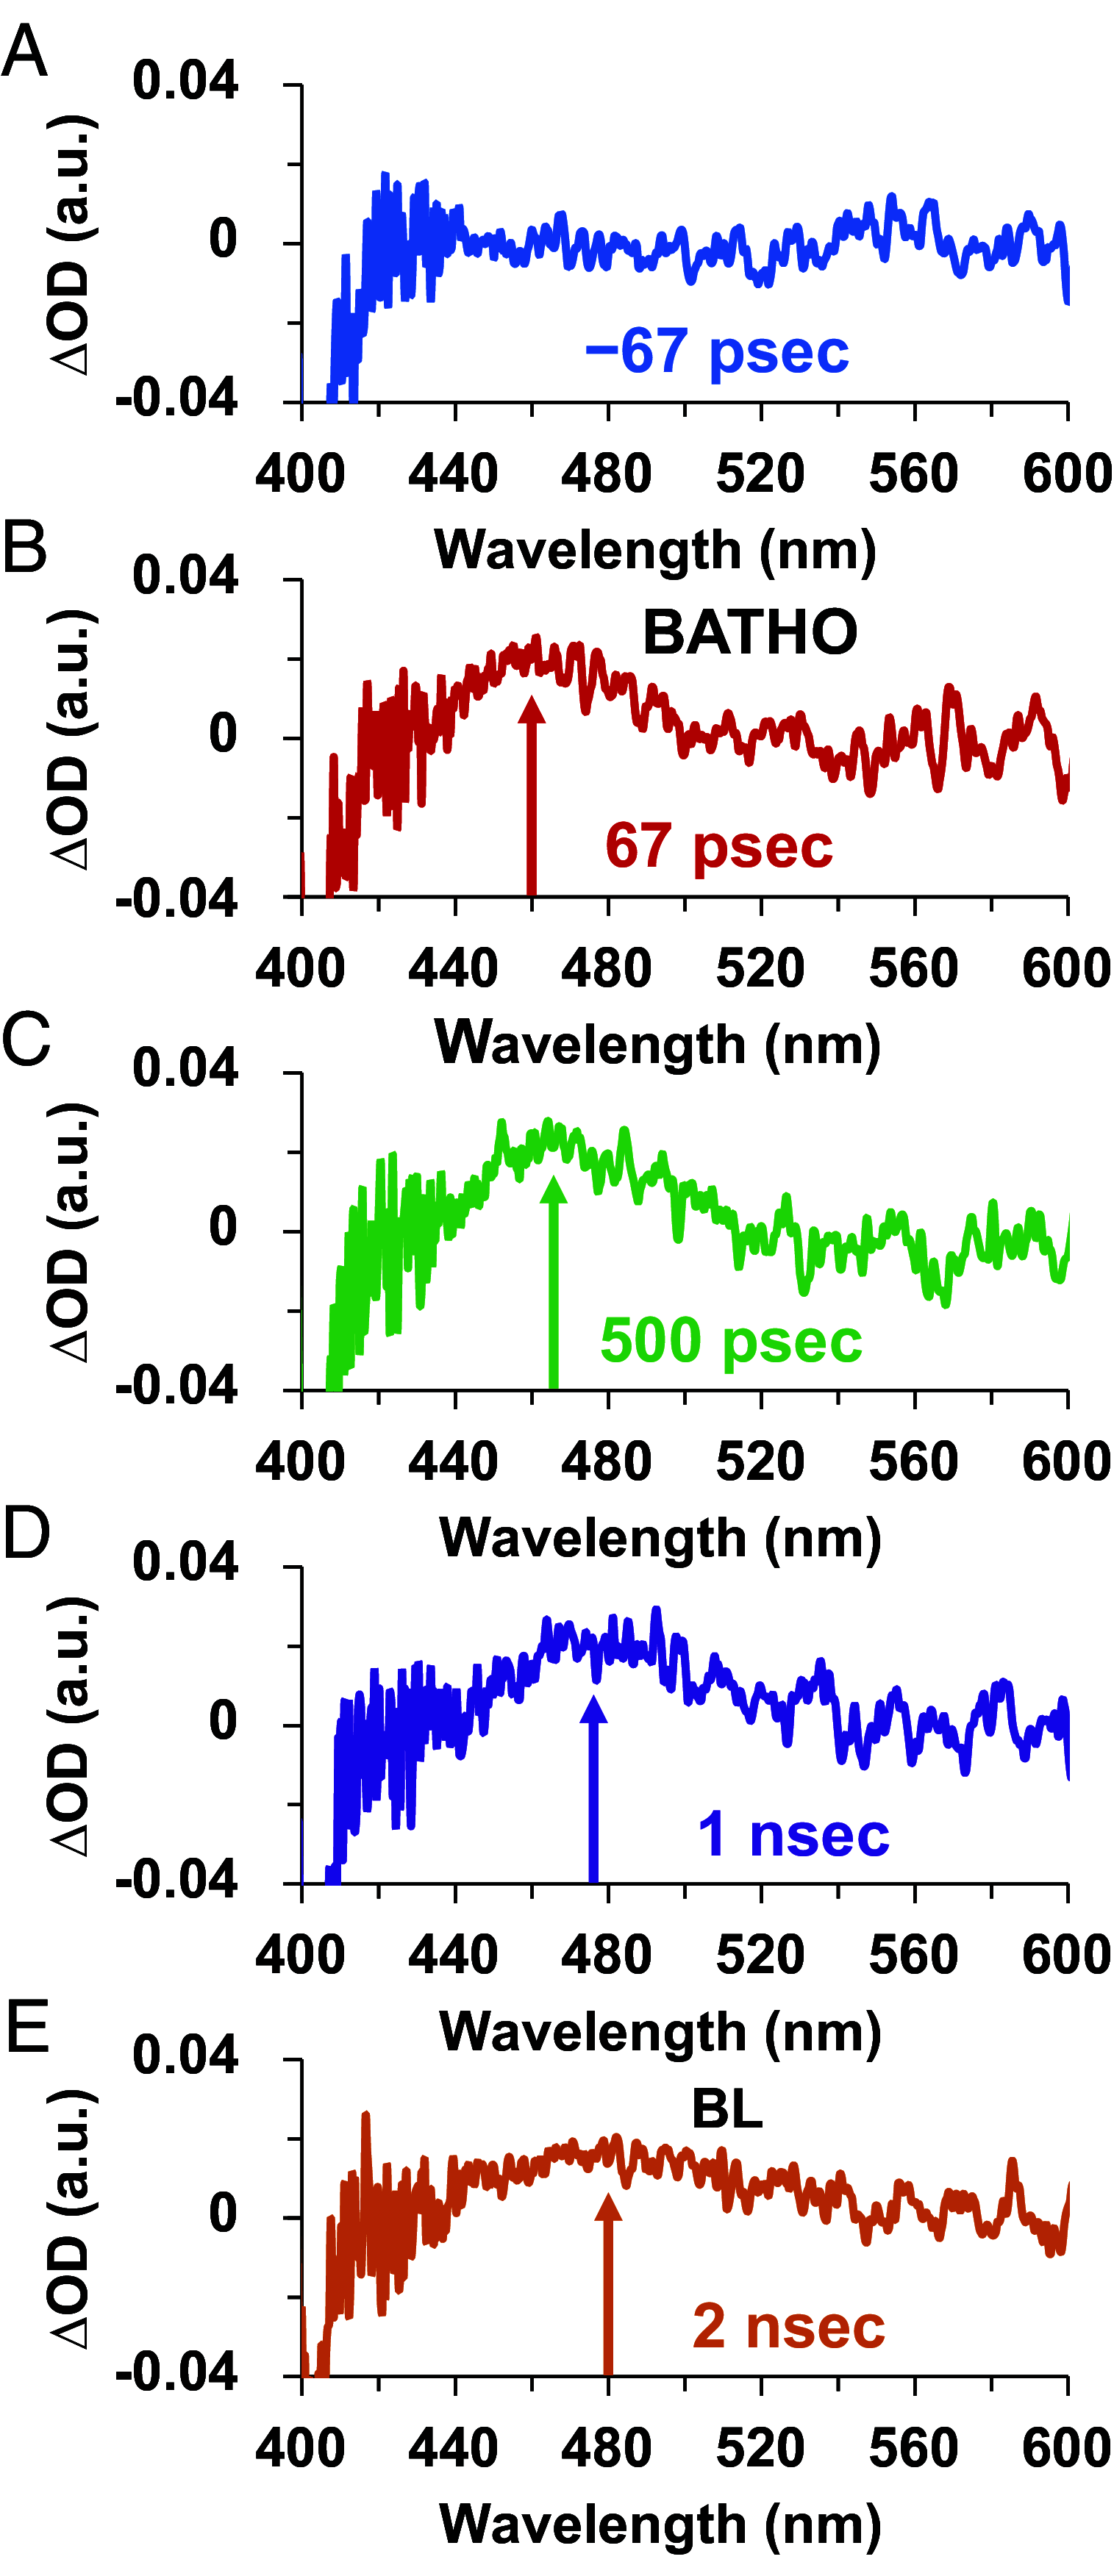
Fig. 1.
Fig. 1.
Picosecond to nanosecond transient absorption spectra of human blue cone opsin at pump–probe delay times of (A) −67 psec, (B) 67 psec (Batho-intermediate), (C) 500 psec, (D) 1 nsec, and (E) 2 nsec (BL-intermediate). The arrow at each individual pump–probe delay time designates the approximate wavelength of the corresponding ΔOD band maximum. Note the progressive redshift of the ΔOD band maximum with increasing pump–probe delay time.
Fig. 2.
Fig. 2.
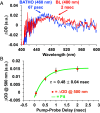
Picosecond to nanosecond transient absorption spectra and kinetics of human blue cone opsin. (A) Picosecond to nanosecond transient absorption spectra at pump–probe delay times of 67 psec (blue) and 2 nsec (red), demonstrating the conversion of the Batho-intermediate into a distinct BL-intermediate for human blue cone opsin. The approximate ΔOD band maxima of the photo-intermediates are noted. (B) Corresponding picosecond formation kinetics for the BL-intermediate based on the increase in the average ΔOD at ~500 nm. Each individual data point corresponds to the average ΔOD value computed across several pump laser shots at a given pump–probe delay time, and the error bars at each data point represent one SD from the mean.
Fig. 3.
Fig. 3.
Nanosecond transient absorption spectra of human blue cone opsin, illustrating the decay of the BL-intermediate and formation of the Lumi-intermediate on the nanosecond timescale. The spectra at each pump–probe delay time are computed based on the exponential fittings of the ΔOD kinetic traces at each recorded probe wavelength.
Fig. 4.
Fig. 4.
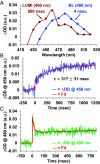
Nanosecond transient absorption spectra and kinetics of human blue cone opsin. (A) Nanosecond transient absorption spectra of human blue cone opsin at pump–probe delay times of 4 nsec (blue) and 800 nsec (red), which are assigned to the BL-intermediate and Lumi-intermediate, respectively. The approximate ΔOD band maxima of the photo-intermediates are noted. (B) Nanosecond kinetic trace recorded at a probe wavelength of 450 nm, corresponding to the formation kinetics of the Lumi-intermediate. (C) Nanosecond kinetic trace recorded at a probe wavelength of 480 nm, demonstrating the considerable overlap in the BL-intermediate and Lumi-intermediate ΔOD spectra.
Fig. 5.
Fig. 5.
Microsecond to millisecond transient absorption spectra and kinetics of human blue cone opsin. (A) Microsecond transient absorption spectra of human blue cone opsin, illustrating the decay of the Lumi-intermediate and formation of the Meta-I intermediate on the microsecond timescale. (B) Lumi to Meta-I transition kinetics recorded at a probe wavelength of ~440 nm. (C) Microsecond to millisecond transient absorption spectra of human blue cone opsin, illustrating the decay of the Meta-I intermediate and formation of the Meta-II intermediate on the millisecond timescale. (D) Meta-I to Meta-II transition kinetics recorded at a probe wavelength of ~365 nm. Note that for (B) and (D), each individual data point corresponds to the average ΔOD value computed across multiple pump laser shots at a given pump–probe delay time, and the error bars at each data point represent one SD from the mean.
Fig. 6.
Fig. 6.
Summary of the Lumi, Meta-I, and Meta-II photo-intermediate ΔOD spectra recorded for human blue cone opsin on the microsecond to millisecond timescales. The representative timescales and approximate ΔOD band maxima for each photo-intermediate are noted.
Fig. 7.
Fig. 7.
Comparison of the photobleaching sequences for bovine rhodopsin, human green cone opsin, and human blue cone opsin. The approximate ground-state (steady-state) absorption band maximum and photo-intermediate ΔOD band maxima for each visual pigment are noted, along with the corresponding transition time constants. The spectral and kinetic data for bovine rhodopsin and human green cone opsin are based on our previous studies (46, 56, 68).
Fig. 8.
Fig. 8.
Normalized steady-state absorption spectrum of human blue cone opsin solubilized in LMNG-buffer. The arrows designate the pump wavelengths employed in the ultrafast transient absorption experiments.
Fig. 9.
Fig. 9.
Schematic diagram of the nanosecond transient absorption experimental system.
Fig. 10.
Fig. 10.
Schematic diagram of the picosecond transient absorption experimental system.

References

    1. Arshavsky V. Y., Like night and day: Rods and cones have different pigment regeneration pathways. Neuron 36, 1–3 (2002). - PubMed
    1. Fu Y., Yau K.-W., Phototransduction in mouse rods and cones. Pflügers Archiv-Eur. J. Physiol. 454, 805–819 (2007). - PMC - PubMed
    1. Kawamura S., Tachibanaki S., Molecular bases of rod and cone differences. Prog. Retin. Eye Res. 90, 101040 (2022). - PubMed
    1. Luo D.-G., Xue T., Yau K.-W., How vision begins: An odyssey. Proc. Natl. Acad. Sci. U.S.A. 105, 9855–9862 (2008). - PMC - PubMed
    1. Ebrey T., Koutalos Y., Vertebrate photoreceptors. Prog. Retin. Eye Res. 20, 49–94 (2001). - PubMed