. 2024 Oct 2;20(10):e1012449.
doi: 10.1371/journal.pcbi.1012449. eCollection 2024 Oct.

Quantitative evaluation of DNA damage repair dynamics to elucidate predictors of autism vs. cancer in individuals with germline PTEN variants

Affiliations

Quantitative evaluation of DNA damage repair dynamics to elucidate predictors of autism vs. cancer in individuals with germline PTEN variants

Ruipeng Wei et al. PLoS Comput Biol. .

Abstract

Persons with germline variants in the tumor suppressor gene phosphatase and tensin homolog, PTEN, are molecularly diagnosed with PTEN hamartoma tumor syndrome (PHTS). PHTS confers high risks of specific malignancies, and up to 23% of the patients are diagnosed with autism spectrum disorder (ASD) and/or developmental delay (DD). The accurate prediction of these two seemingly disparate phenotypes (cancer vs. ASD/DD) for PHTS at the individual level remains elusive despite the available statistical prevalence of specific phenotypes of the syndrome at the population level. The pleiotropy of the syndrome may, in part, be due to the alterations of the key multi-functions of PTEN. Maintenance of genome integrity is one of the key biological functions of PTEN, but no integrative studies have been conducted to quantify the DNA damage response (DDR) in individuals with PHTS and to relate to phenotypes and genotypes. In this study, we used 43 PHTS patient-derived lymphoblastoid cell lines (LCLs) to investigate the associations between DDR and PTEN genotypes and/or clinical phenotypes ASD/DD vs. cancer. The dynamics of DDR of γ-irradiated LCLs were analyzed using the exponential decay mathematical model to fit temporal changes in γH2AX levels which report the degree of DNA damage. We found that PTEN nonsense variants are associated with less efficient DNA damage repair ability resulting in higher DNA damage levels at 24 hours after irradiation compared to PTEN missense variants. Regarding PHTS phenotypes, LCLs from PHTS individuals with ASD/DD showed faster DNA damage repairing rate than those from patients without ASD/DD or cancer. We also applied the reaction-diffusion partial differential equation (PDE) mathematical model, a cell growth model with a DNA damage term, to accurately describe the DDR process in the LCLs. For each LCL, we can derive parameters of the PDE. Then we averaged the numerical results by PHTS phenotypes. By performing simple subtraction of two subgroup average results, we found that PHTS-ASD/DD is associated with higher live cell density at lower DNA damage level but lower cell density level at higher DNA damage level compared to LCLs from individuals with PHTS-cancer and PHTS-neither.


Conflict of interest statement

The authors have declared that no competing interests exist.

Figures
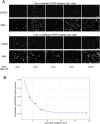
Fig 1
Fig 1. Quantification and normalization of DNA damage repair kinetics of lymphoblastoid cell lines (LCLs) derived from individuals with PHTS-ASD/DD, PHTS-cancer, and the healthy donor.
A. Representative images of γH2AX and DNA immunofluorescence. B. A representative DNA damage exponential decay curve deduced from the normalized averages of fluorescence intensities of γH2AX in individual cells.
Fig 2
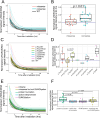
Fig 2. Comparison of DNA repairing capacity of LCLs with various PTEN genotypes.
A. DNA repair kinetics after 3 Gy irradiation are depicted by normalized DNA damage exponential decay curves for 43 LCLs color-coded according to their PTEN variant effect types. B. Box plot illustrates the distribution of DNA damage levels (normalized γH2AX/DNA signal intensity) at 24 hrs after irradiation for LCLs of indicated PTEN variants. The purple line represents the average DNA damage level of wildtype (WT) LCL replicates. Wilcoxon statistical analysis detected that R335* residual levels of DNA damage were significantly higher than those observed in R173C and wild-type. C. Normalized DNA damage exponential decay model of 43 PHTS LCLs colored by their PTEN variant category. Inframe indicates the LCL contains PTEN c.39_41delAAG; SUMOylation indicates LCLs which contain PTEN p.Lys254Thr or p.Asp252Val variants; protein truncation/loss indicate LCLs contain PTEN variants which cause PTEN truncation, deletion or loss; missense but not SUMOylation indicates LCLs contain PTEN missense variants but not the p.Lys254Thr or p.Asp252Va variants; splice site or promoter indicates LCLs contain splice site PTEN variants or those within the promoter. D. Box plot of DNA damage level (normalized γH2AX/DNA signal intensity) at 24 hrs after irradiation clustered by different PTEN variant categories described in panel G. The purple line represents the average DNA damage level of wildtype LCL replicates. LCLs carrying truncated variants or large deletion (c.80-?_164+?del (E2 del) have significant higher residual DNA damage levels than other subgroups, splice site/promoter, SUMOylation, missense, but not SUMOylation, protein truncation. E. Normalized DNA damage exponential decay model of 43 PHTS LCLs colored by their PTEN variant effect. F. Box plots of DNA damage levels (normalized γH2AX/DNA signal intensity) at 24 hrs after irradiation categorized by PTEN variant effect. The horizontal purple line represents the average DNA damage level of wildtype LCL replicates. Wilcoxon statistical analysis detected significant DNA damage residuals at 24 hrs after irradiation between LCLs carrying nonsense PTEN variants and missense PTEN variants.
Fig 3
Fig 3. DNA damage repairing rate of PHTS samples.
A. Normalized DNA damage decay curves of LCLs derived from 20 age and sex matched patients with PHTS-ASD/DD, PHTS-cancer, and from a PTEN-wild-type donor with several biological replicates from every batch. B. Normalized DNA damage repairing exponential decay model of 43 PHTS LCLs colored by PHTS phenotype. C. Box plots of the half-lives of DNA damage deduced from the exponential decay model, clustered by phenotypes from 43 PHTS LCLs. Detected by Wilcoxon statistical test, PHTS-neither related LCLs have higher DNA damage decay half-life than PHTS-ASD/DD. D. Box plots of the half-lives of DNA damage deduced from the exponential decay model of LCLs derived from patients with PTEN nonsense and missense variants, as well as wild-type PTEN donor biological replicates. E. Upper panel is a box plot of the exponential decay model half-life DNA damage repair capacity after irradiation of LCLs harboring PTEN nonsense variants, with samples clustered by phenotype. Detected by Wilcoxon statistical test, PHTS-neither related LCLs have higher DNA damage decay half-life than PHTS-ASD/DD. The lower panel is a box plot of the exponential decay model half-life DNA damage repair capacity after irradiation of LCLs harboring PTEN missense variants, with samples clustered by phenotype.
Fig 4
Fig 4. Box plot of LCLs’ difference of maximum growth rate with and without of different 3 Gy irradiation categorized by PHTS phenotypes.
Detected by Wilcoxon statistical test, PHTS-cancer related LCLs have higher maximum cell growth rate change than PHTS-ASDCancer and PHTS-neither.
Fig 5
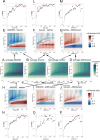
Fig 5. Heatmaps of numerical results generated from the reaction-diffusion partial differential model, subcategorizing by phenotypes and dot plots of the statistical comparison results between different numerical results of phenotypes.
A-D: Average numerical result of LCLs source from PHTS-ASD/DD individuals, PHTS-cancer individuals, PHTS-neither individuals, PHTS-ASDCancer individuals. Color represents the cell density, the deeper the higher. E-G: Heatmap of the difference between average numerical result of LCLs source from PHTS-ASD/DD individuals and average numerical result of LCLs source from PHTS-cancer, PHTS-cancer individuals and average numerical result of LCLs source from PHTS-neither, PHTS-neither individuals and average numerical result of LCLs source from PHTS-ASDCancer, respectively. H-J: Heatmap of the difference between average numerical result of LCLs source from PHTS-ASD/DD individuals and average numerical result of LCLs source from PHTS-neither, PHTS-ASD/DD and PHTS-ASDCancer, PHTS-Cancer and PHTS-ASDCancer respectively. K-M: Dot plots of the p values generated by Kolmogorov–Smirnov test between average numerical result of LCLs source from PHTS-ASD/DD individuals and average numerical result of LCLs source from PHTS-cancer, PHTS-cancer individuals and average numerical result of LCLs source from PHTS-neither, PHTS-neither individuals and average numerical result of LCLs source from PHTS-ASDCancer, respectively. Each black dot represents the p value generated at the corresponding time point. Red dashed line represents p value = 0.05. N-P: Dot plots of the p values generated by Kolmogorov–Smirnov test between average numerical result of LCLs source from PHTS-ASD/DD individuals and average numerical result of LCLs source from PHTS-neither, PHTS-ASD/DD and PHTS-ASDCancer, PHTS-Cancer and PHTS-ASDCancer respectively. Each black dot represents the p value generated at the corresponding time point. Red dashed line represents p value = 0.05.

Similar articles

References

    1. Bassi C, Ho J, Srikumar T, Dowling RJO, Gorrini C, Miller SJ, et al.. Nuclear PTEN Controls DNA Repair and Sensitivity to Genotoxic Stress. Science. 2013. Jul 26;341(6144):395–9. doi: 10.1126/science.1236188 - DOI - PMC - PubMed
    1. Chen ZH, Zhu M, Yang J, Liang H, He J, He S, et al.. PTEN interacts with histone H1 and controls chromatin condensation. Cell Rep. 2014. Sep 25;8(6):2003–14. doi: 10.1016/j.celrep.2014.08.008 - DOI - PMC - PubMed
    1. Feng J, Liang J, Li J, Li Y, Liang H, Zhao X, et al.. PTEN Controls the DNA Replication Process through MCM2 in Response to Replicative Stress. Cell Rep. 2015. Nov 17;13(7):1295–303. doi: 10.1016/j.celrep.2015.10.016 - DOI - PubMed
    1. Hou SQ, Ouyang M, Brandmaier A, Hao H, Shen WH. PTEN in the maintenance of genome integrity: From DNA replication to chromosome segregation. BioEssays. 2017;39(10):1700082. doi: 10.1002/bies.201700082 - DOI - PMC - PubMed
    1. Yehia L, Eng C. 65 YEARS OF THE DOUBLE HELIX: One gene, many endocrine and metabolic syndromes: PTEN-opathies and precision medicine. Endocr Relat Cancer. 2018. Aug 1;25(8):T121–40. doi: 10.1530/ERC-18-0162 - DOI - PubMed