. 2024 Oct 4;10(40):eado8231.
doi: 10.1126/sciadv.ado8231. Epub 2024 Oct 2.

SRSF6 modulates histone-chaperone HIRA splicing to orchestrate AR and E2F activity in prostate cancer

Affiliations

SRSF6 modulates histone-chaperone HIRA splicing to orchestrate AR and E2F activity in prostate cancer

Antonio J Montero-Hidalgo et al. Sci Adv. .

Abstract

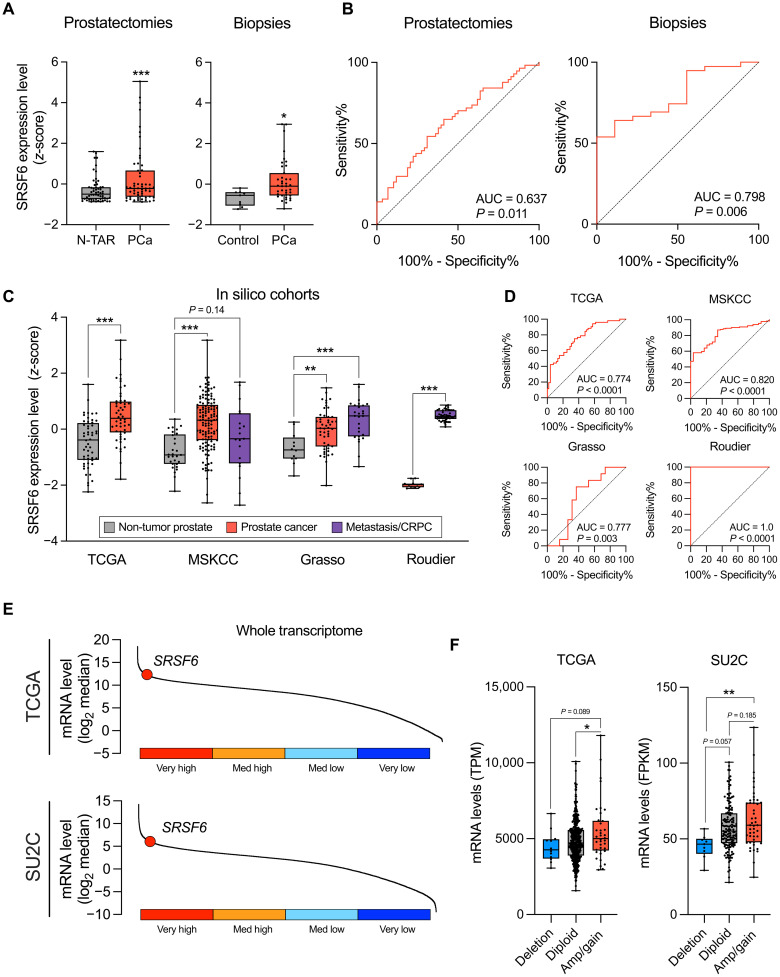
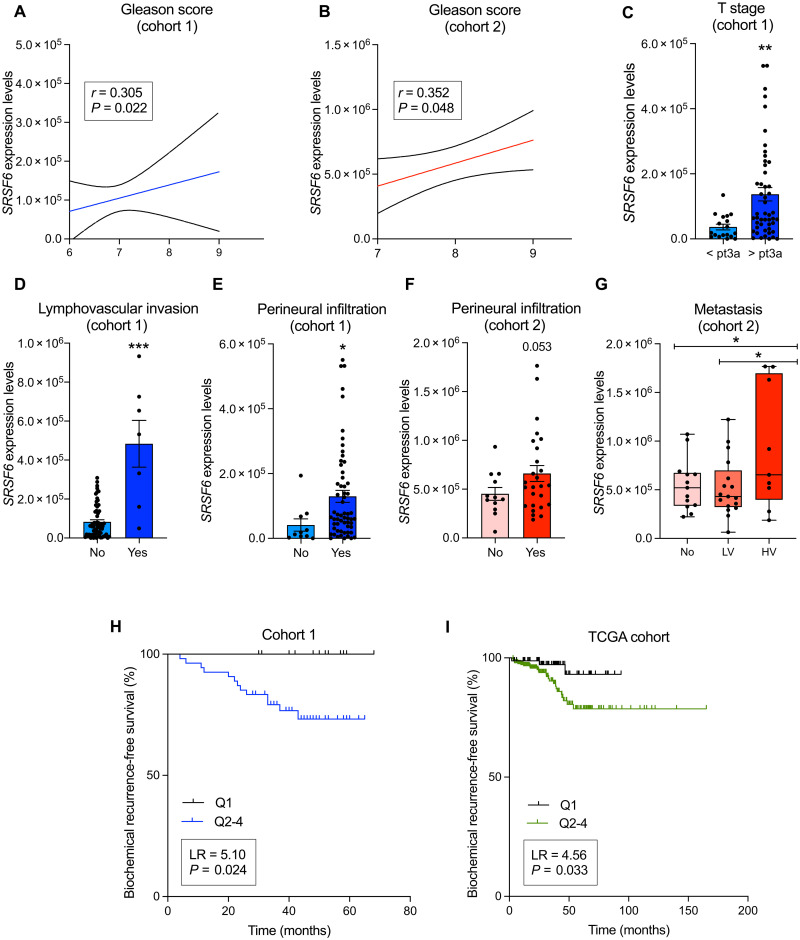
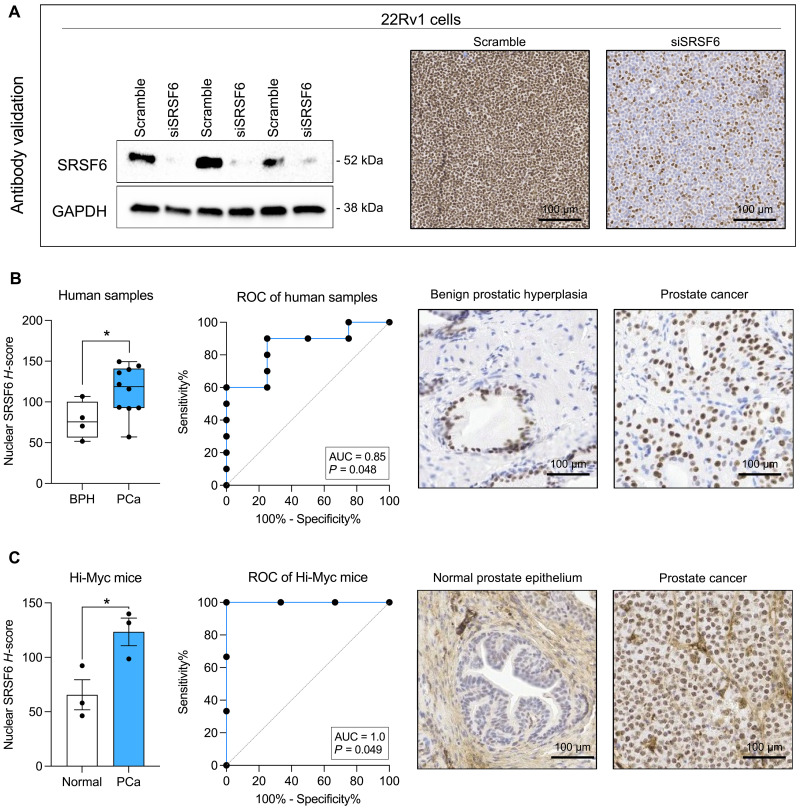
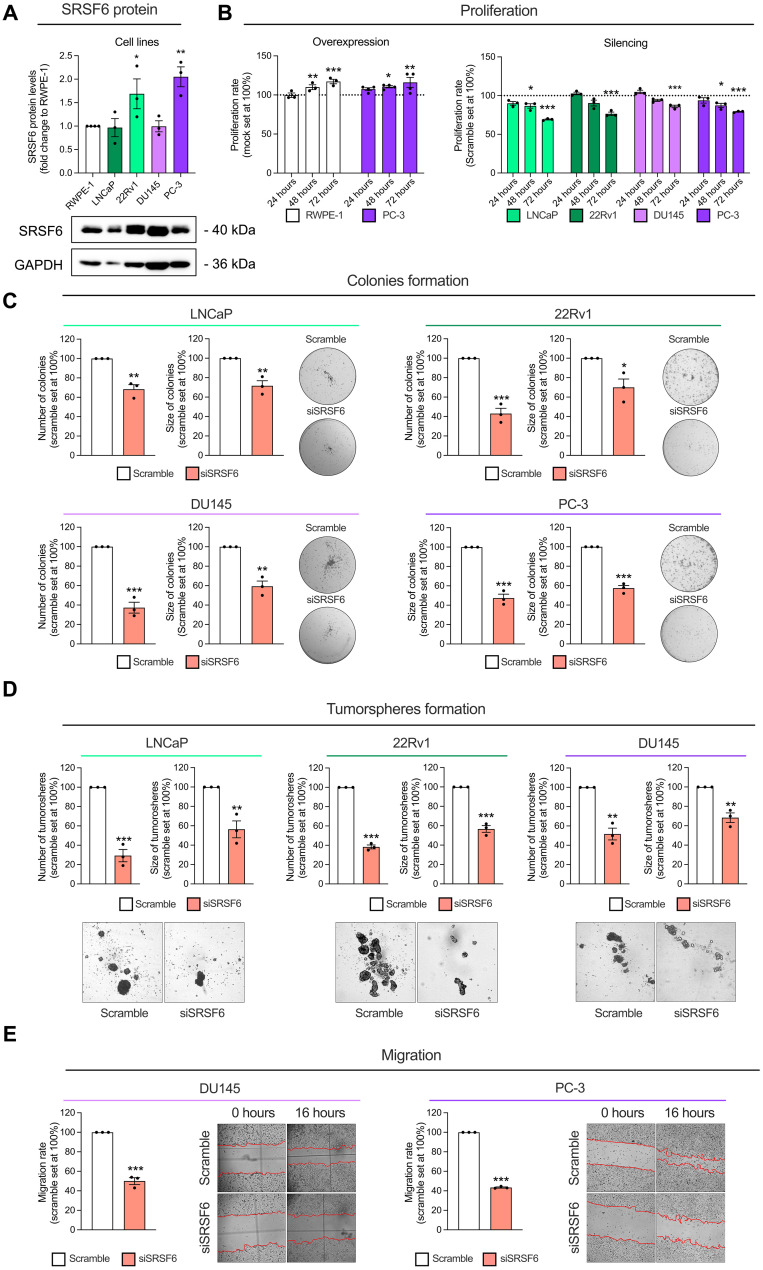
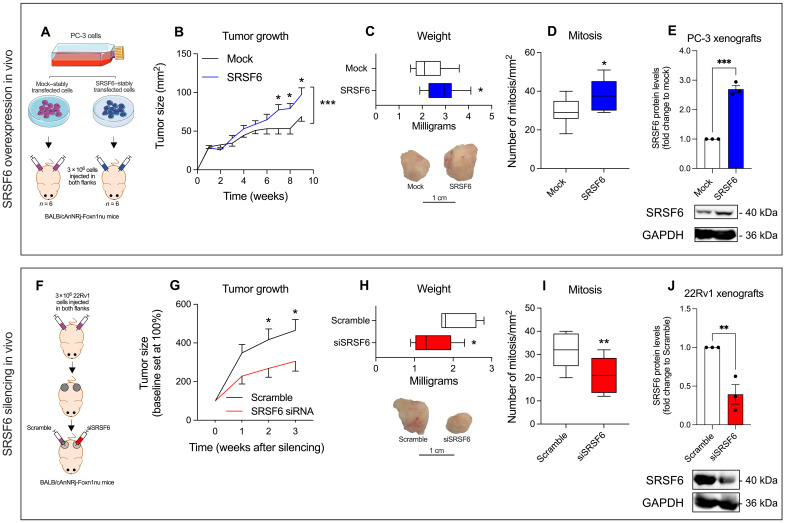
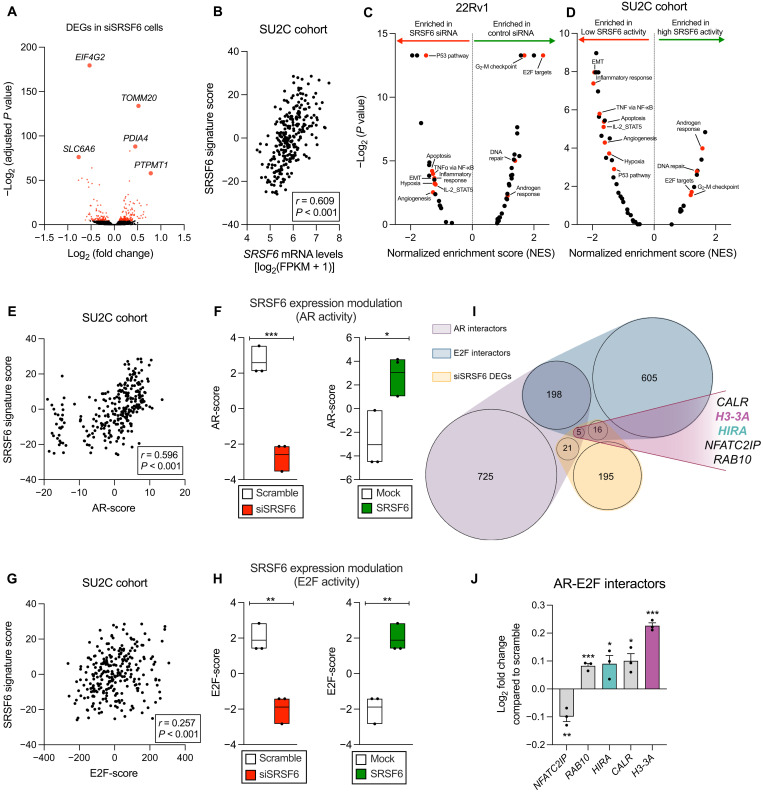
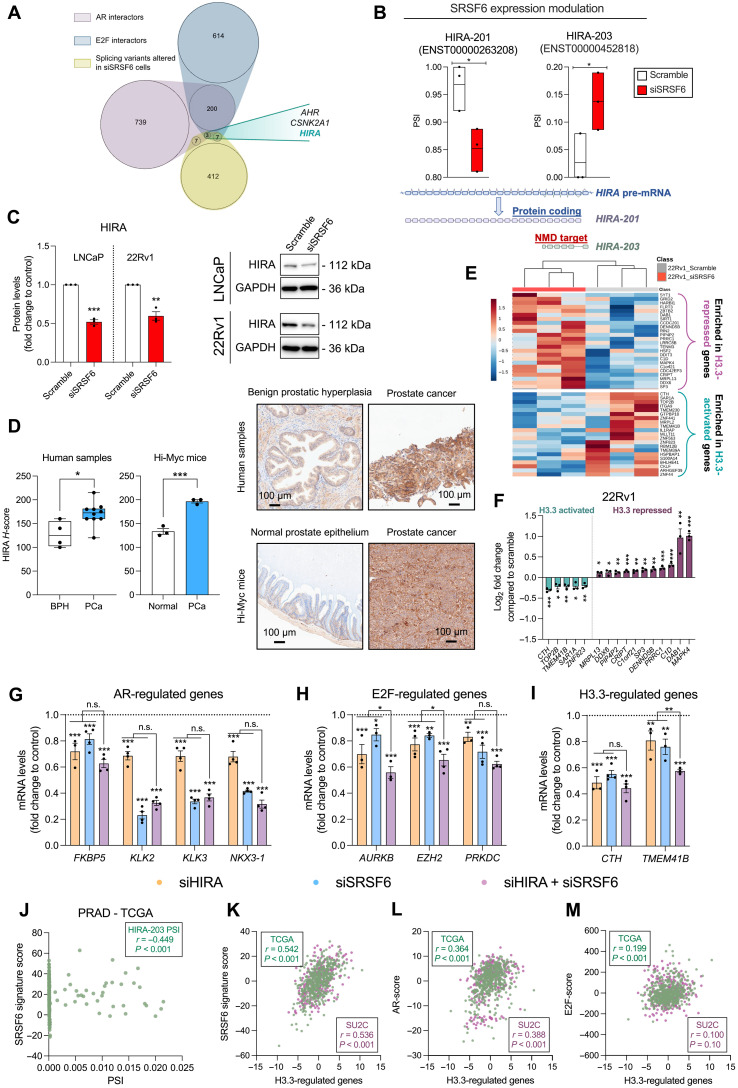
Despite novel therapeutic strategies, advanced-stage prostate cancer (PCa) remains highly lethal, pointing out the urgent need for effective therapeutic strategies. While dysregulation of the splicing process is considered a cancer hallmark, the role of certain splicing factors remains unknown in PCa. This study focuses on characterizing the levels and role of SRSF6 in this disease. Comprehensive analyses of SRSF6 alterations (copy number/mRNA/protein) were conducted across eight well-characterized PCa cohorts and the Hi-MYC transgenic model. SRSF6 was up-regulated in PCa samples, correlating with adverse clinical parameters. Functional assays, both in vitro (cell proliferation, migration, colony, and tumorsphere formation) and in vivo (xenograft tumors), demonstrated the impact of SRSF6 modulation on critical cancer hallmarks. Mechanistically, SRSF6 regulates the splicing pattern of the histone-chaperone HIRA, consequently affecting the activity of H3.3 in PCa and breast cancer cell models and disrupting pivotal oncogenic pathways (AR and E2F) in PCa cells. These findings underscore SRSF6 as a promising therapeutic target for PCa/advanced-stage PCa.


Figures

Fig. 1.
Fig. 1.. mRNA levels and CNA of SRSF6 in patients’ prostate samples.
(A) Comparison of SRSF6 mRNA levels between non-tumor adjacent regions (N-TARs) versus PCa samples from the prostatectomy cohort (left; n = 84), and control (n = 9) versus PCa samples (n = 42) from the biopsy cohort (right). Data represent the min-to-max boxplot, with median of mRNA expression levels adjusted by normalization factor (calculated from ACTB and GAPDH expression levels) and standardized by z-score. (B) Receiver operating characteristic (ROC) curves of SRSF6 mRNA levels to distinguish between tumor and non-tumor samples from prostatectomy (left) and biopsy (right) cohorts. Area under the curve (AUC) and P value are depicted in the plots. (C) Comparison of SRSF6 mRNA levels between non-tumor prostate tissues, PCa, and/or metastatic/CRPC samples from The Cancer Genome Atlas (TCGA), Memorial Sloan Kettering Cancer Center (MSKCC), Grasso, and Roudier cohorts. Data represent the min-to-max boxplot, with median of SRSF6 expression levels standardized by z-score. (D) ROC curves of SRSF6 mRNA levels to distinguish between PCa and non-tumor prostate samples from the TCGA (top left), MSKCC (top right), and Grasso (bottom left) cohorts and between CRPC and primary PCa samples from Roudier cohort (bottom right). AUC and P value are depicted in the plots. (E) Ranked expression of SRSF6 across whole transcriptome in the TCGA (top) and SU2C (bottom) cohorts. (F) Association between SRSF6 mRNA levels (min-to-max boxplot, with median) and SRSF6 copy number alterations (CNAs) in the TCGA (left) and SU2C (right) cohorts. Asterisks (*P < 0.05, **P < 0.01, and ***P < 0.001) indicate statistically significant differences between groups. TPM, transcript per million; FPKM, fragments per kilobase million.
Fig. 2.
Fig. 2.. Associations and correlations of SRSF6 expression levels with clinical parameters of PCa aggressiveness.
(A and B) Correlation of Gleason score with SRSF6 mRNA levels in the prostatectomy (A) and biopsy (B) cohorts. (C to E) Associations of SRSF6 mRNA levels and T stage (C), lymphovascular invasion (D), and perineural infiltration (E) in the prostatectomy cohort. (F and G) Associations of SRSF6 mRNA levels and perineural infiltration (F) and metastasis (LV, low volume; HV, high volume) (G) in the biopsy cohort. (H and I) Association between biochemical progression-free survival and SRSF6 mRNA levels [quartile 1 (Q1) versus Q2-4)] in the prostatectomy (H) and TCGA (I) cohorts. SRSF6 mRNA levels are adjusted by normalization factor (calculated from ACTB and GAPDH expression levels). Correlations data are represented by mean (connecting line) and error bands (pointed line). Data of associations represent the means ± SEM of mRNA expression levels. Asterisks (*P < 0.05, **P < 0.01, and ***P < 0.001) indicate statistically significant differences between groups. LR, log-rank.
Fig. 3.
Fig. 3.. Immunohistochemical analysis of SRSF6 in non-tumor prostate and PCa samples.
(A) Antibody validation by Western blot (left) and immunohistochemistry (IHC; right) in response to SRSF6 small interfering RNA (siRNA). Glyceraldehyde-3-phosphate dehydrogenase (GAPDH) was used as housekeeping for Western blot. (B) Comparison of SRSF6 protein levels by IHC between benign prostatic hyperplasia (BPH; n = 4) and PCa (n = 10) samples (left). Data are expressed as min-to-max boxplot, with median of nuclear SRSF6 H-score. ROC curve of SRSF6 protein levels to distinguish between BPH (n = 4) and PCa (n = 10) samples (center). AUC and P value are depicted in the plots. Representative images of BPH and PCa samples stained with SRSF6 antibody (right). (C) Comparison of SRSF6 protein levels between PCa (n = 3) and non-tumor prostate tissue (n = 3) samples from Hi-Myc mice (left). ROC curve of SRSF6 protein levels to distinguish between PCa (n = 3) and non-tumor prostate tissue (n = 3) from Hi-Myc mice (center). AUC and P value are depicted in the plots. Representative images of normal prostate epithelium and PCa samples from Hi-Myc mice stained with SRSF6 antibody (right). Asterisks (*P < 0.05) indicate statistically significant differences between groups.
Fig. 4.
Fig. 4.. Functional consequences in response to SRSF6 expression modulation in prostate-derived cell lines.
(A) Comparison of SRSF6 protein levels between a non-tumor prostate cell line (RWPE-1) and PCa cell lines LNCaP, 22Rv1, DU145, and PC-3 (n = 3). SRSF6 protein levels were determined by Western blot and adjusted by GAPDH. Data are represented as fold change of RWPE-1 cells (means ± SEM). Representative images of Western blot are depicted on the bottom panels. (B) Proliferation rate in response to SRSF6 overexpression in RWPE-1 and PC-3 cell lines (left), and in response to SRSF6 silencing in LNCaP, 22Rv1, DU145, and PC-3 cell lines (right) at 24, 48, and 72 hours determined by Resazurin assay. Data are represented as percentage to control cells (means ± SEM). (C) Number (left) and size (right) of colonies in response to SRSF6 siRNA in LNCaP (top left), 22Rv1 (top right), DU145 (bottom left), and PC-3 (bottom right). Images of representative wells are depicted. Data are represented as percentage to scramble cells (means ± SEM). (D) Number (left) and size (right) of tumorspheres in response to SRSF6 siRNA in LNCaP (left), 22Rv1 (center), and DU145 (right). Images of representative areas of wells are depicted. Data are represented as percentage to scramble cells (means ± SEM). (E) Migration rate in response to SRSF6 silencing after 16 hours of incubation in DU145 (left) and PC-3 (right) cell lines determined by wound-healing assay. Representative images are depicted. Data are represented as percentage to scramble cells (means ± SEM). Asterisks (*P < 0.05, **P < 0.01, and ***P < 0.001) indicate statistically significant differences between groups.
Fig. 5.
Fig. 5.. In vivo tumor growth in response to SRSF6 expression modulation.
(A and F) Schematic representation of the in vivo tumor growth experiment in response to SRSF6 overexpression (A) and silencing (F). (B to E) Comparison between the growth over time (B), weight at the end of experiment (representative images of tumors are depicted in bottom) (C), number of mitosis (D), and SRSF6 protein levels (E) of xenograft tumors derived from mock-transfected cells or SRSF6-overexpressing PC-3 cells. SRSF6 protein levels were determined by Western blot and adjusted by GAPDH. Representative images of Western blot are depicted on bottom panels. (G to J) Comparison between the growth over time (G), weight at the end of experiment (representative images of tumors are depicted in bottom) (H), number of mitosis (I), and SRSF6 protein levels (E) of xenograft tumors derived from 22Rv1 cells treated in vivo with scramble or SRSF6 siRNA. SRSF6 protein levels were determined by Western blot and adjusted by GAPDH. Representative images of Western blot are depicted on the bottom panels. Data are represented as means ± SEM. Asterisks (*P < 0.05, **P < 0.01, and ***P < 0.001) indicate statistically significant differences between groups.
Fig. 6.
Fig. 6.. Molecular consequences in response to the modulation of SRSF6 expression in PCa cells.
(A) Volcano plot showing differentially expressed genes (DEGs) in siSRSF6 versus scramble 22Rv1 cells. Top five significantly altered genes are depicted. Red dots represent statistically significant (P < 0.05), and black dots indicate nonsignificant DEGs. (B) Correlation between SRSF6 mRNA levels and SRSF6 activity in the SU2C cohort. (C and D) Volcano plot showing enriched hallmark gene sets defined by GSEA in 22Rv1 cells (siSRSF6 versus scramble) (C) and SU2C cohort (patients with low versus high SRSF6 activity) (D). TNFα, tumor necrosis factor–α; NF-κB, nuclear factor κB; IL-2, interleukin-2; STAT5, signal transducer and activator of transcription 5. (E and G) Correlation between SRSF6 activity and AR (AR-score; E) and E2F activity (E2F-score; G) in the SU2C cohort. (F and H) AR (F) and E2F (H) activity in response to silencing (siSRSF6 versus scramble) and overexpression (SRSF6 versus mock) of SRSF6 in 22Rv1 cells. (I and J) Venn diagram representing common AR and E2F protein interactors that are altered in response to SRSF6 silencing. (J) Expression profile by RNA-seq of AR and E2F-interactors in siSRSF6 versus scramble 22Rv1 cells. Data are represented as means ± SEM. Asterisks (*P < 0.05, **P < 0.01, and ***P < 0.001) indicate statistically significant differences between groups.
Fig. 7.
Fig. 7.. Splicing alteration in response to the modulation of SRSF6 expression in PCa cells.
(A) Venn diagram depicting common AR and E2F interactors whose splicing pattern has been altered in response to SRSF6 silencing (siSRSF6). (B) Effect of SRSF6 silencing on the splicing of HIRA pre-mRNA (top). Representation of HIRA splicing event [alternative first exon (AF)] altered in response to SRSF6 silencing (bottom). (C) HIRA protein levels in response to SRSF6 silencing in LNCaP and 22Rv1 cells. Representative images are depicted on the right panel. (D) Comparison of HIRA protein levels by IHC between BPH (n = 4) and PCa (n = 10) samples (left) and between PCa (n = 3) and non-tumor prostate tissue (n = 3) samples from Hi-Myc mice (right). Data are expressed as min-to-max boxplot, with median of HIRA H-score. Representative images of human and mouse samples stained with HIRA antibody are depicted. (E) Heatmap of the expression of H3.3-regulated genes determined by RNA-seq in response to SRSF6 silencing in 22Rv1 cells. (F) Significantly altered H3.3-activated and H3.3-repressed genes in response to SRSF6 silencing in 22Rv1 cells. (G to I) Expression levels by qPCR of dysregulated AR- (G), E2F- (H), and H3.3-regulated genes (I) in response to HIRA and SRSF6 silencing in LNCaP cells. Data are represented as means ± SEM. n.s., not significant. (J) Correlation between HIRA-203 percent spliced-in (PSI) with SRSF6 signature score in prostate adenocarcinoma (PRAD)–TCGA cohort. (K to M) Correlation between the expression of H3.3-regulated genes and the transcriptionally inferred activity of SRSF6 (K), AR (L), and E2F (M) in the TCGA (green colored) and SU2C (purple colored) cohorts. Asterisks (*P < 0.05, **P < 0.01, and ***P < 0.001) indicate statistically significant differences between groups.

References

    1. Sung H., Ferlay J., Siegel R. L., Laversanne M., Soerjomataram I., Jemal A., Bray F., Global cancer statistics 2020: GLOBOCAN estimates of incidence and mortality worldwide for 36 cancers in 185 countries. CA Cancer J. Clin. 71, 209–249 (2021). - PubMed
    1. Westaby D., Fenor de La Maza M. L. D., Paschalis A., Jimenez-Vacas J. M., Welti J., de Bono J., Sharp A., A new old target: Androgen receptor signaling and advanced prostate cancer. Annu. Rev. Pharmacol. Toxicol. 62, 131–153 (2022). - PubMed
    1. Watson P. A., Arora V. K., Sawyers C. L., Emerging mechanisms of resistance to androgen receptor inhibitors in prostate cancer. Nat. Rev. Cancer 15, 701–711 (2015). - PMC - PubMed
    1. Paschalis A., Sharp A., Welti J. C., Neeb A., Raj G. V., Luo J., Plymate S. R., de Bono J. S., Alternative splicing in prostate cancer. Nat. Rev. Clin. Oncol. 15, 663–675 (2018). - PubMed
    1. Jiménez-Vacas J. M., Herrero-Aguayo V., Montero-Hidalgo A. J., Gómez-Gómez E., Fuentes-Fayos A. C., León-González A. J., Sáez-Martínez P., Alors-Pérez E., Pedraza-Arévalo S., González-Serrano T., Reyes O., Martínez-López A., Sánchez-Sánchez R., Ventura S., Yubero-Serrano E. M., Requena-Tapia M. J., Castaño J. P., Gahete M. D., Luque R. M., Dysregulation of the splicing machinery is directly associated to aggressiveness of prostate cancer. EBioMedicine 51, 102547 (2020). - PMC - PubMed

MeSH terms