. 2024 Dec:111:107076.
doi: 10.1016/j.ultsonch.2024.107076. Epub 2024 Sep 20.

The impact of inorganic salts on the ultrasonic degradation of contaminants: A review

Affiliations

The impact of inorganic salts on the ultrasonic degradation of contaminants: A review

Haleigh A Fernandez et al. Ultrason Sonochem. 2024 Dec.

Abstract

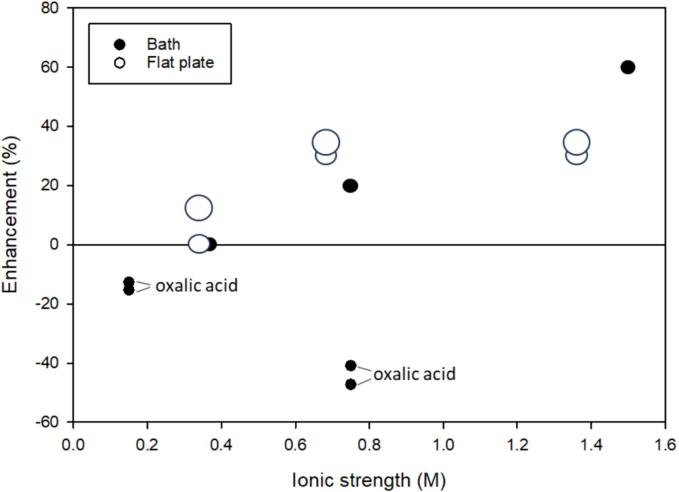
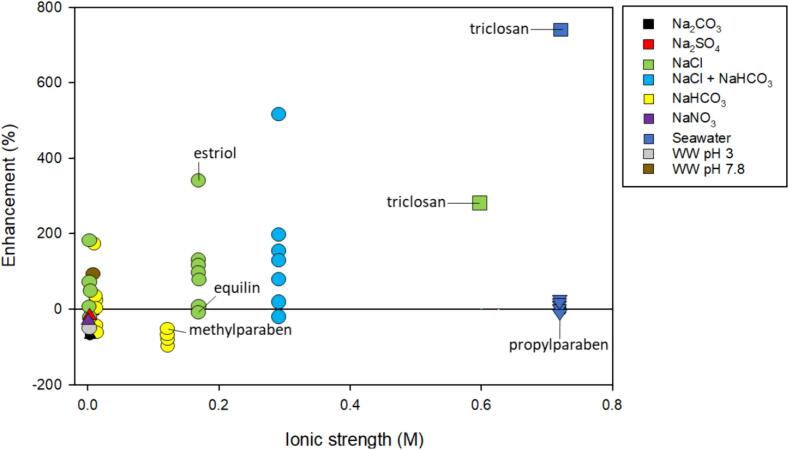
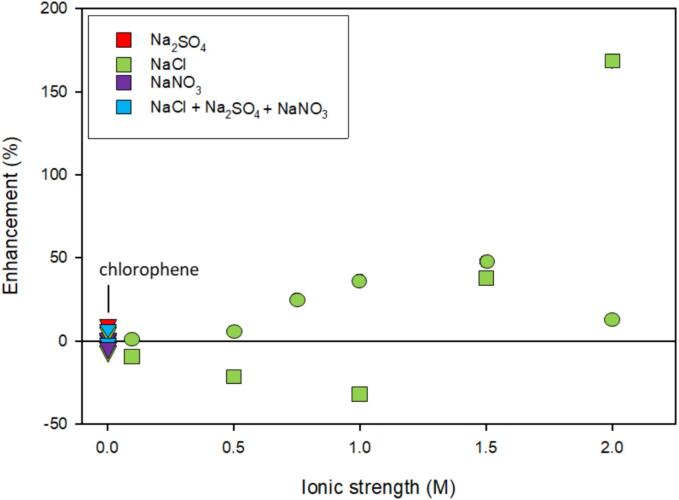
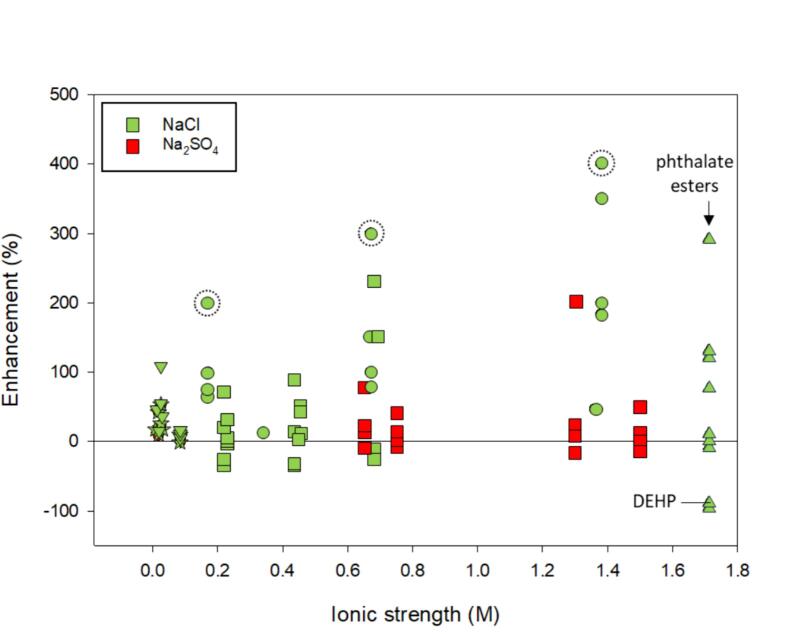
This comprehensive review explores the interplay between inorganic salts and ultrasound-assisted degradation of various contaminants. The addition of salt to aqueous matrices has been attributed to increasing contaminant degradation via the salting-out effect. However, research investigating the impact of salt on degradation has yielded inconsistent results. This review incorporated degradation information from 44 studies organizing data according to compound class and ionic strength to analyze the impact of inorganic salts on cavitation bubble dynamics, contaminant behavior, radical species generation, and contaminant degradation. Frequency and salt type were assessed for potential roles in contaminant degradation. The analysis showed that high intensity ultrasound was most beneficial to degradation in salt solutions. Unexpectedly, hydrophilic compounds showed marked enhancement with increasing ionic strength while many hydrophobic compounds did not benefit as greatly. Based on the collected data and analysis, enhanced degradation in the presence of salt appears to be primarily radical-mediated rather than due to the salting-out effect. Finally, the analysis provides guidance for designing sonolytic reactors for contaminant degradation.

Keywords: Inorganic salts; Mass transfer; Radical species; Salting-out effect; Sonochemical activity; Sonolytic reactors.


Conflict of interest statement

Declaration of competing interest The authors declare the following financial interests/personal relationships which may be considered as potential competing interests: Linda Weavers reports financial support was provided by Ohio Water Development Authority. Editorial Board for Ultrasonics Sonochemistry, LW If there are other authors, they declare that they have no known competing financial interests or personal relationships that could have appeared to influence the work reported in this paper.

Figures

Fig. 1
Fig. 1
Rhodamine B degradation shown as the reported degradation (%) or rate constant. Frequency: 300 kHz. Many overall degradation (%) data points are overlayed due to similar values. Literature included: , , .
Fig. 2
Fig. 2
The enhancement of NaCl and ultrasonic system type on organic acids using a 40 kHz ultrasonic bath or 590 kHz flat-plate transducer. The size of the symbol indicates the relative initial starting concentration of compound. As the size of the symbol increases, the initial starting concentration increases. Only data points for oxalic acid are labeled. The remaining data points are associated with acetic acid or formic acid. References included , , . Refer to Table 2 for a synopsis of each study.
Fig. 3
Fig. 3
The enhancement of ionic strength, inorganic salt type, and frequency on various dyes. The symbol shape indicates ranges of frequency: ● – 20 kHz; ▾ – 200–500 kHz; ▲ – 600–1000 kHz; ■ – 1700 kHz. The color of the symbol indicates salt type as indicated by the legend. An inset of an ionic strength up to 0.012 M is available in the SI. A few dyes discussed in the text are labeled. Not all data points associated with the compounds are labeled. Data associated with Rhodamine B excluded for clarity. Included references , , , , , , , . Refer to Table 2 for a synopsis of each study.
Fig. 4
Fig. 4
The enhancement of ionic strength, inorganic salt type, and neonicotinoid type on neonicotinoid degradation. Shape indicates specific neonicotinoid: ● – acetamiprid; ■ – imidacloprid; – thiacloprid; ▲ – thiamethoxam. The color of the symbol indicates salt type as indicated by the legend. Frequency: 578 kHz. Initial concentration: 1 uM. Included reference: . Refer to Table 2 for a synopsis of the study.
Fig. 5
Fig. 5
The enhancement of ionic strength, salt anion type, and frequency on the degradation of pharmaceuticals. The symbol of the marker indicates specific frequency: ● − 20 kHz; – 205 kHz; ★ – 350 kHz; ▲ – 375 kHz; ■ – 800 kHz. The color of the marker indicates salt type. Some data points associated with atenolol and sulfamethazine have been labeled. Included references: , , , , , . Refer to Table 2 for a synopsis of each study.
Fig. 6
Fig. 6
The enhancement of ionic strength, salt type, and frequency on the degradation of select endocrine disrupting chemicals including estrogen hormones, parabens, and triclosan. The shape of the symbol indicates specific frequency: ● – 20 kHz; ■ – 80 kHz; – 300 kHz; ▲ – 350 kHz. The symbol color indicates salt type as shown by the legend. Some data points associated with estriol, equilin, triclosan, and parabens have been labeled. Included references , , , , . Refer to Table 2 for a synopsis of each study.
Fig. 7
Fig. 7
The enhancement of ionic strength, salt type, and frequency on the degradation of pesticides, chlorophene and atrazine. The shape of the symbol indicates specific frequency: ■ – 20 kHz; ● – 400 kHz; – 620 kHz. The color of the symbol indicates salt type as indicated by the legend. Some data points associated chlorophene have been labeled. Included references: , . Refer to Table 2 for a synopsis of each study.
Fig. 8
Fig. 8
The enhancement of ionic strength, salt type, and frequency on the degradation of the surfactants, PFAS and sodium dodecylbenzene sulfonate (SDBS). Shape indicates specific frequency: ● – 40 kHz; ★ – 80 kHz; – 612 kHz; ▲– 700 kHz. The color of the marker indicates salt type as indicated by the legend. Labeled compounds: perfluorooctanoic acid (PFOA), perfluorooctane sulfonate (PFOS), perfluorobutanesulfonic acid (PFBS), perfluorodecanoic acid (PFDA). Studies included: , , , , . An inset up to an ionic strength 0.016 M is available in the SI. Refer to Table 2 for a synopsis of each study.
Fig. 9
Fig. 9
The enhancement of ionic strength, salt type, and frequency on the degradation of mixtures of polycyclic aromatic hydrocarbons (PAHs). The color of the marker indicates salt type as shown in the legend. Shape indicates specific frequency: ● – 35 kHz and ■ – 80 kHz. Included works: , , , . Refer to Table 2 for a synopsis of each study.
Fig. 10
Fig. 10
The enhancement of ionic strength, salt type, and frequency on semi-volatile compounds. The marker shape indicates specific frequency: ● – 20 kHz; ★ – 25 kHz; – 36 kHz; ▲ – 80 kHz; ■ – 200 kHz. The marker color indicates the salt type as indicated by the legend. The dashed circles indicate instances where the enhancement is distorted for 4-ethylphenol due to low initial degradation as discussed in the text. Literature included: , , , , , , . Refer to Table 2 for a synopsis of each study.
Fig. 11
Fig. 11
The overall degradation (%) of phenol and similar compounds in solutions containing inorganic salts. Marker shape indicates frequency as shown in the legend. Color indicates inorganic salt type: green – NaCl; red – Na2SO4. Rate constants not included. Excluding phthalate ester data. Included references: , , , . (For interpretation of the references to color in this figure legend, the reader is referred to the web version of this article.)
Fig. 12
Fig. 12
The enhancement of NaCl and frequency on the degradation of compounds with high Henry’s law constants. The color of the marker indicates specific frequency as indicated by the legend. The size of the symbol indicates the initial starting concentration of compound. As the symbol size increases, the starting initial concentration of compound also increases. A few datapoints associated with compounds discussed in the text are labeled. TCE is trichloroethylene. Included references: , , , . Refer to Table 2 for a synopsis of each study.

References

    1. Cao H., Zhang W., Wang C., Liang Y. Sonochemical degradation of poly- and perfluoroalkyl substances – a review. Ultrason. Sonochem. 2020;69 doi: 10.1016/J.ULTSONCH.2020.105245. - DOI - PubMed
    1. Xiao R., He Z., Diaz-Rivera D., Pee G.Y., Weavers L.K. Sonochemical degradation of ciprofloxacin and ibuprofen in the presence of matrix organic compounds. Ultrason. Sonochem. 2014;21:428–435. doi: 10.1016/j.ultsonch.2013.06.012. - DOI - PubMed
    1. Gupta P., Suresh S., Jha J.M., Banat F., Sillanpää M. Sonochemical degradation of polycyclic aromatic hydrocarbons: a review. Environ. Chem. Lett. 2021;19:2663–2687. doi: 10.1007/s10311-020-01157-9. - DOI
    1. Kidak R., Ince N.H. Ultrasonic destruction of phenol and substituted phenols: a review of current research. Ultrason. Sonochem. 2006;13:195–199. doi: 10.1016/j.ultsonch.2005.11.004. - DOI - PubMed
    1. Hamdaoui O., Merouani S. Ultrasonic destruction of acid orange 7: effect of humic acid, surfactants and complex matrices. Water Environ. Res. 2017;89:250–259. doi: 10.2175/106143016X14798353399539. - DOI - PubMed

LinkOut - more resources