. 2025 Jun 30;10(3):347-358.
doi: 10.1136/svn-2024-003525.

Extracellular vesicles bearing serum amyloid A1 exacerbate neuroinflammation after intracerebral haemorrhage

Affiliations

Extracellular vesicles bearing serum amyloid A1 exacerbate neuroinflammation after intracerebral haemorrhage

Huimin Zhu et al. Stroke Vasc Neurol. .

Abstract

Introduction: Intracerebral haemorrhage (ICH) elicits a robust inflammatory response, which significantly contributes to secondary brain damage. Extracellular vesicles (EVs) play a pivotal role in intercellular communication by transporting immune-regulatory proteins. However, the precise contribution of these EV-carried proteins to neuroinflammation following ICH remains elusive. Here, we identified proteins dysregulated in EVs and further studied the EVs-enriched Serum amyloid A 1 (SAA1) to understand its role in neuroinflammation and ICH injury.

Methods: We used mass spectrometry to analyse the EV protein cargo isolated from plasma samples of 30 ICH patients and 30 healthy controls. To validate the function of the dysregulated protein SAA1, an ICH mouse model was conducted to assess the effects of SAA1 neutralisation on brain oedema, neurological function and infiltration of peripheral leucocytes.

Results: 49 upregulated proteins and 12 downregulated proteins were observed in EVs from ICH patients compared with controls. Notably, SAA1 demonstrated a significant increase in EVs associated with ICH. We observed that exogenous SAA1 stimulation led to an augmentation in the population of microglia and astrocytes, exacerbating neuroinflammation. Neutralising SAA1 with an anti-SAA1 monoclonal antibody (mAb) diminished the prevalence of proinflammatory microglia and the infiltration of peripheral leucocytes, which ameliorates brain oedema and neurological function in ICH mice.

Conclusion: Our findings provide compelling evidence implicating EVs and their cargo proteins in ICH pathogenesis. SAA1 emerges as a potential therapeutic target for mitigating neuroinjury and neuroinflammation following ICH.

Keywords: Hemorrhage; Inflammation; Stroke.


Conflict of interest statement

Competing interests: None declared.

Figures

Figure 1
Figure 1. Extracellular vesicles (EVs) are increased in plasma of patients with intracerebral haemorrhage (ICH). (A) Transmission electron micrographs (TEM) image indicating EVs morphology and the size of the EVs. Scale bar=50 nm. (B) Nanoparticle tracking analysis (NTA) results depicting the dimensional distribution of isolated EVs. (C) Western blot analysis of EV-positive markers, including CD63 (cluster of differentiation 63) and TSG101 (tumour susceptibility gene 101). 293 T cells were used as a control. (D) Analysis of concentrations in ICH patients and in healthy controls (HC) using NTA, n=14 in HC and n=13 in ICH patients. *p<0.05 by the two-tailed unpaired Student’s t-test and data are presented as mean±SEM.
Figure 2
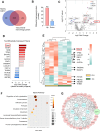
Figure 2. Proteomics profiling of extracellular vesicles isolated from plasma of ICH patients. (A, B) Mass spectrometry (MS) analysis of proteins in extracellular vesicles from 30 ICH patients and 30 healthy subjects. (A) Venn diagram depicting the number of the proteins that were differentially identified between the control and ICH groups. (B) Bar graph illustrating the significantly exchanged proteins as compared with the healthy subjects. p<0.05 and fold change>2. (C) Volcano plot displaying the differentially expressed proteins in ICH patients. Red dots represent significantly upregulated proteins, while blue dots indicate the significantly downregulated proteins as compared with the healthy subjects. The x-axis represents the fold change, and the y-axis shows the p value. (D) Bar graph representing the top altered proteins based on fold change. (E) Hierarchical heat map of extracellular vesicle proteomes, highlighting proteins with fold change >2 and p<0.05 in ICH patients as compared with controls. (F) Functional classification using Kyoto encyclopaedia of genes and genomes (KEGG) revealing the most typical pathway for upregulated proteins in ICH patients as compared with healthy controls. Circle size represents the number of proteins in each pathway and colour indicates p value. Gene ratio is shown on the x-axis. (G) Protein–protein interaction regulation network of significant proteins in the ICH group. Downregulated proteins are at the centre, while the upregulated proteins surround them. Circle size denotes the fold change and lines indicate relationships between proteins. ICH, intracerebral haemorrhage.
Figure 3
Figure 3. Human serum amyloid A1 (SAA1) protein levels in plasma and extracellular vesicles correlated (EVs) with clinical and laboratory assessments. (A, B) Bar graph indicating the concentration of SAA1 protein in both EVs and plasma for the ICH group and the healthy controls group. Unit: ng/mL in EVs and μg/mL in plasma. **p<0.01, ***p<0.001 by the two-tailed unpaired Student’s t-test and data are presented as means±SEM. (A) n=6, 15 in the control and ICH group, (B) n=13, 19 in the control and the ICH group. (C, D) Linear dependence graph revealing the relationship between neutrophils or leucocytes and the SAA1 protein in EVs (n=15). Correlation was analysed by spearman correlation analysis and the dashed line indicates the 95% CI. (E–H) Correlation analysis between the EVs-derived, plasma-derived SAA1 levels and the clinical assessments, including NIHSS and haemorrhage volume, through a linear dependence graph (n=15). Correlation was analysed by spearman correlation analysis and the dashed line indicates the 95% CI. ICH, intracerebral haemorrhage; NIHSS, National Institutes of Health Stroke Scale.
Figure 4
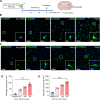
Figure 4. Exogenous SAA1 upregulates the cell counts of microglia and astrocytes. (A) Schematic representation of exogenous SAA1 inserting into the basal ganglia region at varying dosages (750 ng, 250 ng, 83 ng and 0 ng). Images of immunostaining of microglia and astrocyte activation on day three are provided. (B, D) Images of immunostaining (B) and quantification (D) of microglia (stained by a specific marker, Iba1) around the ipsilateral basal ganglia region at different doses of exogenous SAA1. Microglia counts per mm2: 9.3±2.2, 41.5±3.9, 64.0±4.0, 88.3±8.8 for 0 ng, 83 ng, 250 ng, and 750 ng, respectively. (C, E) Images of immunostaining of GFAP (glial fibrillar acidic protein, known as the astrocyte active marker) representing astrocytes (C) and quantification of astrocytes (E) at different doses of exogenous SAA1 in the ipsilateral basal ganglia region. Astrocyte counts per mm2: 36.0±3.8, 93.5±6.1, 134.0±3.5, 176.5±11.6 for 0 ng, 83 ng, 250 ng, and 750 ng, respectively. Scale bars=100 µm, inset scale bars=20 µm, n=4 in each group. ***p<0.001 by the Kruskal-Wallis test. Data are presented as means±SEM.
Figure 5
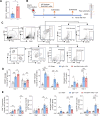
Figure 5. Blocking SAA1 promotes microglia reactivity and leucocyte infiltration. (A) Bar graph indicating the elevation of plasma SAA1 levels in ICH mice as compared with the sham group. n= 5 mice in the ICH group and n=10 mice in the sham group. **p<0.01 by two-tailed unpaired Student’s t-test. (B) Schematic diagram depicting intracerebral haemorrhage induction followed by intravenous administration of anti-SAA1 mAb or IgG 1 hour later. Immune cell populations were assessed using flow cytometry on days 1 and 3 post-ICH initiation. (C) Flow cytometry gating strategy depicting immune cell populations in mice brain treated with anti-SAA1 antibody or IgG on days 1 and day three post-ICH induction. The graph illustrates CD45high leucocytes, including CD3+CD19- T lymphocytes and its subtypes: CD4+CD8 T and CD4-CD8+ T lymphocytes, CD3CD19+ B lymphocytes, CD11b+Ly6G+ neutrophils, and CD11b+F4/80+ macrophages. It also illustrates CD45int CD11b+microglia, including its subtypes: CD86+ microglia and CD206+ microglia. All gates were set using fluorescence-minus-one (FMO) controls. (D) Bar graph indicates the number of microglia and their subtypes in ICH mice with anti-SAA1 antibody or IgG treatment from days 1 to 3. (E) Bar graph shows major brain infiltrated leucocytes, involving CD8+ T lymphocytes, B lymphocytes, and neutrophils in ICH mice with anti-SAA1 antibody or IgG treatment from days 1 to 3. Int, intermediate. n=5, 6, 5 on day 1 and n=5, 13, 10 on day 3 for sham, IgG and mAb group. n=5, 9, 7 on day 3 for CD86+ microglia group in sham, IgG and mAb group specially. *p<0.05, **p<0.01, ***p<0.001 by one-way ANOVA and Tukey’s test. Data are presented as means±SEM. ANOVA, analysis of variance; ICH, intracerebral haemorrhage.
Figure 6
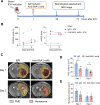
Figure 6. Anti-SAA1 mAb administration alleviates brain injury in mice with ICH. (A) Schematic diagram illustrating the ICH followed by intravenous injection of anti-SAA1 mAb or IgG 1 hour later. Subsequently, mice underwent MRI and neurological evaluations on days 1 and 3 after ICH induction. (B) Neurological scores of the sham group and the ICH group treated with anti-SAA1 mAb or IgG on day 1 and day 3. The modified Neurological Severity Score (mNSS) and rotarod test were used to measure the neurological deficit. n=6, 12, 7 for sham, IgG and mAb group. *p<0.05 by two-way ANOVA. (C) MRI of lesion volume (red) and perihaemorrhagic oedema (PHE) volume (yellow) on day 1 and day 3 post-ICH. (D, E) Quantification of lesion volume and PHE volume using the MRI. n=4, 6 for IgG and mAb group on day 1, n=5, 8 for IgG and mAb group on day 3. *p<0.05 by two-tailed unpaired Student’s t-test. Data are presented as means±SEM. ANOVA, analysis of variance; ICH, intracerebral haemorrhage.

References

    1. Sheth KN. Spontaneous Intracerebral Hemorrhage. N Engl J Med. 2022;387:1589–96. doi: 10.1056/NEJMra2201449. - DOI - PubMed
    1. Benjamin EJ, Muntner P, Alonso A, et al. Heart Disease and Stroke Statistics-2019 Update: A Report From the American Heart Association. Circulation. 2019;139:e56–528. doi: 10.1161/CIR.0000000000000659. - DOI - PubMed
    1. Hemphill JC, 3rd, Greenberg SM, Anderson CS, et al. Guidelines for the Management of Spontaneous Intracerebral Hemorrhage: A Guideline for Healthcare Professionals From the American Heart Association/American Stroke Association. Stroke. 2015;46:2032–60. doi: 10.1161/STR.0000000000000069. - DOI - PubMed
    1. Nickel W, Rabouille C. Mechanisms of regulated unconventional protein secretion. Nat Rev Mol Cell Biol. 2009;10:148–55. doi: 10.1038/nrm2617. - DOI - PubMed
    1. Lai C-K, Breakefield XO. Role of exosomes/microvesicles in the nervous system and use in emerging therapies. Front Physiol. 2012;3:228. doi: 10.3389/fphys.2012.00228. - DOI - PMC - PubMed

MeSH terms

LinkOut - more resources