. 2025 Jan 17;74(2):229-245.
doi: 10.1136/gutjnl-2024-332602.

Multiomics of the intestine-liver-adipose axis in multiple studies unveils a consistent link of the gut microbiota and the antiviral response with systemic glucose metabolism

Affiliations

Multiomics of the intestine-liver-adipose axis in multiple studies unveils a consistent link of the gut microbiota and the antiviral response with systemic glucose metabolism

Anna Castells-Nobau et al. Gut. .

Abstract

Background: The microbiota is emerging as a key factor in the predisposition to insulin resistance and obesity.

Objective: To understand the interplay among gut microbiota and insulin sensitivity in multiple tissues.

Design: Integrative multiomics and multitissue approach across six studies, combining euglycaemic clamp measurements (used in four of the six studies) with other measurements of glucose metabolism and insulin resistance (glycated haemoglobin (HbA1c) and fasting glucose).

Results: Several genera and species from the Proteobacteria phylum were consistently negatively associated with insulin sensitivity in four studies (ADIPOINST, n=15; IRONMET, n=121, FLORINASH, n=67 and FLOROMIDIA, n=24). Transcriptomic analysis of the jejunum, ileum and colon revealed T cell-related signatures positively linked to insulin sensitivity. Proteobacteria in the ileum and colon were positively associated with HbA1c but negatively with the number of T cells. Jejunal deoxycholic acid was negatively associated with insulin sensitivity. Transcriptomics of subcutaneous adipose tissue (ADIPOMIT, n=740) and visceral adipose tissue (VAT) (ADIPOINST, n=29) revealed T cell-related signatures linked to HbA1c and insulin sensitivity, respectively. VAT Proteobacteria were negatively associated with insulin sensitivity. Multiomics and multitissue integration in the ADIPOINST and FLORINASH studies linked faecal Proteobacteria with jejunal and liver deoxycholic acid, as well as jejunal, VAT and liver transcriptomic signatures involved in the actin cytoskeleton, insulin and T cell signalling. Fasting glucose was consistently linked to interferon-induced genes and antiviral responses in the intestine and VAT. Studies in Drosophila melanogaster validated these human insulin sensitivity-associated changes.

Conclusion: These data provide comprehensive insights into the microbiome-gut-adipose-liver axis and its impact on systemic insulin action, suggesting potential therapeutic targets.Cite Now.

Keywords: INTESTINAL BACTERIA; LIVER; OBESITY.


Conflict of interest statement

Competing interests: None declared.

Figures

Figure 1
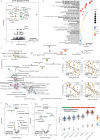
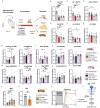
Figure 1. Associations of the faecal microbiota composition and functionality with the hyperinsulinaemic-euglycaemic clamp across studies. (A–F) Volcano plots of differential microbial (a-c) genera and (d-f) species associated with insulin sensitivity (hyperinsulinaemic-euglycaemic clamp) in the ADIPOINST (n=15), IRONMET (n=121) and FLORINASH (n=67) studies, respectively; identified using the analysis of microbiomes with bias correction compared. The log2 (Fold Change) and the −log10 (p values) adjusted for multiple testing are plotted for each taxon. Significantly different taxa are coloured according to phylum. (g–i) Dot plots of the KEGG pathway over-representation analyses (q value <0.1) mapping the KEGG orthologues significantly associated with insulin sensitivity in the ADIPOINST, IRONMET and FLORINASH studies, respectively. Dots are coloured according to the q value. KEGG, Kyoto Encyclopaedia of Genes and Genomes.
Figure 2
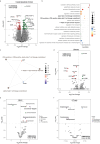
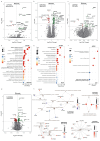
Figure 2. Cross-cohort and cross-omics associations in the small intestine with insulin sensitivity and resistance. (a) Volcano plot of differentially expressed genes associated with insulin sensitivity (hyperinsulinaemic-euglycaemic clamp) in the jejunum of patients from the ADIPOINST cohort (n=26) identified by limma-voom analysis controlling for age, sex and BMI. The log2 fold change associated with a unit change in the clamp and the log10 p values adjusted for multiple testing are plotted for each gene. (b) Dot plot of pathways significantly associated (q value <0.1) with insulin sensitivity in the jejunum identified from a pathway over-representation analysis mapping significantly upregulated genes to the Reactome, Kyoto Encyclopaedia of Genes and Genomes, Wikipathways, PID and NetPpath databases. Dots are coloured by the q value. (c) Over-representation analysis results were mapped as a function network of pathways using an enrichment map. Edges connect overlapping gene sets, while node size reflects the total number of genes in each pathway. Overlapping gene sets tend to cluster together, making it easy to identify functional modules. Functionally related pathways are clustered based on the Markov Cluster Algorithm and coloured with the same colour. (d–g) Scatter plot of the partial Spearman’s rank correlations (adjusted for age, sex and BMI) between the fasting glucose or HbA1c levels and the number of T cells or the percentage of T cells in the ileum of patients from the SIMMUNIDIA cohort (n=43). The ranked residuals are plotted. (h) Volcano plots of differential microbial genera associated with HbA1c and (i) the number (#) of T cells in the ileum of the SIMMUNDIA cohort (n=42) identified using ANCOM-BC controlling for age, sex and BMI. The log2 (Fold Change) and the −log10 (p values) adjusted for multiple testing are plotted for each taxon. Significantly different taxa are coloured according to phylum. (j) Boxplots of the normalised variable importance measure for the metabolites/lipids associated with insulin sensitivity in the jejunum of the ADIPOINST cohort. The red dot represents the mean and the colour bar above each plot indicates the sign of the association between the metabolites/lipids and insulin sensitivity, with red indicating negative correlation and green positive correlation. Significant metabolites were identified using the Boruta algorithm with 5000 trees and 500 iterations. ANCOM-BC, analysis of microbiomes with bias correction; BMI, body mass index; HbA1c, glycated haemoglobin.
Figure 3
Figure 3. Cross-cohort and cross-omics associations in the colon with insulin sensitivity and resistance. (a) Volcano plot of differentially expressed genes associated with insulin sensitivity (hyperinsulinaemic-euglycaemic clamp) in the colon of patients from the FLOROMIDIA cohort (n=22), identified by limma-voom analysis controlling for age, sex and BMI. The log2 fold change associated with a unit change in the clamp and the log10 p values adjusted for multiple testing are plotted for each gene. (b) Dot plot of gene ontology-biological processes significantly associated (q value <0.1) with insulin sensitivity in the colon identified from a gene ontology over-representation analysis using significant genes associated with insulin sensitivity. Dots are coloured by the q value. (c) Gene-concept network depicting the linkage of significant genes associated with insulin sensitivity participating in Th17 immune response and CD4+ or CD8+, alpha-beta T cell lineage commitment. (d) Volcano plot of differentially expressed genes associated with the fasting glucose levels in the colon of patients from the SIMMUNIDIA cohort (n=22), identified by limma-voom analysis controlling for age, sex and BMI. The log2 fold change and the log10 p values adjusted for multiple testing are plotted for each gene. (e) Volcano plots of differential microbial genera associated with HbA1c and (F) the number (#) of T cells in the colon of the SIMMUNDIA cohort (n=55) identified using ANCOM-BC controlling for age, sex and BMI. The log2 (Fold Change) and the –log10 (p values) adjusted for multiple testing are plotted for each taxon. Significantly different taxa are coloured according to phylum. ANCOM-BC, analysis of microbiomes with bias correction; BMI. body mass index; HbA1c, glycated haemoglobin.
Figure 4
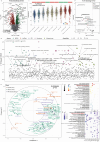
Figure 4. SAT transcriptomic signatures associated with HbA1c. (a) Volcano plot of differentially expressed genes associated with HbA1c in the SAT of patients from the ADIPOMIT cohort (n=740), identified by limma-voom analysis controlling for age, sex and BMI. The log2 fold change and the log10 p values adjusted for multiple testing are plotted for each gene. (b) Manhattan-like plot of pathways significantly associated (q value <0.1) with insulin sensitivity in the jejunum identified from a pathway over-representation analysis mapping significantly downregulated genes and (c) significantly upregulated genes to the Reactome, Kyoto Encyclopaedia of Genes and Genomes, Wikipathways, PID and NetPath databases. HbA1C, glycosylated haemoglobin; SAT, subcutaneous adipose tissue.
Figure 5
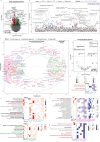
Figure 5. VAT transcriptomic signatures associated with insulin sensitivity and cross-omics and cross-tissue integration in the ADIPOINST cohort. (a) Volcano plot of differentially expressed genes associated with insulin sensitivity (hyperinsulinaemic-euglycaemic clamp) in the VAT of patients from the ADIPOINST cohort (n=29) identified by limma-voom analysis controlling for age, sex and BMI. The log2 fold change associated with a unit change in the clamp and the log10 p values adjusted for multiple testing are plotted for each gene. (b) Manhattan-like pathways significantly associated (q value <0.1) with insulin sensitivity in the VAT identified from a pathway over-representation analysis mapping significantly downregulated genes to the Reactome, Kyoto Encyclopaedia of Genes and Genomes, Wikipathways, PID and NetPath databases. (c) Correlation circle plot for the integration of the jejunum and VAT genes, jejunum metabolites and faecal microbial species associated with insulin sensitivity in the ADIPOINST cohort using a multiblock sparse PLS model. Strongly positively associated variables or groups of variables are projected close to one another on the correlation circle (~0° angle). The variables or groups of variables strongly negatively associated are projected diametrically opposite (~180° angle) on the correlation circle. Variables not correlated are situated ~90° from one another. (d) Dot plot of significantly enriched (q value <0.1) gene ontology-biological processes and (e) pathways from jejunal genes strongly positively associated with insulin sensitivity included in cluster 2 with a heatmap displaying the gene participating in each biological term. Dots are coloured by the q value and genes in the heatmap are coloured by the log2 Fold Change of the association with insulin sensitivity. (f) Dot plot of significantly enriched (q value <0.1) gene ontology-biological processes and (g) pathways from VAT and (h) jejunal genes strongly negatively associated with insulin sensitivity included in cluster 1 with a heatmap displaying the gene participating in each biological term. Dots are coloured by the q value and genes in the heatmap are coloured by the log2 Fold Change of the association with insulin sensitivity. (i) Volcano plots of differential microbial genera associated with insulin sensitivity in the VAT of the IRONMET (n=12) identified using ANCOM-BC controlling for age, sex and BMI. The log2 (Fold Change) and the –log10 (p values) adjusted for multiple testing are plotted for each taxon. Significantly different taxa are coloured according to phylum. ANCOM-BC, analysis of microbiomes with bias correction; BMI, body mass index; VAT, visceral adipose tissue
Figure 6
Figure 6. Liver transcriptomic signatures associated with insulin sensitivity and cross-omics and cross-tissue integration in the FLORINASH cohort. (a) Volcano plot of differentially expressed genes associated with insulin sensitivity (hyperinsulinaemic-euglycaemic clamp) in the liver of patients from the FLORINASH cohort (n=80) identified by limma-voom analysis controlling for age, sex and BMI. The log2 fold change associated with a unit change in the clamp and the log10 p values adjusted for multiple testing are plotted for each gene. (b) Manhattan-like plot of pathways significantly associated (q value <0.1) with insulin sensitivity in the liver identified from a pathway over-representation analysis mapping significant genes to the Reactome, KEGG, Wikipathways, PID and NetPpath databases. (c) Boxplots of the normalised variable importance measure for the lipids associated with insulin sensitivity in the liver of the FLORINASH cohort (n=41). The bar above each plot indicates the sign of the association between the lipids and insulin sensitivity, with red indicating a negative correlation and green a positive correlation. Significant metabolites were identified using the Boruta algorithm with 5000 trees and 500 iterations. (d) Volcano plots of differential microbial genera associated with insulin sensitivity (clamp) in the liver of a subset of patients from Spain of the FLORINASH cohort (n=17) identified using ANCOM-BC controlling for age, sex and BMI. The log2 (Fold Change) and the −log10 (p values) adjusted for multiple testing are plotted for each taxon. Significantly different taxa are coloured according to phylum. (e) Correlation circle plot for the integration of the liver lipids, liver genes and faecal microbial species associated with insulin sensitivity in the FLORINASH cohort using a multiblock sparse partial least squares model. Strongly positively associated variables or groups of variables are projected close to one another on the correlation circle (~0° angle). The variables or groups of variables strongly negatively associated are projected diametrically opposite (~180° angle) on the correlation circle. Variables not correlated are situated ~90° from one another. (f) Dot plot of significantly enriched (q value <0.1) pathways (based on Reactome, KEGG, Wikipathways, PID and NetPath) and (g) heatmap of genes participating in these pathways, identified from liver genes strongly negatively associated with insulin sensitivity from the transcriptome signature clustering with Proteobacteria and deoxycholic acid and negatively associated with insulin sensitivity. Dots are coloured by the q value and genes in the heatmap are coloured by the log2 Fold Change of the association with insulin sensitivity. KEGG, Kyoto Encyclopaedia of Genes and Genomes.
Figure 7
Figure 7. Enterobacter cloacae mono-association and HFD supplementation produce transcriptional changes in orthologues of insulin sensitivity-associated genes in the Drosophila intestine and fat body. (a) An experimental scheme was followed to generate Drosophila wild-type flies under sterile (germ-free) or monocolonisation conditions. Sterile flies can be easily generated by egg sterilisation. Subsequently, mono-associations were established by fly food supplementation with E. cloacae or the vehicle (sterile flies). On the 10th day of adulthood, dissections were conducted. 25–30 fly intestines or fat bodies were collected per sample. For complete flies, eight adults were collected per sample. Quantitative reverse transcription-PCR results; bars represent relative gene expression of b) hig, c) Rac1, (d) Cyflip, (e) Deaf, (f) drk, (g) Zir, (h) Col4a1, (i) Moe, (j) siz, (k) Past1, (l) cta, (m) ssh, (n) vib, (o) Ac76E, (p) Dsor1, (q) mys, (r) dlip2 and (s) Hpd in flies fed with SD and HFD non-colonised with E. cloacae or left sterile for the. P values were determined using the one-way analysis of variance combined with Fisher’s (least significant difference) multiple comparisons test when unequal variances Kruskal-Wallis non-parametric test with multiple comparisons was conducted. (t) Larval haemolymph glucose clearance after glucose feeding at 0, 10, 20, 30 and 90 min. Statistical significance at each time point was tested using an unpaired, two-sided t-test. n=3 independent replicates pulling eight larvae each. Error bars represent SE of the mean (#p<0.1, *p<0.05, *p<0.01 and *p<0.001). (u) Schematic representation of FOXO activation through insulin signalling in Drosophila. HFD, high-fat diet; SD, standard diet
Figure 8
Figure 8. Cross-cohort and cross-tissue transcriptomic associations with fasting glucose levels. Volcano plot of differentially expressed genes associated with the fasting glucose levels in the (a) jejunum, (b) ileum, (c) VAT and (g) colon from the ADIPOINST (n=26), SIMMUNIDIA (n=16), ADIPOINST (n=29) and FLOROMIDIA (n=37) studies, respectively. The log2 fold change associated with a unit change in the fasting glucose levels and the log10 p values adjusted for multiple testing are plotted for each gene. (d–f) Dot plot of gene ontology biological processes (d,e) and Kyoto Encyclopaedia of Genes and Genomes pathways (F) significantly associated (q value <0.1) with the fasting glucose levels in the jejunum, ileum and VAT, respectively. (h) Gene-concept network depicting the linkage of significant genes associated with fasting glucose levels participating in pathways involved in the antiviral response in the jejunum, ileum, VAT and colon. VAT, visceral adipose tissue.
Figure 9
Figure 9. Functional analysis based on KEGG modules. Dot plots of the KEGG module-based pathway over-representation analyses (q value <0.1) mapping the KEGG orthologues molecular function significantly associated with insulin sensitivity in the (A) ADIPOINST, (B) IRONMET and (C) FLORINASH studies, respectively. Dots are coloured according to the q value. KEGG, Kyoto Encyclopaedia of Genes and Genomes.

References

    1. Canfora EE, Meex RCR, Venema K, et al. Gut microbial metabolites in obesity, NAFLD and T2DM. Nat Rev Endocrinol. 2019;15:261–73. doi: 10.1038/s41574-019-0156-z. - DOI - PubMed
    1. Fan Y, Pedersen O. Gut microbiota in human metabolic health and disease. Nat Rev Microbiol. 2021;19:55–71. doi: 10.1038/s41579-020-0433-9. - DOI - PubMed
    1. Cani PD, Amar J, Iglesias MA, et al. Metabolic endotoxemia initiates obesity and insulin resistance. Diabetes. 2007;56:1761–72. doi: 10.2337/db06-1491. - DOI - PubMed
    1. Cani PD, Bibiloni R, Knauf C, et al. Changes in gut microbiota control metabolic endotoxemia-induced inflammation in high-fat diet-induced obesity and diabetes in mice. Diabetes. 2008;57:1470–81. doi: 10.2337/db07-1403. - DOI - PubMed
    1. Konrad D, Wueest S. The gut-adipose-liver axis in the metabolic syndrome. Physiology (Bethesda) 2014;29:304–13. doi: 10.1152/physiol.00014.2014. - DOI - PubMed

LinkOut - more resources