. 2024 Oct 2;15(1):8499.
doi: 10.1038/s41467-024-52633-7.

Aquatic environment drives the emergence of cell wall-deficient dormant forms in Listeria

Affiliations

Aquatic environment drives the emergence of cell wall-deficient dormant forms in Listeria

Filipe Carvalho et al. Nat Commun. .

Abstract

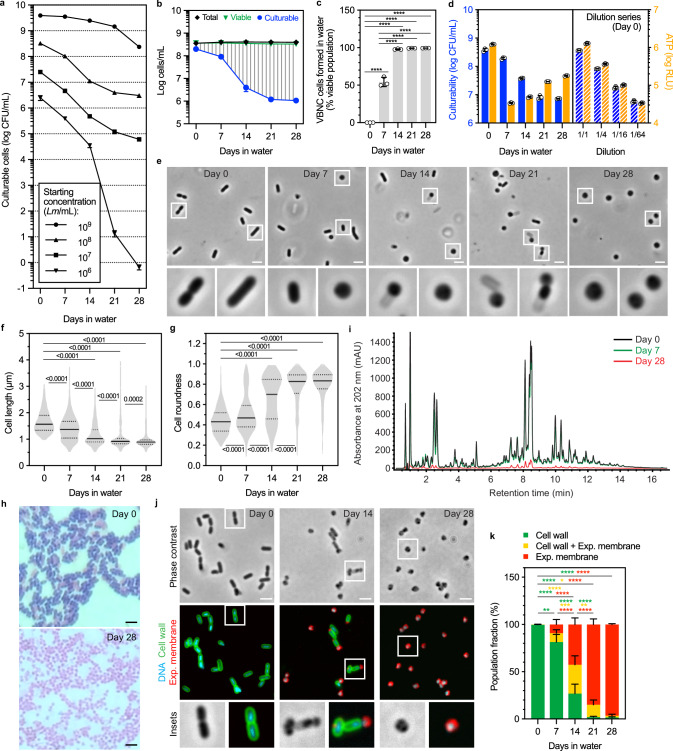
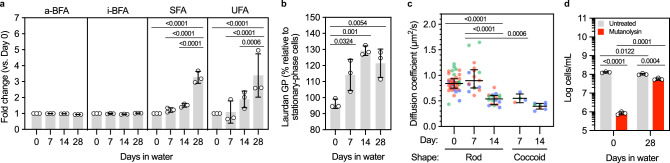
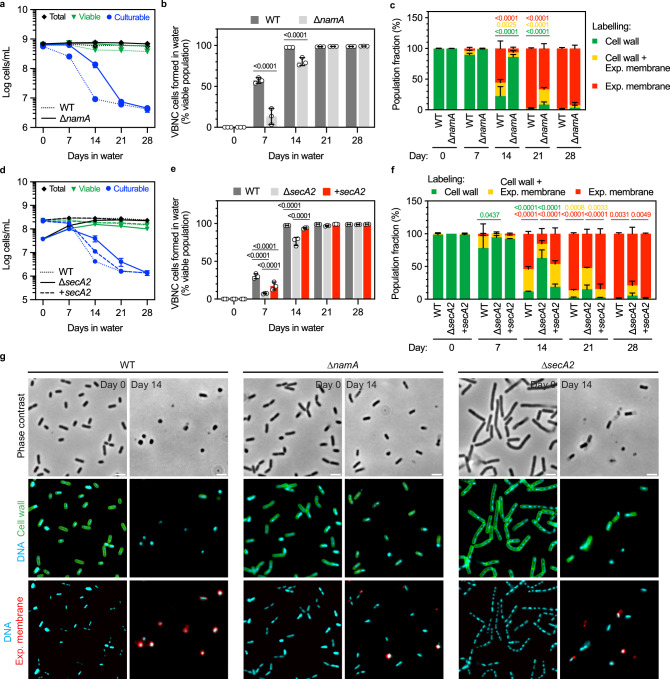
Stressed bacteria can enter a dormant viable but non-culturable (VBNC) state. VBNC pathogens pose an increased health risk as they are undetectable by growth-based techniques and can wake up back into a virulent state. Although widespread in bacteria, the mechanisms governing this phenotypic switch remain elusive. Here, we investigate the VBNC state transition in the human pathogen Listeria monocytogenes. We show that bacteria starved in mineral water become VBNC by converting into osmotically stable cell wall-deficient coccoid forms, a phenomenon that occurs in other Listeria species. We reveal the bacterial stress response regulator SigB and the autolysin NamA as major actors of VBNC state transition. We lastly show that VBNC Listeria revert to a walled and virulent state after passage in chicken embryos. Our study provides more detail on the VBNC state transition mechanisms, revealing wall-free bacteria naturally arising in aquatic environments as a potential survival strategy in hypoosmotic and oligotrophic conditions.


Conflict of interest statement

The authors declare no competing interests.

Figures

Fig. 1
Fig. 1. Lm transitions into a CWD VBNC state during incubation in mineral water.
a Culturability of Lm EGDe in mineral water with different starting bacterial concentrations. Culturable bacteria were quantified by colony-forming unit (CFU) enumeration. b Total, viable, and culturable cell numbers of Lm EGDe in mineral water. Culturable bacteria (blue circles) were quantified as in a; total (black diamonds) and viable (green triangles) bacteria were quantified by flow cytometry using CFDA. Dashed area indicates VBNC population. c Fraction of the viable population shown in b consisting of VBNC cells formed in mineral water. d Culturability vs. ATP content of Lm EGDe in mineral water. Culturable bacteria (blue bars) were quantified as in a; ATP (orange bars) was quantified with a luciferase-based assay. Dashed bar graph shows results for a dilution series of Lm EGDe in mineral water (day 0) as a reference for the ATP levels expected from a defined number of culturable cells. e Phase-contrast micrographs of Lm EGDe in mineral water. Bacteria highlighted in white squares are shown enlarged in bottom panels. f, g Cell length and roundness of Lm EGDe in mineral water. h Brightfield micrographs of Gram-stained Lm EGDe sampled from mineral water. i Peptidoglycan muropeptide profiles of Lm EGDe sampled from mineral water at indicated time points. j Phase-contrast and fluorescence micrographs of Lm EGDe fluorescently labeled for DNA (cyan), cell wall (green), and exposed plasma membrane (red). Bacteria highlighted in white squares are shown enlarged in bottom panels. k Fraction of the Lm EGDe population showing single- or double-labeling of cell wall and exposed plasma membrane by fluorescence microscopy. Data are expressed as mean ± standard deviation (ad, k) or median + interquartile range (f, g) of three independently prepared bacterial suspensions, or are representative of two independently prepared suspensions (h, i). Statistical significance was determined with one-way ANOVA with Tukey’s test (c), Kruskal-Wallis test with Dunn’s post hoc test (f, g), or two-way ANOVA with Tukey’s test (k). *p ≤ 0.05; **p ≤ 0.01; ***p ≤ 0.001; ****p ≤ 0.0001. Scale bars: 2 µm. Source data are provided as a Source Data file.
Fig. 2
Fig. 2. Cryo-electron tomography of the Lm CW shedding during VBNC state transition.
Ultrastructure of the stages of Lm CW shedding obtained by cryo-electron tomography of Lm EGDe sampled from mineral water at day 0 (stage 0) and day 14 (stages 1–5). Stage 0: a rod-shaped bacterium with tightly connected plasma membrane (M) and CW layers (white arrowheads). In this example, a septum is forming at the midcell region. Stage 1: detachment of the M and CW layers results in the formation of a periplasm-like space (red arrowheads). Stage 2: appearance of CW breaches of variable size (yellow arrowheads) exposes the enclosed protoplast to the extracellular environment. Stage 3: the protoplast begins bulging through a CW breach at one of the poles. Stage 4: the protoplast squeezes out, leaving behind an empty cell wall sacculus. Stage 5: the protoplast has fully egressed from its rod-shaped CW encasing, assuming a coccoid morphology as a CWD form. Left panels: tomogram slice; right panels: 3D rendering of the CW (blue) and M (orange) layers, obtained by manual segmentation of tomogram slices; middle panels: superposition of the tomogram slice and the 3D models. Scale bars: 200 nm. Movies showing all the tomogram slices used for 3D reconstruction of the CW and M layers for stages 0 and 2–5 are available as Supplementary Movies S1–S5.
Fig. 3
Fig. 3. A CWD VBNC state occurs in other Listeria species.
ae Total, viable and culturable cell numbers of Listeria sensu stricto species L. ivanovii, L. innocua, L. marthii, L. seeligeri, and L. welshimeri in mineral water. Culturable bacteria (blue circles) were quantified by CFU enumeration; total (black diamonds) and viable (green triangles) bacteria were quantified by flow cytometry using CFDA. Dashed area indicates VBNC population. fj Fraction of the viable cell populations shown in ae consisting of VBNC cells formed in mineral water. kt Fraction of the cell populations shown in ae displaying cell wall (ko) or exposed plasma membrane (pt) labeling by fluorescence microscopy. u Phase-contrast and fluorescence micrographs of the cell populations quantified in kt. Bacteria were fluorescently labeled for DNA (cyan), cell wall (green), and exposed plasma membrane (red). Data are expressed as mean ± standard deviation of three independently prepared bacterial suspensions (white circles in bar plots). Scale bars: 2 µm. Source data are provided as a Source Data file.
Fig. 4
Fig. 4. Lm adapts its membrane properties to a CWD lifestyle.
a Fold change of the relative abundance of anteiso-branched (a-BFA), iso-branched (i-BFA), saturated (SFA) and unsaturated (UFA) fatty acids extracted from Lm EGDe in mineral water at the indicated timepoints relative to the first timepoint (day 0). Fold change calculated from data in Supplementary Fig. 5. b Laurdan generalized polarization (GP) of Lm EGDe in mineral water. Increasing relative GP values suggest reduction of the bacterial membrane fluidity. c Membrane fluidity of Lm EGDe in mineral water. Nile red-stained rod-shaped or coccoid cells were analyzed by total internal reflection fluorescence correlation spectroscopy (TIR-FCS) to determine the membrane-associated dye diffusion coefficient. Each dot represents one measured bacterium, and dots with same color represent bacteria measured from the same suspension. d Total cell numbers of Lm EGDe in mineral water were quantified by flow cytometry in samples treated (red) or not (gray) with mutanolysin. Data are expressed as mean ± standard deviation (a, b, d) or median + interquartile range (c) of three independently prepared bacterial suspensions (white circles in bar plots, differentially colored dots in scatter plot). Statistical significance was determined with two-way ANOVA with Tukey’s (a) or Šidák’s test (d), and one-way ANOVA with Dunnett’s (b) or Tukey’s (c) tests. Source data are provided as a Source Data file.
Fig. 5
Fig. 5. Transcriptional reprogramming in the early phase of VBNC Lm formation.
a Gene expression changes in Lm EGDe between 0 and 7 days post-incubation in mineral water. The volcano plot depicts the magnitude (log2 fold change) and statistical significance (q-value) of the change in transcriptional levels of the Lm EGDe genome (n = 2864 genes, black dots). Horizontal dashed lines indicate fold change threshold ( | log2 fold change | = 1), vertical dashed line indicates statistical significance threshold (q-value = 0.05). Red-shaded area indicates significantly upregulated genes (n = 636), blue-shaded area indicates significantly downregulated genes (n = 593). b, c Functional analysis of statistically enriched gene ontology biological process (GOBP) terms in genes downregulated (b) and upregulated (c) at 7 days. GOBP terms ranked (left to right) by increasing p-value and decreasing fraction of downregulated/upregulated genes per term. Statistical significance was determined with a Benjamini-Hochberg-corrected hypergeometric cumulative probability test (b, c). Source data are provided as a Source Data file.
Fig. 6
Fig. 6. SigB and stress response mechanisms modulate the onset of VBNC Lm formation.
a, eg Total, viable and culturable cell numbers of wild-type Lm (WT, dotted line), SigB-deficient (∆sigB) and RelAPQ-deficient (∆relAPQ) mutants (solid lines), and complemented ∆relAPQ strains expressing relA (∆relAPQ+relA), relP (∆relAPQ+relP) or relQ (∆relAPQ+relQ) (dashed lines), in mineral water. Culturable bacteria (blue circles) were quantified by CFU enumeration; total (black diamonds) and viable (green triangles) bacteria quantified by flow cytometry using CFDA. b, h Fraction of the viable cell populations shown in a, eg consisting of VBNC cells formed in mineral water. c, i Fraction of the cell populations shown in a, eg displaying single- or double-labeling of cell wall and exposed plasma membrane by fluorescence microscopy. d Phase-contrast and fluorescence micrographs of the cell populations quantified in c. Bacteria were fluorescently labeled for DNA (cyan), cell wall (green) and exposed plasma membrane (red). Data are expressed as mean ± standard deviation of three independently prepared bacterial suspensions (white circles in bar plots). Statistical significance was determined with two-way ANOVA with Šidák’s (b, f, i) or Tukey’s (h) tests. Scale bars: 2 µm. Source data are provided as a Source Data file.
Fig. 7
Fig. 7. The autolysin NamA promotes Lm CW shedding and VBNC state entry.
a, d Total, viable and culturable cell numbers of wild-type Lm EGDe (WT, dotted lines), isogenic NamA-deficient (∆namA) and SecA2-deficient (∆secA2) mutants (solid lines), and complemented ∆secA2 (+secA2) strain (dashed line) in mineral water. Culturable bacteria (blue circles) were quantified by CFU enumeration; total (black diamonds) and viable (green triangles) bacteria quantified by flow cytometry using CFDA. b, e Fraction of the viable cell populations shown in a, d consisting of VBNC cells formed in mineral water. c, f Fraction of the cell populations shown in a, d displaying single- or double-labeling of cell wall and exposed plasma membrane by fluorescence microscopy. g Phase-contrast and fluorescence micrographs of the cell populations quantified in c, f. Bacteria were fluorescently labeled for DNA (cyan), cell wall (green), and exposed plasma membrane (red). Data are expressed as mean ± standard deviation of three independently prepared bacterial suspensions (white circles in bar plots). Statistical significance was determined with two-way ANOVA with Šidák’s (b, c, f) or Tukey’s (e) tests. Scale bars: 2 µm. Source data are provided as a Source Data file.
Fig. 8
Fig. 8. Chicken embryo passage restores culturability and virulence to VBNC Lm.
a Phase-contrast and fluorescence micrographs of GFP-expressing Lm EGDe before (WT) and after VBNC state entry in mineral water and passage through embryonated chicken eggs (clones V-E1 and VC-E2). Bacteria were fluorescently labeled for DNA (cyan) and cell wall (green). b Intracellular replication of WT (black circles and line), V-E1 (red down-pointed triangles and line) and VC-E2 (green up-pointed triangles and line) in human epithelial JEG-3 and HepG2 cell lines. Intracellular viable bacteria were quantified by CFU enumeration from agar medium-plated cell lysates. c Low-magnification fluorescence micrographs of JEG-3 cell monolayers infected with WT, VE-1 or VC-E2, showing cell-to-cell spread of intracellular bacteria between 6 h (isolated clusters of infected cells) and 72 h post-infection (generalized infection of the cell monolayer). Cells were fluorescently labeled for Lm (green) and F-actin (red). Bacteria-associated fluorescence signal was digitally enhanced for clarity. d Fluorescence micrographs showing WT, VE-1 and VC-E2 in the cytoplasm of infected JEG-3 cells at 6 h post-infection. Cytosolic Lm polymerize host actin into comet-like tail structures that promote intracellular motility and subsequent intercellular spread. Cells were fluorescently labeled for DNA (cyan), Lm (green) and F-actin (red). Bacteria highlighted in white squares are shown enlarged in right-side panels (nuclei omitted for better visualization of bacteria and actin tails). Data are representative of one (a) or two (bd) experiments. Scale bars: 2 µm (a;d, inset panels), 50 µm (c), and 10 µm (d, left panels). Source data are provided as a Source Data file.

References

    1. Beskrovnaya, P., Sexton, D. L., Golmohammadzadeh, M., Hashimi, A. & Tocheva, E. I. Structural, metabolic and evolutionary comparison of bacterial endospore and exospore formation. Front. Microbiol.12, 452 (2021). - PMC - PubMed
    1. Dong, K. et al. Induction, detection, formation, and resuscitation of viable but non-culturable state microorganisms. Compr. Rev. food Sci. food Saf.19, 149–183 (2020). - PubMed
    1. Ayrapetyan, M., Williams, T. & Oliver, J. D. Relationship between the viable but nonculturable state and antibiotic persister cells. J. Bacteriol.200, 580 (2018). - PMC - PubMed
    1. Li, L., Mendis, N., Trigui, H., Oliver, J. D. & Faucher, S. P. The importance of the viable but non-culturable state in human bacterial pathogens. Front. Microbiol.5, 258 (2014). - PMC - PubMed
    1. Baker, R. M., Singleton, F. L. & Hood, M. A. Effects of nutrient deprivation on Vibrio cholerae. Appl. Environ. Microbiol.46, 930–940 (1983). - PMC - PubMed

Publication types

Substances

Associated data