. 2024 Oct 2;14(1):407.
doi: 10.1038/s41398-024-03100-w.

Nighttime-specific differential gene expression in suprachiasmatic nucleus and habenula is associated with resilience to chronic social stress

Affiliations

Nighttime-specific differential gene expression in suprachiasmatic nucleus and habenula is associated with resilience to chronic social stress

Priyam Narain et al. Transl Psychiatry. .

Abstract

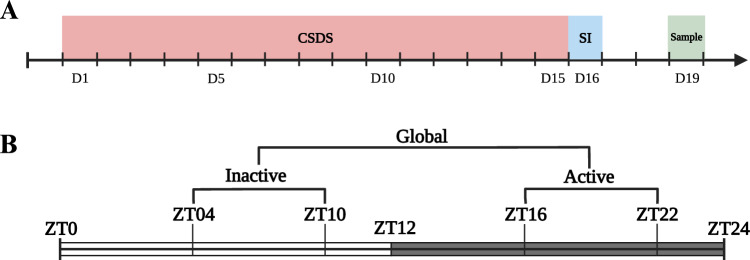
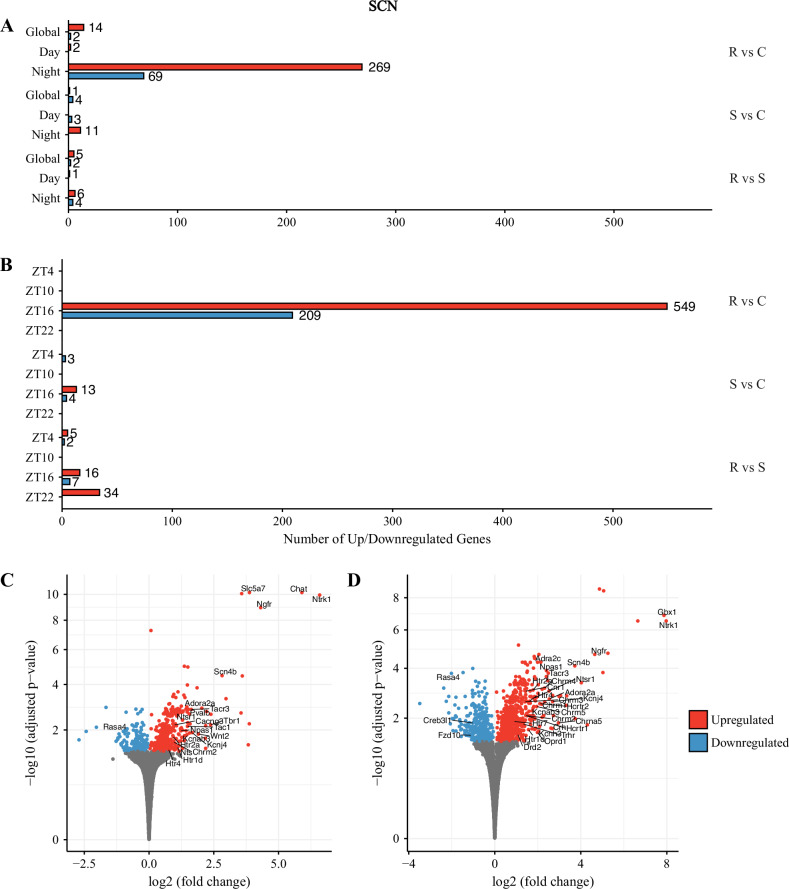
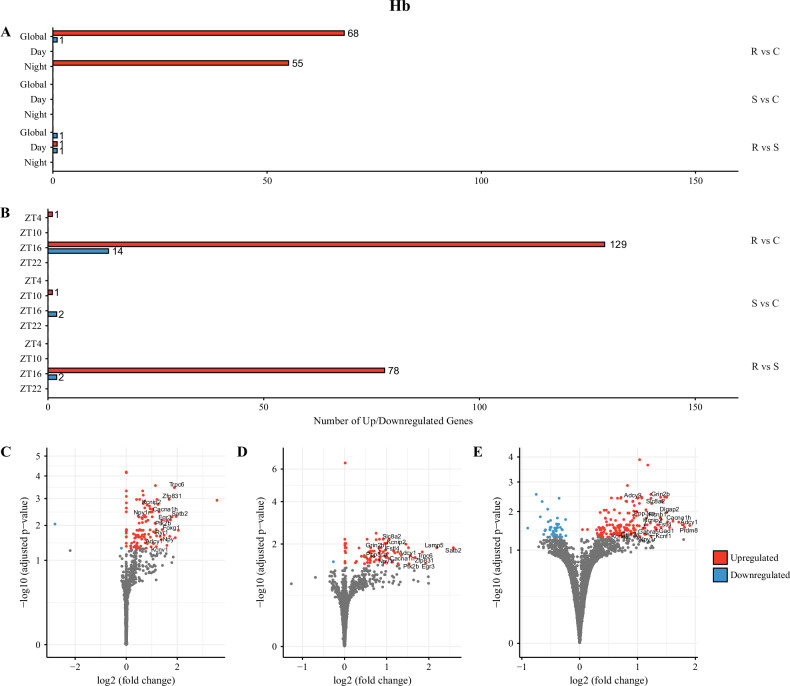
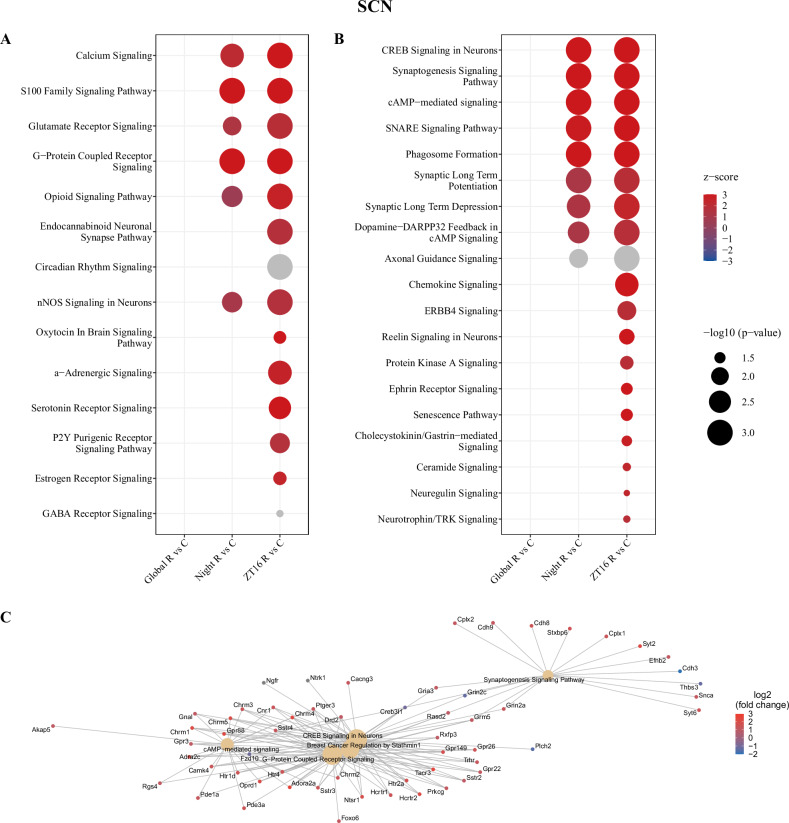
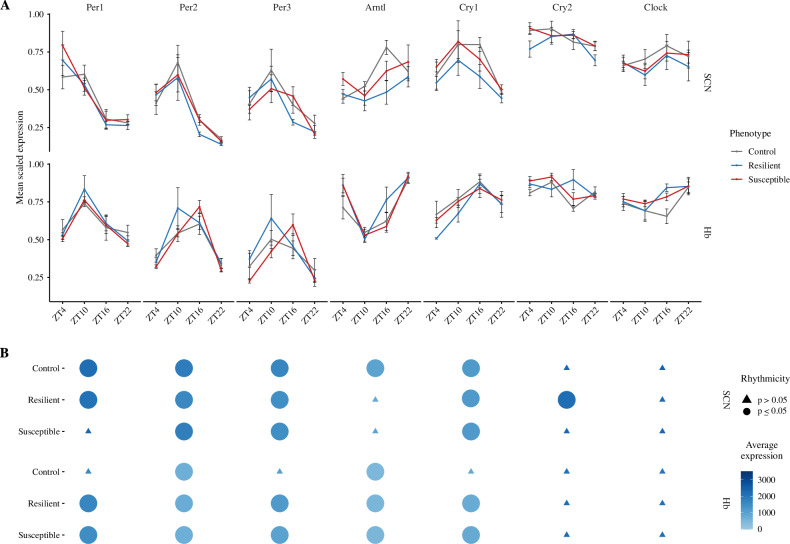
The molecular mechanisms that link stress and biological rhythms still remain unclear. The habenula (Hb) is a key brain region involved in regulating diverse types of emotion-related behaviours while the suprachiasmatic nucleus (SCN) is the body's central clock. To investigate the effects of chronic social stress on transcription patterns, we performed gene expression analysis in the Hb and SCN of stress-naïve and stress-exposed mice. Our analysis revealed a large number of differentially expressed genes and enrichment of synaptic and cell signalling pathways between resilient and stress-naïve mice at zeitgeber 16 (ZT16) in both the Hb and SCN. This transcriptomic signature was nighttime-specific and observed only in stress-resilient mice. In contrast, there were relatively few differences between the stress-susceptible and stress-naïve groups across time points. Our results reinforce the functional link between circadian gene expression patterns and differential responses to stress, thereby highlighting the importance of temporal expression patterns in homoeostatic stress responses.


Conflict of interest statement

The authors declare no competing interests.

Figures

Fig. 1
Fig. 1. Experimental design.
A Timeline for investigating the effects of stress on temporal changes in gene expression in stress-naïve and stress-exposed animals. B Sampling time points and emerging comparison levels from pooling the sampling time points.
Fig. 2
Fig. 2. Differentially expressed genes (DEGs) (FDR < 0.05 and |log2FC| > 0.5) between the phenotypes at different time points in the SCN.
A Number of DEGs at pooled time points. At the global comparison level, there were 16, 5 and 7 DEGs in resilient-to-control, susceptible-to-control and resilient-to-susceptible comparisons, respectively. Daytime comparison revealed 2, 3 and 1 DEGs for resilient-to-control, susceptible-to-control and susceptible-to-resilient comparisons, respectively. Nighttime comparison revealed 338, 11 and 10 DEGs for resilient-to-control, susceptible-to-control and susceptible-to-resilient comparisons, respectively. B Number of DEGs at specific time points. At ZT4, there were 0, 3 and 7 DEGs for resilient-to-control, susceptible-to-control and resilient-to-susceptible comparisons. At ZT10, there were no DEGs for any phenotypic comparison. At ZT16, there were 758, 17 and 23 DEGs for resilient-to-control, susceptible-to-control and resilient-to-susceptible comparisons, respectively. At ZT22, there were 0, 0 and 34 DEGs for resilient-to-control, susceptible-to-control and resilient-to-susceptible, respectively. C Nighttime comparison: Volcano plot showing significant DEGs (FDR < 0.05) in resilient mice relative to controls at nighttime comparison level in SCN. D ZT16 comparison: Volcano plot showing significant DEGs (FDR < 0.05) in resilient mice relative to controls at ZT16 in SCN. Red and blue points represent significantly upregulated and downregulated genes, respectively.
Fig. 3
Fig. 3. Differentially expressed genes (DEGs) (FDR < 0.05 and |log2FC| > 0.5) between the phenotypes at different time points in the Hb.
A Number of DEGs at pooled time points. At the global comparison level, there were 69, 0 and 1 DEGs for resilient-to-control, susceptible-to-control and resilient-to-susceptible comparisons, respectively. At the daytime comparison level, there were 0, 0 and 2 DEGs for resilient-to-control, susceptible-to-control and susceptible-to-resilient comparisons, respectively. At the nighttime comparison level, there were 55, 0 and 0 DEGs for resilient-to-control, susceptible-to-control and susceptible-to-resilient comparisons, respectively. B Number of DEGs at specific sampled time points. At ZT4, there were 1, 0 and 0 DEGs for resilient-to-control, susceptible-to-control and resilient-to-susceptible comparisons. At ZT10, there were no DEGs for resilient-to-control and resilient-to-susceptible comparisons, and only 1 DEG in susceptible-to-control comparison. At ZT16, there were 143, 2 and 80 DEGs for resilient-to-control, susceptible-to-control and resilient-to-susceptible comparisons, respectively. At ZT22, there were no DEGs in any of the phenotypic comparisons. C Global comparison: Volcano plot showing significant DEGs (FDR < 0.05) in resilient mice relative to controls at global comparison level in Hb. DEGs were labelled based on |log2FC| > 1.0 and biological relevance. D Nighttime comparison: Volcano plot showing significant DEGs (FDR < 0.05) in resilient mice relative to controls at nighttime comparison level in Hb. E ZT16 comparison: Volcano plot showing significant DEGs (FDR < 0.05) in resilient mice relative to controls at ZT16 time point in Hb. Red and blue points represent significantly upregulated and downregulated genes, respectively.
Fig. 4
Fig. 4. Enriched pathways in the SCN of resilient mice relative to controls.
The activation pattern of enriched biological pathways in the SCN. All lists are sorted by adjusted p-value. Red denotes activation (z > 0), blue denotes inhibition (z < 0), white denotes no net effect (z = 0), and grey denotes uncertain activation pattern. A Enriched signalling pathways. B Enriched plasticity-associated pathways. C Gene-concept networks of the 5 most enriched IPA pathways at ZT16 between resilient and control phenotypes in the SCN.
Fig. 5
Fig. 5. Enriched pathways in the Hb of resilient mice relative to controls.
The activation pattern of enriched biological pathways in the Hb. All lists are sorted by adjusted p-value. Red denotes activation (z > 0), blue denotes inhibition (z < 0), white denotes no net effect (z = 0), and grey denotes uncertain activation pattern. A Enriched signalling pathways. B Enriched plasticity-associated pathways. C Gene-concept networks of 5 most enriched IPA pathways at ZT16 between resilient and control phenotypes in the Hb.
Fig. 6
Fig. 6. Clock gene rhythmicity.
A Temporal expression of core clock genes in the SCN and Hb of control, resilient and susceptible mice. All the clock genes show previously reported temporal expression in the SCN of control mice. B Dotplot showing rhythmic expression of clock genes in SCN and Hb. SCN: Per1 is arhythmic stress-susceptible mice. Arntl is arrhythmic in both resilient and susceptible mice. Cry2 is rhythmic in resilient mice. Hb: Per1, Per3 and Cry1 are arrhythmic in the stress-naïve mice, while being rhythmic in both the resilient and susceptible mice.

References

    1. Maletic V, Robinson M, Oakes T, Iyengar S, Ball SG, Russell J. Neurobiology of depression: an integrated view of key findings. Int J Clin Pract. 2007;61:2030–40. - PMC - PubMed
    1. Li JZ, Bunney BG, Meng F, Hagenauer MH, Walsh DM, Vawter MP, et al. Circadian patterns of gene expression in the human brain and disruption in major depressive disorder. Proc Natl Acad Sci USA 2013;110:9950–5. - PMC - PubMed
    1. Joyce PR, Porter RJ, Mulder RT, Luty SE, McKenzie JM, Miller AL, et al. Reversed diurnal variation in depression: associations with a differential antidepressant response, tryptophan:large neutral amino acid ratio and serotonin transporter polymorphisms. Psychol Med. 2005;35:511–7. - PubMed
    1. Germain A, Kupfer DJ. Circadian rhythm disturbances in depression. Hum Psychopharmacol Clin Exp. 2008;23:571–85. - PMC - PubMed
    1. Walker WH, Walton JC, DeVries AC, Nelson RJ. Circadian rhythm disruption and mental health. Transl Psychiatry. 2020;10:28. - PMC - PubMed

LinkOut - more resources