. 2024 Oct 2;15(1):8544.
doi: 10.1038/s41467-024-52694-8.

Molecular and functional landscape of malignant serous effusions for precision oncology

Affiliations

Molecular and functional landscape of malignant serous effusions for precision oncology

Rebekka Wegmann et al. Nat Commun. .

Abstract

Personalized treatment for patients with advanced solid tumors critically depends on the deep characterization of tumor cells from patient biopsies. Here, we comprehensively characterize a pan-cancer cohort of 150 malignant serous effusion (MSE) samples at the cellular, molecular, and functional level. We find that MSE-derived cancer cells retain the genomic and transcriptomic profiles of their corresponding primary tumors, validating their use as a patient-relevant model system for solid tumor biology. Integrative analyses reveal that baseline gene expression patterns relate to global ex vivo drug sensitivity, while high-throughput drug-induced transcriptional changes in MSE samples are indicative of drug mode of action and acquired treatment resistance. A case study exemplifies the added value of multi-modal MSE profiling for patients who lack genetically stratified treatment options. In summary, our study provides a functional multi-omics view on a pan-cancer solid tumor cohort and underlines the feasibility and utility of MSE-based precision oncology.


Conflict of interest statement

B.S. was a scientific co-founder of Allcyte, which has been acquired by Exscientia. B.S. is a shareholder of Exscientia and a co-inventor on US patent application 15/514,045 relevant to the study. C.B. reports consulting or advisory role for AstraZeneca, Pfizer, Roche, Takeda, Janssen-Cilag, Boehringer-Ingelheim, Merck KGaA, Sanofi; research funding from Bayer; and travel, accommodation, and expenses from AstraZeneca, Takeda, Amgen. All of those are outside the presented work. H.M. is on advisory boards for Astra Zeneca, Stemline Therapeutics, Bayer, Amgen, Astella, MSD, Roche, and Merck. M.Z. receives research funds from Roche. P.P. is a scientific advisor for the company Biognosys AG (Zurich, Switzerland). All other authors declare no competing interests.

Figures

Fig. 1
Fig. 1. Functional and molecular profiling of a pan-cancer cohort of malignant serous effusions (MSE).
a Circos plot visualizing key clinical parameters. Samples taken from the same patient are connected with a gray line. For a more detailed description of the clinical parameters, see Supplementary Data 1. b Table summarizing clinical data shown in (a). Note that for the parameters “sample type” and “number of prior treatments,” the same patient can be counted in multiple categories, and thus, the patient numbers do not necessarily add up to 105. c Schematic representation of the molecular and functional profiling workflow. Cells were isolated from MSE and analyzed by pharmacoscopy (PCY), an image-based single-cell ex vivo drug response assay, which provides information on the cell type composition of each sample, as well as cell type-specific responses to a panel of 101 anticancer drugs. We further collected matched gene expression data (bulk RNA-seq, n = 131) and genomic alterations (FoundationOne CDx assay, n = 98 MSE samples and 24 patient-matched solid tissue samples), whenever samples contained a sufficient amount of tumor cells. For a subset of five LUAD samples, gene expression in response to drug perturbation (DRUG-seq) was measured. For further details, please see Supplementary Figs. 1–6 and Supplementary Data 1–10.
Fig. 2
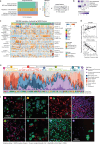
Fig. 2. Integrative view on functional and molecular profiles of pan-cancer MSE samples.
a Schematic depiction of the multi-omics factor analysis (MOFA) workflow. b Percentage of variance explained by each data type per factor, for the first seven factors ranked by highest overall fraction of variance explained. c Heatmap showing the top features contributing to the first seven MOFA factors for each of the 149 MSE samples. For each of the top seven MOFA factors, the values of the features that contribute most to this factor are shown. Sample type, tumor type, data type, and select feature names are annotated. d Correlation of factor 1 with either (top panel) EPCAM expression (excluding non-epithelial tumors; n = 116) or (bottom panel) expression of immune-marker PTPRC/CD45 (n = 131 samples). Linear regression line with 95% confidence bands, R squared, and corresponding P value (two-sided t test) are indicated. e Cell type composition per sample. Samples are grouped into 8 clusters based on their composition using hierarchical clustering (pearson correlation, complete linkage) and tree-cutting. f Example PCY images of MSE samples from each cluster. Images represent 8 out of 150 biological replicates, with 400 images of DMSO-treated cells per sample. Stainings and scale bars are indicated.
Fig. 3
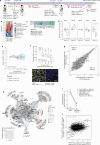
Fig. 3. Tumor cells from MSE recapitulate transcriptional and genomic aspects of their primary tumors.
a t-distributed stochastic neighbor embedding (t-SNE) based on the tumor content-corrected expression of the 5% most variable genes for 149 MSE samples. Dot color indicates tumor type. b Violin plots indicating expression of selected genes across the cohort grouped by tumor type (from left to right: LUAD, OV, MESO, BRCA, STAD). These genes were identified by differential expression (DE) analysis comparing each individual tumor type separately to all other tumor types, accounting for confounders tumor content, sequencing batch, and biological sex. c t-SNE projection of integrated transcriptomes of LUAD, OV, BRCA, MESO, and STAD samples from primary tumors in the TCGA cohort (small transparent dots, n = 2452) and this MSE cohort (n = 101, big outlined dots). The accuracy of a 1-nearest neighbor (1-NN) classifier trained on the TCGA data and evaluated for predicting the MSE tumor types is indicated (see Supplementary Fig. 10d). d Comparison of mutational profiles measured by FoundationOne CDx between patient-matched solid biopsies (n = 24 patients) and their corresponding MSE samples. e Box plots indicating the Jaccard coefficients between mutational profiles of each pair of samples, stratified by whether samples were patient-matched (left) or not (right). P value from two-sided, two-sample Wilcoxon test. Box plots indicate the median (horizontal line) and 25% and 75% ranges (box), and whiskers indicate the 1.5× interquartile range above or below the box. Outliers beyond this range are shown as individual data points. f Concordance of genomic alterations between MSE and patient-matched solid tissue biopsies evaluated for all actionable alterations measured by FoundationOne (left), only druggable alterations measured by FoundationOne (middle), and druggable alterations measured by FoundationOne on MSE and a different diagnostic test on the solid tissue (see Supplementary Data 9). Colors indicate the type of alteration (CNV copy number variation, RA rearrangement, SUB substitution), and lightness encodes concordance.
Fig. 4
Fig. 4. Pan-cancer integration of transcriptomics and ex vivo drug responses.
a MOFA Factor 5 plotted against the overall ex vivo ‘sensitivity score’ (fraction of drugs with RCF > 0, n = 149 samples). Linear regression lines with 95% confidence bands and corresponding P value (two-sided t test) are indicated. b Top-15 pathways resulting from gene set enrichment analysis (GSEA) for genes associated with the sensitivity score. Densities represent the t statistic of the generalized linear model (edgeR). Colors indicate −log10 FDR (Benjamini–Hochberg, BH) of the GSEA. c Volcano plot for the association between sensitivity score and gene expression. Genes belonging to the GO term “DNA conformation change” (GO:0071103) are highlighted in dark red. d Illustration of RNA-seq and drug response integration in LUAD MSE samples. For each drug, we associated RCF with baseline gene expression (top arrow; n = 59 samples). In addition, we measured drug-induced transcriptional changes in a subset of LUAD samples (bottom arrow; n = 5 samples). We then assessed whether the obtained associations or transcriptional changes were enriched in genes that are connected to the drug’s primary and secondary target(s). e Fraction of evaluable drugs for which the drug response-associated genes were significantly enriched in the drug target-proximal gene set. f BH-corrected enrichment p value (right-tailed hypergeometric test) for individual drugs in baseline and DRUG-seq analysis. Drug-target classes are annotated. g Baseline expression of CDC20 associated with ex vivo response to gemcitabine (top), and change in CDC20 expression in cells exposed to gemcitabine (bottom). P values in both panels from DE analysis using the quasi-likelihood F-test implemented in egdeR. Top: Dots represent 59 biological replicates, linear regression line with 95% confidence bands is indicated. Bottom: Box-plots as in Fig. 3e. Data from five independent samples with four technical replicates per sample. h, i Example drug target-proximal gene networks for vinorelbine (h) and palbociclib (i). Green nodes denote the drug; every other node corresponds to a gene. Colors indicate log2 fold change of this gene when comparing drug-treated to DMSO-treated cells. Select subnetworks and gene names are annotated. Enrichment statistics (right-tailed hypergeometric test, BH-adjusted) are depicted by mosaic plots (inserts).
Fig. 5
Fig. 5. Characterizing tumor spheroids in lung adenocarcinoma.
a Morphological composition of tumor cells in LUAD samples, sorted by spheroid fraction. b Example images (gray: brightfield, pink: DAPI/nuclei) of MSE samples with low and high fractions of tumor cell spheroids. Images are representative of 59 biological replicates and 400 images each. c Fraction of spheroids stratified by the response to the treatment following the biopsy, for n = 24 samples obtained prior to therapy start. d Fraction of spheroids stratified by actionable genomic alterations (BRAF V600E: 11 samples, 3 patients; EGFR: 18 samples, 9 patients; other: 34 samples, 24 patients). P values from Tukey’s honestly significant difference (HSD) test. e Example images of drug-induced spheroid dissociation (gray: brightfield, pink: DAPI/nuclei). Images are representative of 59 biological replicates with 100 images per drug treatment. f Integration of spheroid abundances from PCY and transcriptional responses from DRUG-seq (n = 5 LUAD samples and 48 drugs). TIMP1 (left) represents a gene whose expression was associated with spheroid abundance across ex vivo treatments. g Volcano plot for DRUG-seq analysis of spheroid fractions (see Methods). h Top 10 pathways (GSEA) for genes associated with spheroid fraction. Density plots and P values as in Fig. 4b. NMD nonsense-mediated decay, n-t nuclear-transcribed, PTTM protein targeting to membrane. i Pathway scores (singscore, see Methods) for mitochondrial translation (GO:0032543) and cell adhesion (GO:0007155) associated with spheroid fraction. P value from linear regression (two-sided t test). j Spheroid dissociation in response to EGFR inhibition in 43 spheroid-containing LUAD MSE samples, stratified by the presence of any mutation in EGFR (EGFR mutant: n = 12 samples from 8 patients, EGFR wild type: n = 31 samples from 20 patients). The values correspond to the mean spheroid dissociation response across four tested EGFR inhibitors (see Supplementary Fig. 14). All box-plots as in Fig. 3e; P values in (c) and (j) from two-sided Wilcoxon rank-sum test; P values in (f) and (g) from edgeR quasi-likelihood F-test with BH correction. Lines and shaded areas in (f) and (i) correspond to a linear regression fit with 95% confidence bands.
Fig. 6
Fig. 6. Molecular and functional characterization of acquired BRAF + MEK inhibitor resistance in patient PID028.
a Patient PID028’s clinical course (see Supplementary patient case PID028). b PCY-based cellular and morphological sample composition over time. c Genomic alterations at diagnosis (FB103), first relapse (FB209) and second relapse (FB261). d PCY-based ex vivo response to dabrafenib + trametinib in longitudinal MSE samples. Dots represent technical replicates (n = 4 for drugs, n = 16 for DMSO). e Dose-response to dabrafenib + trametinib at relapse to targeted therapy (FB215). Dots represent technical replicates (n = 3), lines and shaded areas indicate the mean and 95% confidence interval per concentration. f Fraction of phospho-ERK (pERK) positive tumor cells in response to different doses of dabrafenib + trametinib. Dots represent technical replicates (n = 3 per concentration and n = 17 for DMSO). Exact P values are provided in the Source Data. g Comparison of gene expression of FACS-purified tumor cells from diagnosis (FB103) and relapse to targeted therapy (FB215). Highlighted genes are implicated in acquired resistance to this therapy in melanoma. h Drug-target-proximal gene network for dabrafenib and trametinib. Green dots correspond to compounds, all other nodes represent genes. Color indicates log2 fold change of dabrafenib + trametinib vs DMSO in FACS-purified tumor cells from sample FB215. Enrichment visualized by mosaic plot (insert), P value from right-tailed hypergeometric test. i Change in DUSP6 levels after exposure to dabrafenib + trametinib across five additional samples measured by DRUG-seq. Values represent average expression across four replicate wells. P value from paired two-sided Wilcoxon test. j Comparison of in situ and ex vivo transcriptional adaptation of tumor cells to dabrafenib + trametinib. X axis corresponds to log2 fold change of gene expression in tumor cells taken at diagnosis (FB103) vs relapse (FB215), and y axis to log2 fold change of gene expression of tumor cells (FB215) treated ex vivo with dabrafenib + trametinib relative to DMSO. Regression line with 95% confidence bands, Pearson’s R, and corresponding P value (two-sided t test) are indicated. P values in (d) and (f) from two-sided Student’s t test comparing treatment to control, no adjustment for multiple testing. All box plots as in Fig. 3e.
Fig. 7
Fig. 7. Identification of non-genetic MET upregulation as a drug target.
a Clinical course of patient PID038. See Supplementary patient case PID038 for details. b PCY-based cellular and morphological sample composition over time. c Comparison of genomic profile between tissue at diagnosis (solid tumor biopsy) and after relapse to osimertinib (FB287) measured by FoundationOne CDx. d PCY-based ex vivo responses of the MSE sample at relapse to osimertinib (FB287) All drugs with significant on-target effects (RCF > 0, p < 0.01) are shown, as well as the previous treatment osimertinib. Exact P values (two-sided Student’s t test, no adjustment for multiple testing) per drug are provided in the Source Data. Drugs highlighted in red target MET. e Comparison of gene expression profiles in FACS-purified tumor cells between FB133 (diagnosis) and FB295 (relapse). MET expression strongly increased in the relapse sample. f Immunohistochemistry against cMET at diagnosis (top, cMET intensity 2+ in ~30% of tumor cells) and relapse (bottom, cMET intensity between 2+ and 3+ in 95% of tumor cells). Image represents 1.5% of the full scanned area, the full scans are provided in Supplementary Fig. 15. g Ex vivo response of FB295 to the combination of capmatinib and osimertinib. An on-target effect is observed across concentrations. P values in (d) and (g) from a two-sample two-sided Student’s t test comparing treatment condition to DMSO control, no adjustment for multiple testing. All box-plots as in Fig. 3e.

References

    1. Quaresma, M., Coleman, M. P. & Rachet, B. 40-year trends in an index of survival for all cancers combined and survival adjusted for age and sex for each cancer in England and Wales, 1971–2011: a population-based study. Lancet385, 1206–1218 (2015). - PubMed
    1. Arnold, M. et al. Progress in cancer survival, mortality, and incidence in seven high-income countries 1995–2014 (ICBP SURVMARK-2): a population-based study. Lancet Oncol.20, 1493–1505 (2019). - PMC - PubMed
    1. Honkala, A., Malhotra, S. V., Kummar, S. & Junttila, M. R. Harnessing the predictive power of preclinical models for oncology drug development. Nat. Rev. Drug Discov.21, 99–114 (2021). - PubMed
    1. Attwood, M. M., Fabbro, D., Sokolov, A. V., Knapp, S. & Schiöth, H. B. Trends in kinase drug discovery: targets, indications and inhibitor design. Nat. Rev. Drug Discov.20, 839–861 (2021). - PubMed
    1. Slamon, D. J. et al. Human breast cancer: correlation of relapse and survival with amplification of the HER-2/neu oncogene. Science235, 177–182 (1987). - PubMed

Publication types

MeSH terms

Associated data