. 2024 Oct 2;15(1):8539.
doi: 10.1038/s41467-024-52431-1.

ZIC2 and ZIC3 promote SWI/SNF recruitment to safeguard progression towards human primed pluripotency

Affiliations

ZIC2 and ZIC3 promote SWI/SNF recruitment to safeguard progression towards human primed pluripotency

Ishtiaque Hossain et al. Nat Commun. .

Abstract

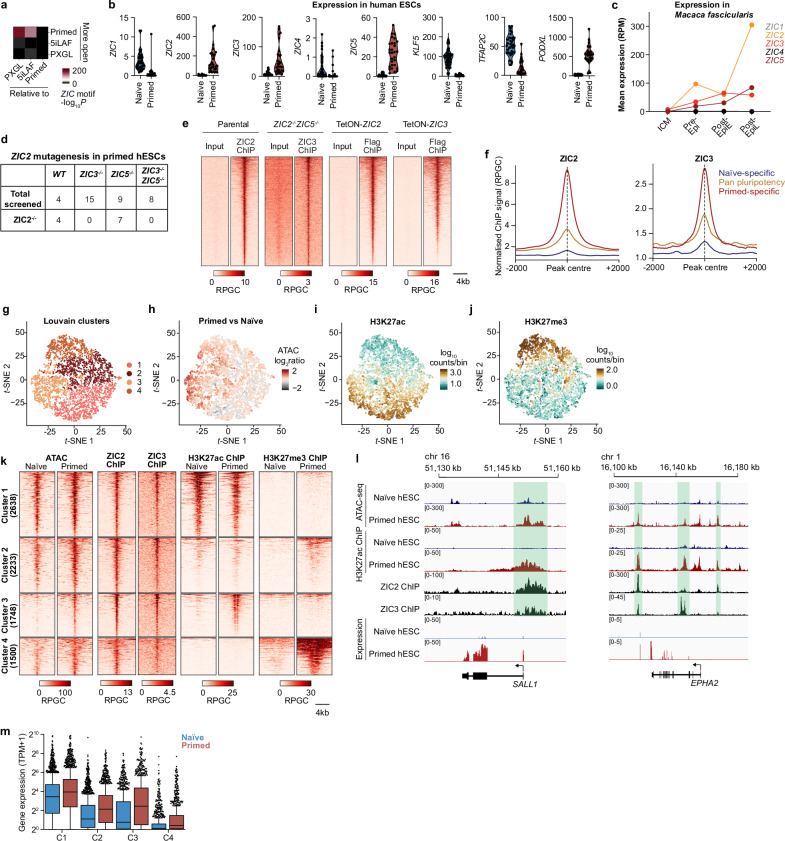
The primed epiblast acts as a transitional stage between the relatively homogeneous naïve epiblast and the gastrulating embryo. Its formation entails coordinated changes in regulatory circuits driven by transcription factors and epigenetic modifications. Using a multi-omic approach in human embryonic stem cell models across the spectrum of peri-implantation development, we demonstrate that the transcription factors ZIC2 and ZIC3 have overlapping but essential roles in opening primed-specific enhancers. Together, they are essential to facilitate progression to and maintain primed pluripotency. ZIC2/3 accomplish this by recruiting SWI/SNF to chromatin and loss of ZIC2/3 or degradation of SWI/SNF both prevent enhancer activation. Loss of ZIC2/3 also results in transcriptome changes consistent with perturbed Polycomb activity and a shift towards the expression of genes linked to differentiation towards the mesendoderm. Additionally, we find an intriguing dependency on the transcriptional machinery for sustained recruitment of ZIC2/3 over a subset of primed-hESC specific enhancers. Taken together, ZIC2 and ZIC3 regulate highly dynamic lineage-specific enhancers and collectively act as key regulators of human primed pluripotency.


Conflict of interest statement

The authors declare no competing interests.

Figures

Fig. 1
Fig. 1. Characterisation of ZIC2 and ZIC3 chromatin occupancy in naïve and primed hESCs.
a Enrichment of ZIC motif from pairwise comparisons of regions open specifically, in naïve (cultured in two conditions: PXGL and 5iLAF) and primed hESCs. P values calculated from a one-tailed Binomial test and were statistically significant for primed-specific ATAC peaks after adjusting for multiple comparisons by the Benjamini–Hochberg procedure. b Normalised expression of ZIC family transcription factors in naïve and primed hESCs. Expression of naïve pluripotency markers KLF5 and TFAP2C, and primed pluripotency marker PODXL, are shown as reference. Values are expressed as TPM. c Mean expression of ZIC1-5 in the inner cell mass and epiblast of cynomolgus macaques. RPM reads per million mapped reads. d Record of success in generating ZIC2−/− clonal lines in primed hESCs with genetic background indicated. ZIC2−/− hESCs were successfully generated on WT and ZIC5−/− background but not on ZIC3−/− background. e Heatmap showing enrichment of ZIC2, ZIC3, Flag-ZIC2 and Flag-ZIC3 over ZIC2 ChIP-seq peaks. f Normalised ChIP-seq coverage of ZIC2 and ZIC3 over primed-specific, naïve-specific and pan pluripotency ATAC peaks. Louvain clusters of ZIC2-bound chromatin projected on a t-SNE plot—each dot represents a 2 kb bin around a ZIC2 peak (g), change in chromatin accessibility of each ZIC2 peak in primed hESCs relative to naïve hESCs (h), enrichment of H3K27ac ChIP-seq reads (i) and H3K27me3 ChIP-seq reads (j) in primed hESCs. k Heatmap showing read density of ATAC, ZIC2, ZIC3 and H3K27 post-translational modifications within Louvain clusters of ZIC2-bound chromatin in naïve and primed hESCs. e, f, k RPGC reads per 1x genome coverage. l Gene browser tracks around two representative C3 loci. Values are reported in RPGC. m Expression of genes in naïve and primed hESCs within 50 kb of a ZIC2-bound locus as defined in (g). Mean values for each gene from four biological replicates were calculated and plotted in the appropriate set. Boxplots show median and inter-quartile range. Whiskers are calculated using the Tukey method. b, m TPM transcripts per million. Source data are provided as a Source Data file.
Fig. 2
Fig. 2. Role of ZIC2 and ZIC3 in maintaining integrity of primed hESCs.
a Schematic of experiments involving transient deletion of ZIC2 in primed hESCs. Representative image of genotyping showing successful excision 5 days after electroporation (excised allele indicated with arrow). b Ratio of KO to WT amplicon over time after targeting of ZIC2 in hESCs of genotypes indicated. c Flow cytometry for CD56/CD184 and CD24 of WT and ZIC3−/−ZIC5−/− primed hESCs depleted of ZIC2. d Brightfield images of WT and ZIC2−/−ZIC3−/−ZIC5−/− primed hESCs. Scale bars 150 μm. Data are representative of three biological replicates. e Heatmap with scaled expression of all DEGs identified from pairwise comparison of WT primed hESCs and primed hESCs depleted of ZIC2, ZIC3 and ZIC5 as single- or combinatorial deletions. Two genesets were identified from hierarchical clustering. f Expression dynamics of genesets identified from DEGs in hESC-derived in vitro cultured lineages of the epiblast. g Scaled expression of select genes in the indicated lineages, and WT and ZIC2−/−ZIC3−/− primed hESCs. Number of dots represents the number of biological replicates used to represent each lineage. Median values are shown, and boxplots represent the inter-quartile range. Whiskers indicate minimum and maximum expression values of each gene within the dataset. P values were calculated from a two-tailed Wald test and adjusted for multiple comparisons by the Benjamini–Hochberg procedure. Genome browser tracks of ZIC2 ChIP-seq, H3K27me3 ChIP-seq  (h) or ATAC-seq  (i) around genes representative of genesets 1 and 2 in primed hESCs upon concomitant loss of ZIC2 and ZIC3. j Scatterplot of genes that are identified to be growth-limiting or essential in primed hESCs, with fold change of expression in ZIC2−/−ZIC3−/− hESCs vs WT primed hESCs indicated. k Heatmap indicating change in expression of genes upregulated or downregulated in ZIC2−/−ZIC3−/−, showing expression changes of same genes in hESCs treated for 7 days with EZH2i or in EED−/− hESCs. l Normalised EZH2 CUT&Tag signal over annotated bivalent promoters in primed hESCs, in ZIC2−/−ZIC3−/− and WT primed hESCs. m Normalised H3K27me3 signal in 5 kb bins among H3K27me3-enriched regions upon loss of ZIC2 compared with WT primed hESC (left) and loss of ZIC2/3/5 compared to loss of ZIC3/5 in primed hESCs (right). Source data are provided as a Source Data file.
Fig. 3
Fig. 3. ZIC2 and ZIC3 maintain BRG1-dependent chromatin accessibility over primed hESC-specific enhancers.
a Enrichment of motifs corresponding to ZIC factors in differentially accessible regions (DARs) in single- and compound ZIC2/3/5 mutants. b Top motifs enriched among loci that lose accessibility in ZIC2−/−ZIC3−/− and ZIC2−/−ZIC3−/−ZIC5−/− compared to WT primed hESCs. a, b P values calculated from a one-tailed Binomial test, and were statistically significant after adjusting for multiple comparisons by the Benjamini–Hochberg procedure. c Number of DARs in ZIC2−/−ZIC3−/− hESCs that overlap with ZIC2-bound loci, grouped by Louvain clusters. d Composite plots showing ATAC-seq signal in WT and ZIC2−/−ZIC3−/− hESCs over ZIC2-bound loci, grouped by Louvain clusters. e Kernel density estimate plots of ATAC-seq signal over primed-specific enhancers, stratified by whether each loci contains motifs corresponding to ZIC factors or not. Median values are shown and P values were calculated from a two-tailed paired Wilcoxon signed-rank test. f Correspondence of regions that lose accessibility in ZIC2−/−ZIC3−/− hESCs and C3 loci to differentially expressed genes, grouped by distance. g Heatmap of scaled ATAC-seq signal, reported in CPB, over all DARs identified across all mutants. Three sets of DARs were identified by k-means clustering. Enriched biological process terms identified from GREAT analysis and top motifs enriched among each cluster are shown. h Western blot of BRG1 upon immunoprecipation of ZIC2 in primed hESCs. i Western blot of ZIC2 upon simultaneous immunoprecipitation of BRG1 and SMARCD1. h, i Images are representative of two biological replicates. Size markers (in kilodaltons) indicated on right. j Composite plot showing ATAC-seq signal ratio of SMARCA4−/− hESCs compared to WT upon culture of naïve hESCs in primed hESC media conditions. k Composite plots showing normalised BRG1 CUT&Tag signal over ZIC2-bound peaks grouped by Louvain clusters, in WT and ZIC2−/−ZIC3−/− hESCs. d, e, g, k CPB = counts per bin. l Scatterplot of BRG1 CUT&Tag and ATAC-seq signal ratios over 200 bp bins in the centre of C3 regions, in WT hESCs relative to ZIC2−/−ZIC3−/− hESCs. Dotted lines show origin and gating. Numbers in each quadrant represent percentage of all regions considered within each gate. m Genome browser tracks of ATAC-seq and BRG1 CUT&Tag in WT and ZIC2−/−ZIC3−/− primed hESCs around a ZIC2/3-regulated gene. Source data are provided as a Source Data file.
Fig. 4
Fig. 4. ZIC2 facilitates exit from naïve pluripotency.
a Schematic of experiments designed to determine where 3xFlag-ZIC2 localises to on chromatin and how it affects naïve pluripotency. b Brightfield images of TetON-ZIC2 naïve hESCs upon treatment with doxycycline compared to DMSO control. Scale bar 100 μm. Data are representative of two biological replicates. c Contour plots showing expression of CD75 and CD24 in TetON-ZIC2 naïve hESCs upon treatment with doxycycline compared to DMSO control. d Volcano plot showing number of DEGs in naïve hESCs upon ectopic expression of ZIC2. P values were calculated from a two-tailed Wald test and adjusted for multiple comparisons by the Benjamini–Hochberg procedure. e 2D plot showing overlap of genes that become differentially expressed upon ectopic expression of ZIC2 in naïve hESCs, with genes that are differentially expressed in naïve and primed hESCs. TPM transcripts per million. f Experimental setup to test lineage potency of naïve hESCs in response to ASECRiAV medium, upon ectopic expression of ZIC2 or ZIC3. g (Top) Expression of ZIC2 in naïve hESCs upon treatment with doxycycline for different timepoints. (Bottom) Expression of AMLC markers in naïve hESCs pre-treated with doxycycline for different timepoints and then cultured in ASECRiAV medium. Gene expression trends are shown. Source data are provided as a Source Data file.
Fig. 5
Fig. 5. SWI/SNF acts downstream of ZIC factors in opening primed hESC-specific enhancers.
a Schematic of experiments designed to test the effect of ectopic ZIC2/3 expression in naïve hESCs. b Enrichment of 3xFlag-ZIC2 over ATAC-seq peak sets indicated. c Genome browser tracks showing correspondence between 3xFlag-ZIC2 occupancy and increased chromatin accessibility. d Fraction of DARs that overlap with Flag-ZIC2-bound loci. Top motifs enriched over DARs that are not bound by 3xFlag-ZIC2 are shown. e Fraction of genes that show differential expression upon ZIC2-induction (DEGs) as a function of distance from ZIC2-bound loci that become open upon induction. f Scatterplot over 200 bp bins around centre of C3 regions showing congruence between loss of accessibility in ZIC2−/−ZIC3−/− hESCs and gain in accessibility upon 3xFlag-ZIC2 expression in naïve hESCs. Composite plots showing Flag-ZIC2 ChIP signal (left) and BRG1 CUT&Tag signal (right) over Flag-ZIC2 bound sites (g) or DARs that are opened (h) upon ZIC2 induction. b, g, h RPGC reads per 1x genome coverage. i Genome browser tracks showing ZIC2 and BRG1 occupancy over the SOX8 locus upon ZIC2 induction. j Means-average plots showing BRG1 occupancy over regions that become accessible upon Flag-ZIC2 induction in naïve hESCs. k Scatterplot over 200 bp bins around centre of C3 regions showing congruence between changes in accessibility and BRG1 occupancy upon ectopic expression of ZIC2 in naïve hESCs. l Scatterplot over 200 bp bins around centre of C3 regions, showing congruence between gain in BRG1 occupancy upon ectopic expression of ZIC2 in naïve hESCs and loss in BRG1 occupancy in ZIC2−/−ZIC3−/− primed hESCs. m Immunofluorescence showing degradation of BRG1 in primed hESCs upon treatment with ACBI1 for 2 days. Scale bar 50 μm. Images are representative of two biological replicates. n Normalised ATAC signal over regions bound by ectopic Flag-ZIC2. o Genome browser tracks showing ZIC2 and BRG1 occupancy over the TRIM54 locus upon Flag-ZIC2 induction and failure to open chromatin upon treatment with ACBI1. Normalised ATAC signal over distinct classes of ZIC2-bound regions (p), primed-specific ATAC peaks with and without ZIC motifs (q) and regions that become accessible upon ectopic expression of Flag-ZIC2 (r) in naïve hESCs in the presence or absence of ACBI1. nr Treatments were carried out for 3 days. j, n, pr CPB counts per bin. Source data are provided as a Source Data file.
Fig. 6
Fig. 6. Transcriptional machinery consolidates recruitment of ZIC2 over primed-specific enhancers.
a Enrichment of total RNAPII, Ser5p-RNAPII and BRD4 over ZIC2-bound regions. RPGC reads per 1x genome coverage. Enrichment of Ser5p-RNAPII to total RNAPII is also shown. b Schematic of experiments designed to test the effect of inhibiting various components of transcription and its machinery on recruitment of ZIC2. c Effect of treatment with triptolide (Trp) for 4 h on ZIC2 occupancy in primed hESCs. d Effect of treatment with flavopiridol (FLV) and STM2457 for 4 and 24 h, respectively, on ZIC2 occupancy in primed hESCs. cd CPB = normalized counts per bin. e Comparison of 4 h FLV and 24 h STM2457 treatment to 4 h Trp treatment on ZIC2 occupancy over C3 loci. Results were computed from two independent biological replicates. f Comparison of Trp treatment for 1 and 4 h on ZIC2 occupancy over C3 loci. ChIP-seq data for the treatment of primed hESCs with triptolide for 4 h was computed from two independent biological replicates, and data for treatment with triptolide for 1 h was computed from one replicate. e, f Median values are shown, and boxplots represent the inter-quartile range. Whiskers are calculated using the Tukey method. g Genome browser tracks showing differential effects of ZIC2 occupancy over primed-specific enhancers and bivalent regions upon treatment with triptolide in primed hESCs. Source data are provided as a Source Data file.
Fig. 7
Fig. 7. Illustration of critical findings of this study.
ZIC2 and ZIC3 have largely overlapping roles and act together as crucial regulators of human primed pluripotency, facilitating recruitment of the SWI/SNF complex over primed hESC-specific enhancers. Their simultaneous ablation in primed hESCs results in selective closing of lineage-specific enhancers, a failure to self-renew or maintain primed pluripotency, and a gene expression pattern indicative of disrupted PRC2 activity coincident with aberrant expression of mesendoderm genes. Their ectopic expression in naïve hESCs facilitates progression towards primed pluripotency in a SWI/SNF-dependent manner.

References

    1. Gifford, C. A. et al. Transcriptional and epigenetic dynamics during specification of human embryonic stem cells. Cell153, 1149–1163 (2013). - PMC - PubMed
    1. Tsankov, A. M. et al. Transcription factor binding dynamics during human ES cell differentiation. Nature518, 344–349 (2015). - PMC - PubMed
    1. Creyghton, M. P. et al. Histone H3K27ac separates active from poised enhancers and predicts developmental state. Proc. Natl. Acad. Sci. USA107, 21931–21936 (2010). - PMC - PubMed
    1. Pastor, W. A. et al. TFAP2C regulates transcription in human naive pluripotency by opening enhancers. Nat. Cell Biol.20, 553–564 (2018). - PMC - PubMed
    1. Pastor, W. A. et al. Naive human pluripotent cells feature a methylation landscape devoid of blastocyst or germline memory. Cell Stem Cell18, 323–329 (2016). - PMC - PubMed

Publication types

MeSH terms