. 2024 Oct 2;15(1):8540.
doi: 10.1038/s41467-024-52978-z.

Intrinsic temperature increase drives lipid metabolism towards ferroptosis evasion and chemotherapy resistance in pancreatic cancer

Affiliations

Intrinsic temperature increase drives lipid metabolism towards ferroptosis evasion and chemotherapy resistance in pancreatic cancer

Vincent de Laat et al. Nat Commun. .

Abstract

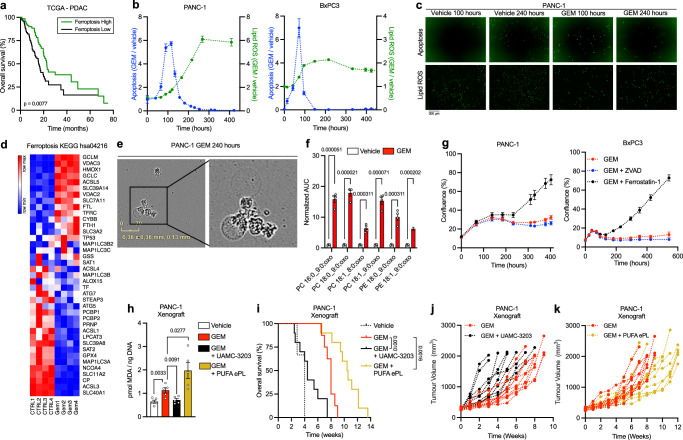
A spontaneously occurring temperature increase in solid tumors has been reported sporadically, but is largely overlooked in terms of cancer biology. Here we show that temperature is increased in tumors of patients with pancreatic ductal adenocarcinoma (PDAC) and explore how this could affect therapy response. By mimicking this observation in PDAC cell lines, we demonstrate that through adaptive changes in lipid metabolism, the temperature increase found in human PDAC confers protection to lipid peroxidation and contributes to gemcitabine resistance. Consistent with the recently uncovered role of p38 MAPK in ferroptotic cell death, we find that the reduction in lipid peroxidation potential following adaptation to tumoral temperature allows for p38 MAPK inhibition, conferring chemoresistance. As an increase in tumoral temperature is observed in several other tumor types, our findings warrant taking tumoral temperature into account in subsequent studies related to ferroptosis and therapy resistance. More broadly, our findings indicate that tumoral temperature affects cancer biology.


Conflict of interest statement

T.V.B. and K.A. hold patents US9862678, WO2016075330, EP3218357, and WO2019154795 related to ferrostatin-1 analogs. The remaining authors declare no competing interests.

Figures

Fig. 1
Fig. 1. PDAC tumoral temperature is increased and drives ferroptosis evasion.
a Maximum temperature values in paired measurements of human PDAC and adjacent pancreas (n = 11 patients). Paired two-sided Student’s t-test. b Intratumoral temperature difference compared to adjacent pancreas (n = 11 patients). Mixed-effects analysis with Dunnett’s multiple comparisons test. c Volcano plot of the lipidomic analysis of PANC-1 cells upon culturing at 38 °C compared to 37 °C for 10 days (n = 5 different wells in a single experiment, one representative experiment of 3 independent experiments is shown). Two-tailed Student’s t-tests with Benjamini–Hochber’s multiple comparisons test. d PUFA PC plasmalogen content in available tissue from human PDAC and adjacent pancreas (n = 6 patients). Paired two-sided Student’s t-test. e Total abundance of PUFA containing ether lipid species (PC-O: 1-alkyl,2-acylphosphatidylcholine; PC-P: 1-alkenyl,2-acylphosphatidylcholine; PE-O: 1-alkyl,2-acylphosphatidylethanolamine; PE-P: 1-alkenyl,2-acylphosphatidylethanolamine) in PANC-1 (n = 5 different wells, one representative experiment of 3 independent experiments is shown) or BxPC3 (n = 4 different wells, one representative experiment of 2 independent experiments is shown) cells cultured at 37 °C or 38 °C for 10 days. Unpaired two-sided Student’s t-test. f Downregulated lipid ontology terms upon culturing PANC-1 cells (n = 5 different wells) at 38 °C compared to 37 °C, as calculated by Lipid Ontology (LION) enrichment analysis web application. g Time-course confluence of PANC-1 or BxPC3 cells treated with RSL3, cultured at 37 °C or 38 °C (n = 3 different wells, one representative experiment of 3 independent experiments is shown). h Proliferation as measured by BrdU incorporation of PANC-1 or BxPC3 cells treated with RSL3 for 10 days, cultured at 37 °C or 38 °C (n = 3 different wells). One-way ANOVA with Šídák’s multiple comparisons test. i Lipid peroxidation of PANC-1 cells or BxPC3 cells (n = 3 different wells, one representative experiment of 2 independent experiments is shown) upon culturing at 38 °C for 10 days and treated with RSL3 or PUFA ePLs, normalized to control. One-way ANOVA with Šídák’s multiple comparisons test. j Relative confluence of PANC-1 (n = 4 different wells, one representative experiment of 2 independent experiments is shown) or BxPC3 cells (n = 3 different wells, one representative experiment of 2 independent experiments is shown) upon culturing at 38 °C for 10 days and treated with RSL3 or PUFA ePLs, normalized to control. One-way ANOVA with Šídák’s multiple comparisons test. Error bars represent s.e.m. from mean. Source data are provided as a Source Data file.
Fig. 2
Fig. 2. Gemcitabine induces ferroptosis and ferroptosis evasion confers gemcitabine resistance.
a Overall survival of patients with PDAC with either high (n = 75 patients, Ferroptosis Low) or low (n = 75 patients, Ferroptosis High) expression of ferroptosis suppressor genes as determined by gene-expression signature (gene list provided in Supplementary Data 3). Log-rank (Mantel–Cox) test. b Relative apoptosis and lipid peroxidation of PANC-1 cells (n = 3 different wells; n = 4 different wells, respectively, one representative experiment of 2 independent experiments is shown) or BxPC3 cells (n = 6 different wells; n = 5 different wells) treated with gemcitabine (GEM) compared to vehicle. c Representative image of gemcitabine-induced apoptosis and lipid ROS after 100 h and 240 h in PANC-1 cells. d Expression of ferroptosis-related genes as measured by RNA-Seq in BxPC3 cells treated for 240 h with vehicle or gemcitabine (n = 4 different wells). e Representative phase contrast image showing PANC-1 cells treated with gemcitabine undergoing cell death. f Oxidized lipid species in PANC-1 cells treated for 240 h with vehicle or gemcitabine (n = 4 different wells). Unpaired two-sided Student’s t-test with Holm–Šídák’s multiple comparisons test. g Time-course confluence of PANC-1 (n = 6 different wells, one representative experiment of 3 independent experiments is shown) or BxPC3 (n = 8; n = 4; n = 2 different wells, respectively, one representative experiment of 3 independent experiments is shown) cells treated with GEM, supplemented with ZVAD or Ferrostatin-1. h MDA abundance in harvested PANC-1 xenografts (n = 5 mice) after one week of treatment with vehicle or gemcitabine (GEM), supplemented with UAMC-3203 or PUFA ePLs. One-way ANOVA with Šídák’s multiple comparisons test. i Survival of PANC-1 xenograft bearing NMRInu/nu mice treated with vehicle (n = 3 mice) or GEM (n = 8 mice), supplemented with the ferroptosis inhibitor UAMC-3203 (n = 10 mice) or PUFA ePLs (n = 10 mice). Log-rank (Mantel–Cox) test. j Tumor volumes of individual PANC-1 xenograft bearing NMRInu/nu mice (n = 10 mice) following treatment with gemcitabine (GEM), supplemented with UAMC-3203. k Tumor volumes of individual PANC-1 xenograft bearing NMRInu/nu nude mice following treatment with gemcitabine (GEM, n = 10 mice) supplemented with PUFA ePLs (n = 11 mice). Error bars represent s.e.m. from mean, but are not depicted when they are shorter than the symbol size. Source data are provided as a Source Data file.
Fig. 3
Fig. 3. Lipidomic adaptations to increased temperature drive gemcitabine resistance.
a Representative image of confluence at 0, 10 and 17 days of PANC-1 cells treated with gemcitabine (GEM), cultured at 37 °C or 38 °C. b Time-course confluence of PANC-1 (n = 4) or BxPC3 (n = 12; n = 6 different wells, respectively, one representative experiment of 5 independent experiments is shown) cells treated with vehicle or GEM, cultured at 37 °C or 38 °C. c Lipid peroxidation of PANC-1 or BxPC3 cells treated with GEM, supplemented with Ferrostatin-1 or cultured at 38 °C for 10 days (n = 3 different wells, one representative experiment of 2 independent experiments is shown). One-way ANOVA with Šídák’s multiple comparisons test. d Time-course confluence of PANC-1 or BxPC3 cells treated with GEM and Ferrostatin-1, cultured at 37 °C or 38 °C (n = 6 different wells, one representative experiment of 3 independent experiments is shown). e Relative confluence of PANC-1 (n = 12 different wells, one representative experiment of 2 independent experiments is shown) or BxPC3 (n = 6 different wells, one representative experiment of 2 independent experiments is shown) cells upon culturing at 38 °C for 400 h and treated with GEM, PUFA ePLs and Ferrostatin-1, normalized to control. One-way ANOVA with Šídák’s multiple comparisons test. Error bars represent s.e.m. from mean. Source data are provided as a Source Data file.
Fig. 4
Fig. 4. p38 deactivation confers gemcitabine resistance downstream of temperature-induced adaptations in lipid metabolism.
a Cell death of PANC-1 or BxPC3 cells treated with RSL3 and Doramapimod for 24 h (n = 4 different wells, one representative experiment of 2 independent experiments is shown). One-way ANOVA with Šídák’s multiple comparisons test. b p-p38 expression in wild-type or MAPK14 KO PANC-1 and BxPC3 cells. c Cell death of wild-type or MAPK14 KO PANC-1 (n = 4 different wells, one representative experiment of 2 independent experiments is shown) and BxPC3 (n = 3; n = 6 different wells, respectively) cells treated with vehicle or RSL3 for 24 h. One-way ANOVA with Šídák’s multiple comparisons test. d Overall survival of patients with PDAC with either high (n = 47 patients) or low (n = 48 patients) p-p38 expression. Log-rank (Mantel–Cox) test. e Representative image of IHC staining for p-p38 in human PDAC (f) p38 activation status in patients with PDAC with either high (n = 55 patients, Ferroptosis Low) or low (n = 53 patients, Ferroptosis High) expression of ferroptosis suppressor genes. Unpaired two-sided Student’s t-test. g Expression of p38 MAPK-related genes as measured by RNA-Seq in BxPC3 cells treated for 240 h with vehicle or gemcitabine (n = 4 different wells). h Protein expression of p-p38 and p38 in PANC-1 cells treated with vehicle or GEM, cultured at 37 °C or 38 °C for 10 days. i Time-course confluence of PANC-1 (n = 4 different wells, one representative experiment of 3 independent experiments is shown) or BxPC3 (n = 6; n = 3; n = 6 different wells, respectively, one representative experiment of 3 independent experiments is shown) cells treated with GEM and supplemented with SB203580 or cultured at 38 °C. j Time-course confluence of wild-type or MAPK14 KO PANC-1 (n = 6 different wells, one representative experiment of 2 independent experiments is shown) or BxPC3 (n = 6; n = 12 different wells, respectively, one representative experiment of 2 independent experiments is shown) cells treated with vehicle or GEM. k Relative confluence of PANC-1 cells treated with GEM and supplemented with Doramapimod and ePLs or cultured at 38 °C for 400 h (n = 12 different wells, one representative experiment of 2 independent experiments is shown). One-way ANOVA with Šídák’s multiple comparisons test. l Time-course confluence of BxPC3 cells treated with GEM and supplemented with Doramapimod and ePLs or cultured at 38 °C (n = 6 different wells, one representative experiment of 2 independent experiments is shown). m Survival of PANC-1 xenograft bearing NMRInu/nu mice treated with vehicle (n = 3 mice) or GEM (n = 8 mice), supplemented with the p38 inhibitor SB203580 (n = 9 mice). Log-rank (Mantel–Cox) test. n Tumor volumes of individual PANC-1 xenograft bearing NMRInu/nu mice following treatment with gemcitabine (GEM, n = 10 mice) supplemented with SB203580 (n = 10 mice). Error bars represent s.e.m. from mean. Source data are provided as a Source Data file.

References

    1. Hanahan, D. & Weinberg, R. A. Hallmarks of cancer: the next generation. Cell144, 646–674 (2011). - PubMed
    1. Gautherie, M. Thermopathology of breast cancer: measurement and analysis of in vivo temperature and blood flow. Ann. N. Y. Acad. Sci.335, 383–415 (1980). - PubMed
    1. Stefanadis, C. et al. Temperature differences are associated with malignancy on lung lesions: a clinical study. BMC Cancer3, 1 (2003). - PMC - PubMed
    1. Shada, A. L. et al. Infrared thermography of cutaneous melanoma metastases. J. Surg. Res.182, e9–e14 (2013). - PMC - PubMed
    1. Bousselham, A., Bouattane, O., Youssfi, M. & Raihani, A. Brain tumor temperature effect extraction from MRI imaging using bioheat equation. Proc. Comput. Sci.127, 336–343 (2018).

Publication types

MeSH terms

Associated data