. 2024 Oct 2;15(1):8523.
doi: 10.1038/s41467-024-52778-5.

Minimal exposure durations reveal visual processing priorities for different stimulus attributes

Affiliations

Minimal exposure durations reveal visual processing priorities for different stimulus attributes

Renzo C Lanfranco et al. Nat Commun. .

Abstract

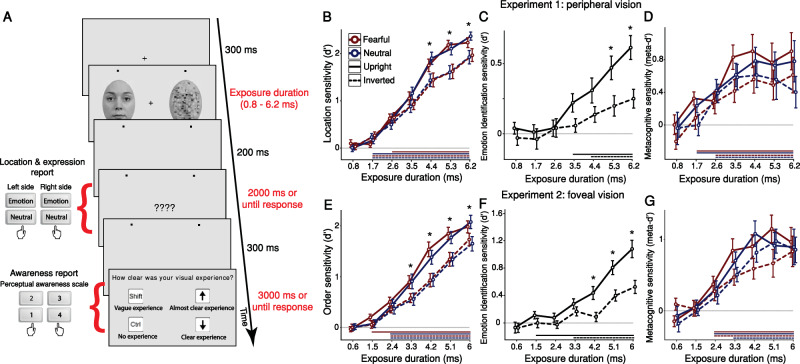
Human vision can detect a single photon, but the minimal exposure required to extract meaning from stimulation remains unknown. This requirement cannot be characterised by stimulus energy, because the system is differentially sensitive to attributes defined by configuration rather than physical amplitude. Determining minimal exposure durations required for processing various stimulus attributes can thus reveal the system's priorities. Using a tachistoscope enabling arbitrarily brief displays, we establish minimal durations for processing human faces, a stimulus category whose perception is associated with several well-characterised behavioural and neural markers. Neural and psychophysical measures show a sequence of distinct minimal exposures for stimulation detection, object-level detection, face-specific processing, and emotion-specific processing. Resolving ongoing debates, face orientation affects minimal exposure but emotional expression does not. Awareness emerges with detection, showing no evidence of subliminal perception. These findings inform theories of visual processing and awareness, elucidating the information to which the visual system is attuned.


Conflict of interest statement

The authors declare no competing interests.

Figures

Fig. 1
Fig. 1. Schematic trial procedure and psychophysical measures of location, emotion identification, and metacognitive sensitivity.
A Experiment 1: An intact and scrambled face were presented for one of seven possible exposure durations (range 0.8–6.2 ms). Participants pressed one key to report both the location (left or right) and expression (emotional or neutral) of the intact face. Next, they reported the clarity of their visual experience. All face stimuli, including the example of an intact face shown here, were taken from the Radboud Face Database (RaFD, see https://rafd.socsci.ru.nl/). B–D Findings of Experiment 1 (peripheral vision). B Location sensitivity: Two-tailed one-sample t-tests against zero (uncorrected) found that location sensitivity departed from chance-level around 2 ms (all t > 2.469, all p < 0.003). A three-way repeated-measures ANOVA (with the factors exposure duration, face orientation, and facial expression) found main effects of exposure duration (F(1.99, 61.97) =215.135, p < 0.001, ηp2 = 0.874), confirming that sensitivity increased with duration, and face orientation (F(1, 31) = 34.918, p < 0.001, ηp2 = 0.53), confirming an upright face advantage (face-inversion effect, FIE). Bonferroni-corrected post hoc tests revealed a significant FIE from 4.4 ms of exposure (t31=5.68,p<0.001,d=0.671,CI=0.1250.65). There was no main effect of facial expression (F(1, 31) = 3.633, p = 0.066, ηp2 = 0.105;BF01 = 10.571). C Emotion identification sensitivity: A two-way repeated-measures ANOVA (with the factors exposure duration and face orientation) found main effects of exposure duration (F(4.2, 130.9) = 12.89, p < 0.001, ηp2 = 0.294) and face orientation (F(1, 31) = 19.54, p < 0.001, ηp2 = 0.387); Bonferroni-corrected post-hoc tests revealed a significant FIE from 5.3 ms of exposure (t31=3.563,p=0.041,d=0.758,CI=0.0040.54). D Metacognitive sensitivity: A three-way repeated-measures ANOVA (with the factors exposure duration, face orientation, and facial expression) found main effects of exposure duration (F(3.7, 114.4) = 12.922, p < 0.001, ηp2 = 0.294) and face orientation (F(1, 31) = 6.475, p = 0.016,ηp2 = 0.173), suggesting that upright faces required briefer exposures to reach awareness. EF Findings of Experiment 2 (Foveal vision). E Order sensitivity: Two-tailed one-sample t-tests against zero (uncorrected) found that location sensitivity departed from chance-level around 2 ms (all t > 3.72, all p < 0.0005). A three-way repeated-measures ANOVA (with the factors exposure duration, face orientation, and facial expression) found main effects of exposure duration (F(2.23, 69.02) = 180.786, p < 0.001, ηp2 = 0.854) and face orientation (F(1, 31) = 49.058, p < 0.001, ηp2 = 0.613). Bonferroni-corrected post hoc tests revealed a significant upright-face (FIE) advantage from 3.3 ms of exposure t31=4.737,p<0.001,d=0.584,CI=0.0860.578. There was no main effect of facial expression (F(1, 31) = 0.761, p = 0.39, ηp2 = 0.024; BF01 = 11.891). F Emotion identification sensitivity: A two-way repeated-measures ANOVA (with the factors exposure duration and face orientation) found main effects of exposure duration (F(3.36,104.12)=36.20,p<0.001,ηp2=0.539) and face orientation (F(1,31)=27.867,p<0.001,ηp2=0.473); Bonferroni-corrected post-hoc tests revealed a significant FIE from 4.2 ms of exposure t31=3.967,p=0.009,d=0.843,CI=0.040.657. G Metacognitive sensitivity: A three-way repeated-measures ANOVA (with the factors exposure duration, face orientation, and facial expression) found a main effect of face orientation F(1,31)=6.176,p=0.019,ηp2=0.166, suggesting that upright faces required briefer exposures to reach awareness. Overall, Experiment 1 and Experiment 2 had very similar results. Horizontal lines below the x-axis of Panels (BG) indicate exposure durations with above-chance sensitivity (p < 0.05, one-sample t-test against zero, which is represented by a horizontal grey line). Data are presented as mean values with ±1 SEM bars; n = 32 independent participants per experiment. * p < 0.05 for upright-inverted comparisons. Source data are provided as a Source Data file.
Fig. 2
Fig. 2. Psychophysical measures of location detection and emotion identification in single-stimulus processing.
AB Findings of Experiment 3. A Location sensitivity: Two-tailed one-sample t-tests against zero (uncorrected) found that location sensitivity departed from chance at 0.417 ms (all t > 1.92, all p < 0.032). A three-way repeated-measures ANOVA (with the factors exposure duration, face orientation, and facial expression) found a main effect of exposure duration (Fig. 2A;F(6,186) = 300.8, p < 0.001, ηp2 = 0.907), confirming that sensitivity increased with duration, and a small but significant main effect of face orientation (F(1,31)=4.69,p=0.038,ηp2=0.131)—an upright-face advantage (FIE). There was no main effect of facial expression (F(1,31)=2.031,p=0.164,ηp2=0.061). B Emotion identification sensitivity: Two-tailed one-sample t-tests against zero (uncorrected) revealed that identification sensitivity never departed from chance (all t < 0.781, p > 0.22). A two-way repeated-measures ANOVA did not find main effects of exposure duration F(6, 186)=0.876,p=0.5134,ηp2=0.027 or face orientation (F(1,31)=1.324,p=0.259,ηp2=0.041). CD Findings of Experiment 4. C Location sensitivity: Two-tailed one-sample t-tests against zero (uncorrected) showed that location sensitivity was above chance at all durations (all t > 6.84, all p < 0.001), reaching ceiling from 1.7 ms of exposure. A three-way repeated-measures ANOVA (with the factors exposure duration, face orientation, and facial expression) showed only a main effect of exposure duration (F(1.276,39.557)=143.034,p<0.001,ηp2=0.822). D Emotion identification sensitivity: A two-way repeated-measures ANOVA showed main effects of exposure duration (F(3.89,120.665)=17.589,p<0.001,ηp2=0.362) and face orientation (F(1,31)=15.993,p<0.001,ηp2=0.34). Bonferroni-corrected post hoc tests revealed a FIE arising from 5.3 ms of exposure t31=4.014,p=0.008,d=0.972,CI=0.0510.766. These results closely replicated the identification sensitivity results of Experiment 1. Horizontal lines below the x-axes represent above-chance sensitivity (p < 0.05, one-sample t-test against zero, which is represented by a horizontal grey line). Data are presented as mean values with ±1 SEM bars; n = 32 independent participants per experiment. * p < 0.05 for upright-inverted comparisons. Source data are provided as a Source Data file.
Fig. 3
Fig. 3. Experiment 5: Neural measures of emotion processing.
AC EPN marker of emotion-processing across exposure durations. A three-way repeated-measures ANOVA (with the factors exposure duration, facial expression, and brain hemisphere) found an interaction between facial expression and exposure duration (F(2,62)=8.675,p<0.001,ηp2=0.219). Bonferroni-corrected post-hoc tests revealed that the evoked response to emotional expressions was significantly more negative than to neutral expressions, indicating emotion-specific processing, only at 6.2 ms of exposure (t31=4.009,p=0.002,d=0.162,CI=0.7910.112). DF LPP marker of emotion-processing across exposure durations. A two-way repeated measures ANOVA (with the factors exposure duration and facial expression) found an interaction between facial expression and exposure duration (F(1.98,61.4)=9.804,p<0.001,ηp2=0.24). Bonferroni-corrected post-hoc tests revealed that the evoked response to emotional expressions was significantly more positive than to neutral expressions, indicating emotion-specific processing, only at 6.2 ms of exposure (t31=4.284,p<0.001,d=0.142,CI=0.1030.592). Topographic maps represent emotional—neutral voltage subtraction in Z-scores. Source estimation of the ERPs at their peaks are shown on cortical maps. Time in all x-axes is from stimulus onset. Data are presented as mean values with ±1 SEM bars; n = 32 independent participants. * p < 0.05 for emotion-neutral comparisons. Source data are provided as a Source Data file.
Fig. 4
Fig. 4. Experiment 5: MVPA decoding of face location and emotional expression.
AG MVPA of intact-face location. AC Classifier performance (in units of area under curve, AUC) shows that the location of intact faces was decoded significantly above chance only at 4.4 and 6.2 ms of exposure. Classification accuracy was calculated by comparing participants’ AUC scores against 0.5 (chance performance) through t-tests using cluster-based permutation testing. Bold segments represent significant clusters (p < 0.05, cluster-corrected). DF Temporal generalisation analysis. The Y-axis depicts training time points, and the X-axis depicts testing time points, relative to stimulus presentation (time zero). AUC scores revealed broad temporal generalisation of the decoded multivariate patterns at 4.4 and 6.2 ms of exposure. GI AUC difference between pairs of expressions. No paired comparison revealed significant clusters, suggesting that no emotional expression enjoyed above-chance classification at any exposure duration. J Multiclass MVPA decoding of expression showed limited success for 4.4 ms and robust classification for 6.2 ms exposure. Bold segments represent significant clusters (p < 0.05, cluster-corrected). K Temporal generalisation shows cortical signal stability across time. Solid bold lines at the bottom of the charts represent the times of significant clusters (p < 0.05, cluster-corrected) and shaded contours represent ±1 SEM; n = 32 independent participants. Source data are provided as a Source Data file.
Fig. 5
Fig. 5. Experiment 5: Neural measures of awareness.
AB VAN marker of awareness across exposure durations. A four-way repeated-measures ANOVA (with the factors exposure duration, awareness report, facial expression, and brain hemisphere) found an interaction between awareness report and exposure duration (F(1,30)=10.062,p=0.003,ηp2=0.251). Bonferroni-corrected post-hoc tests revealed that the evoked response in awareness-present trials was significantly more negative than in awareness-absent trials only at 4.4 ms of exposure (t45.4=5.205,p<0.001,d=0.327,CI:1.6320.501). CD LP marker of awareness across exposure durations. A three-way repeated-measures ANOVA (with the factors exposure duration, awareness report, and facial expression) found an interaction between awareness report and exposure duration (F(1,30)=37.420,p<0.001,ηp2=0.555). Bonferroni-corrected post-hoc tests revealed that the evoked response in awareness-present trials was significantly more positive than in awareness-absent trials only at 4.4 ms of exposure (t55=5.861,p<0.001,d=0.56,CI:0.6221.713). Time in all x-axes is from stimulus onset. Shaded contours represent ±1 SEM. * p < 0.05 for aware-unaware comparisons; n = 31 independent participants. Source data are provided as a Source Data file.
Fig. 6
Fig. 6. Experiment 6: Neural measures of face vs. object processing.
AD Findings for each of the four durations. A three-way repeated-measures ANOVA (with the factors exposure duration, facial expression, and electrode) found an interaction between stimulus category and exposure duration (F(2.45,75.89)=6.398,p=0.001,ηp2=0.171). Bonferroni-corrected post-hoc tests revealed that the evoked response to face stimuli was significantly more negative than to object stimuli only at 4288 ms of exposure (t31=3.467,p=0.021,d=0.134,CI:0.6680.027). Topographic maps represent face—object voltage subtraction in Z-scores. Source estimation of the ERPs at their peaks are shown on cortical maps. Time in all x-axes is from stimulus onset. Shaded contours represent ±1 SEM. * p < 0.05 for face-object comparisons; n = 32 independent participants. Source data are provided as a Source Data file.

References

    1. Hecht, S., Shlaer, S. & Pirenne, M. H. Energy at the threshold of vision. Science93, 585–587 (1941). - PubMed
    1. Tinsley, J. N. et al. Direct detection of a single photon by humans. Nat. Commun.7, 12172 (2016). - PMC - PubMed
    1. Fabre-Thorpe, M., Delorme, A., Marlot, C. & Thorpe, S. A limit to the speed of processing in ultra-rapid visual categorization of novel natural scenes. J. Cogn. Neurosci.13, 171–180 (2001). - PubMed
    1. Thorpe, S., Fize, D. & Marlot, C. Speed of processing in the human visual system. Nature381, 520–522 (1996). - PubMed
    1. Chuyin, Z., Koh, Z. H., Gallagher, R., Nishimoto, S. & Tsuchiya, N. What can we experience and report on a rapidly presented image? Intersubjective measures of specificity of freely reported contents of consciousness [version 3; peer review: 2 approved]. F1000Res. 11, 69 (2022). - PMC - PubMed

Publication types

LinkOut - more resources