. 2024 Oct 2;15(1):8533.
doi: 10.1038/s41467-024-52917-y.

Transcription factor PATZ1 promotes adipogenesis by controlling promoter regulatory loci of adipogenic factors

Affiliations

Transcription factor PATZ1 promotes adipogenesis by controlling promoter regulatory loci of adipogenic factors

Sanil Patel et al. Nat Commun. .

Abstract

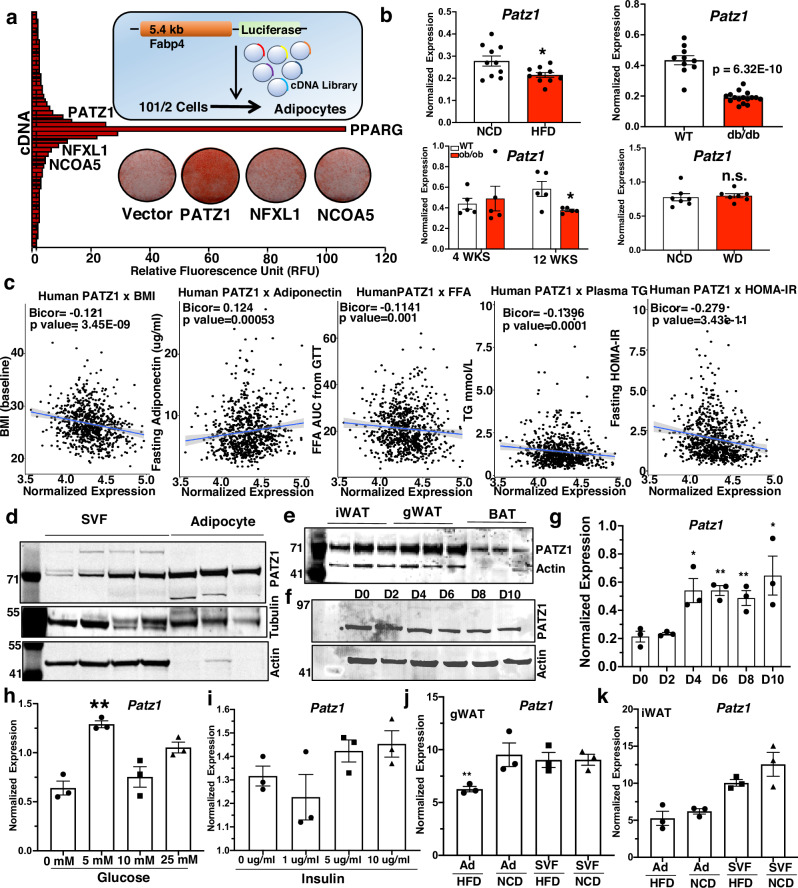
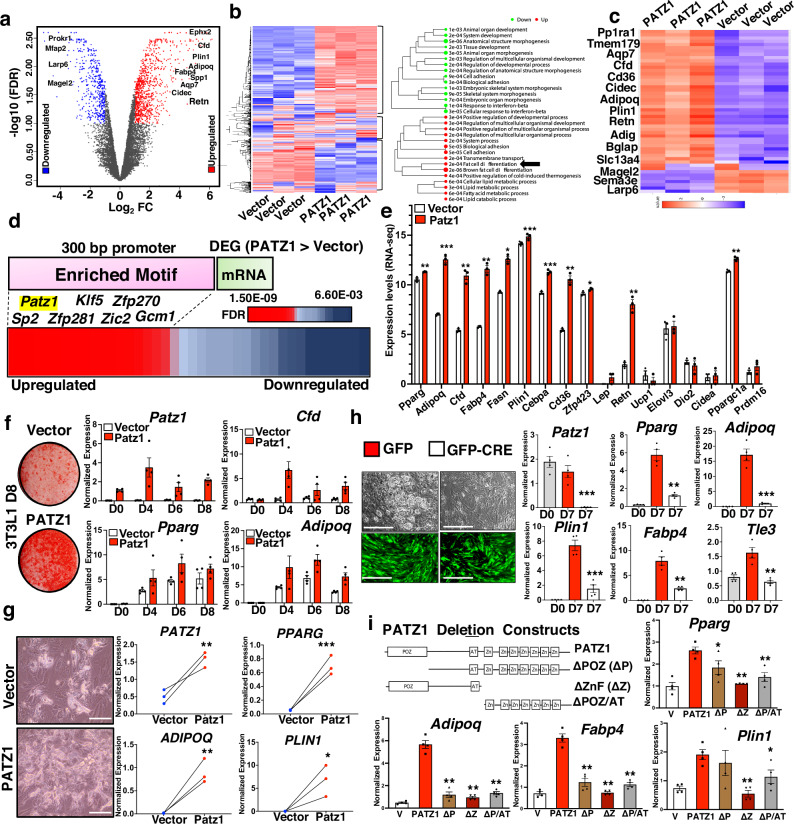
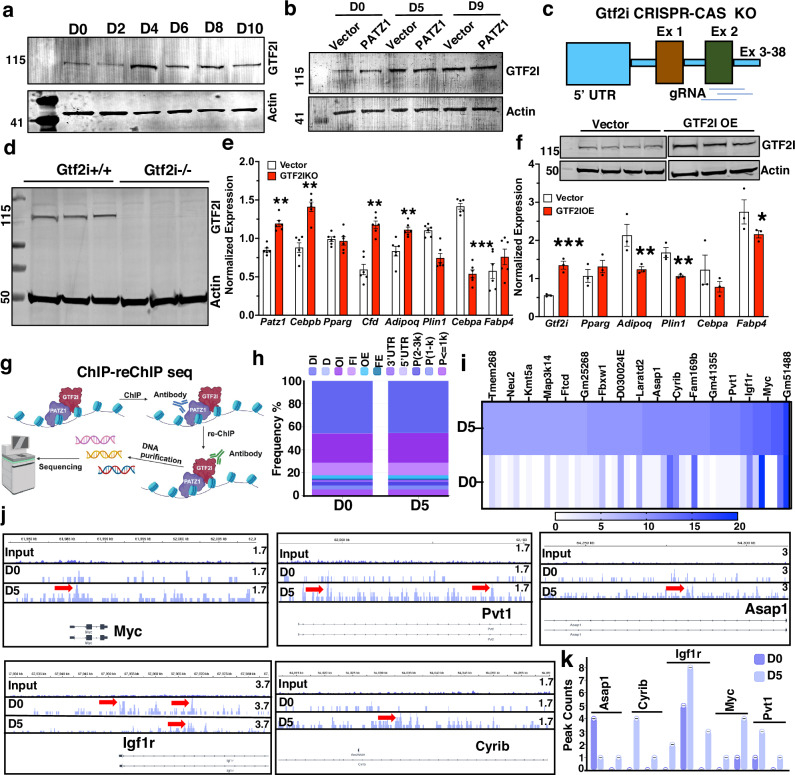
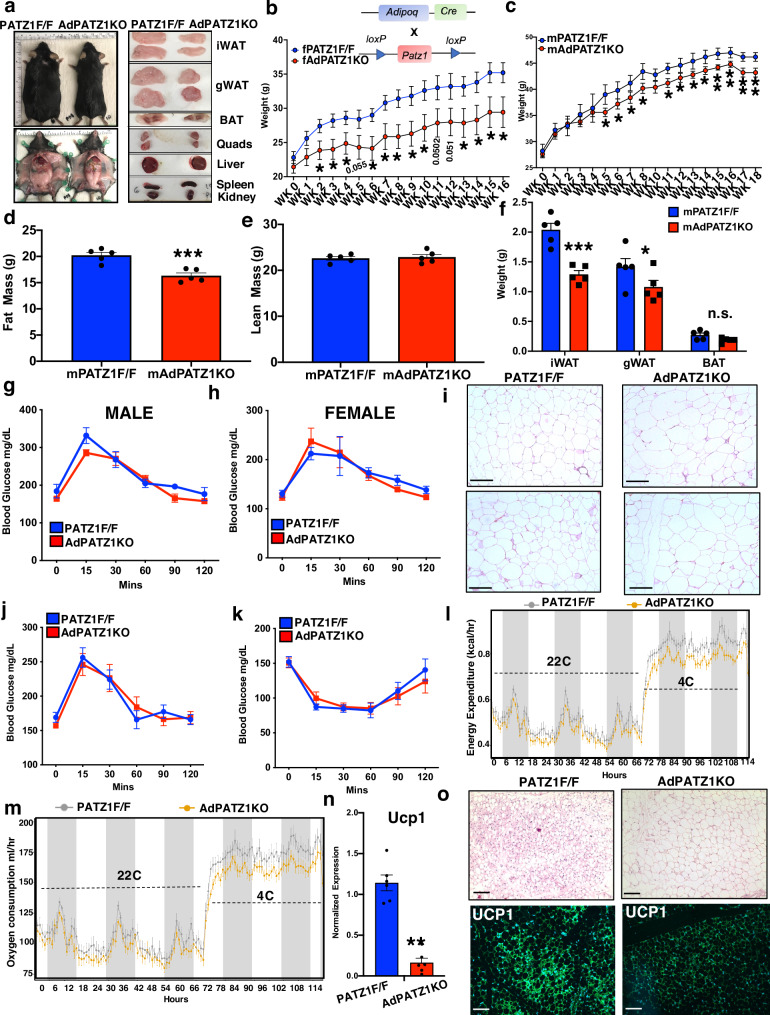
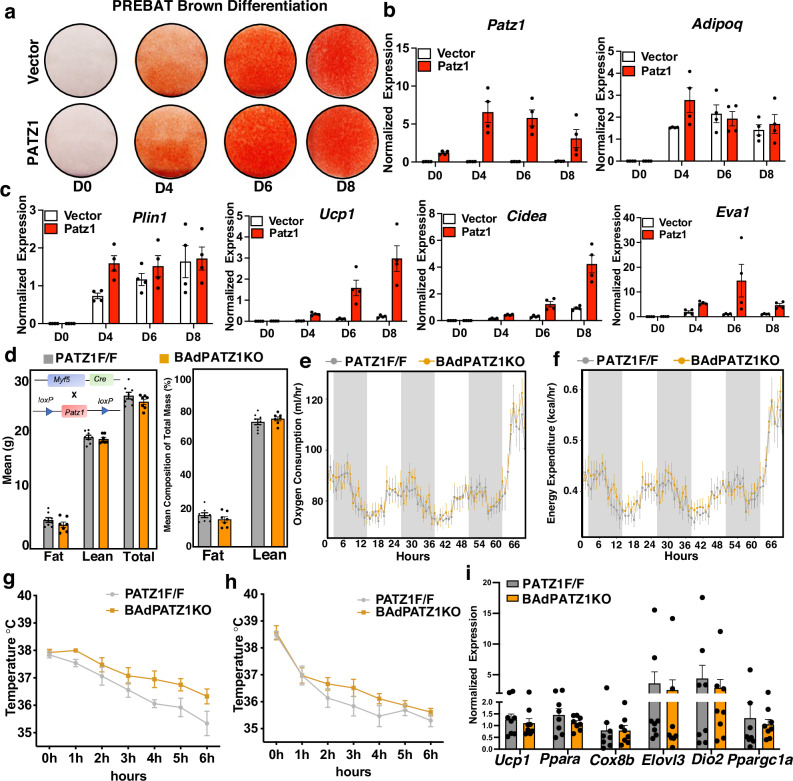
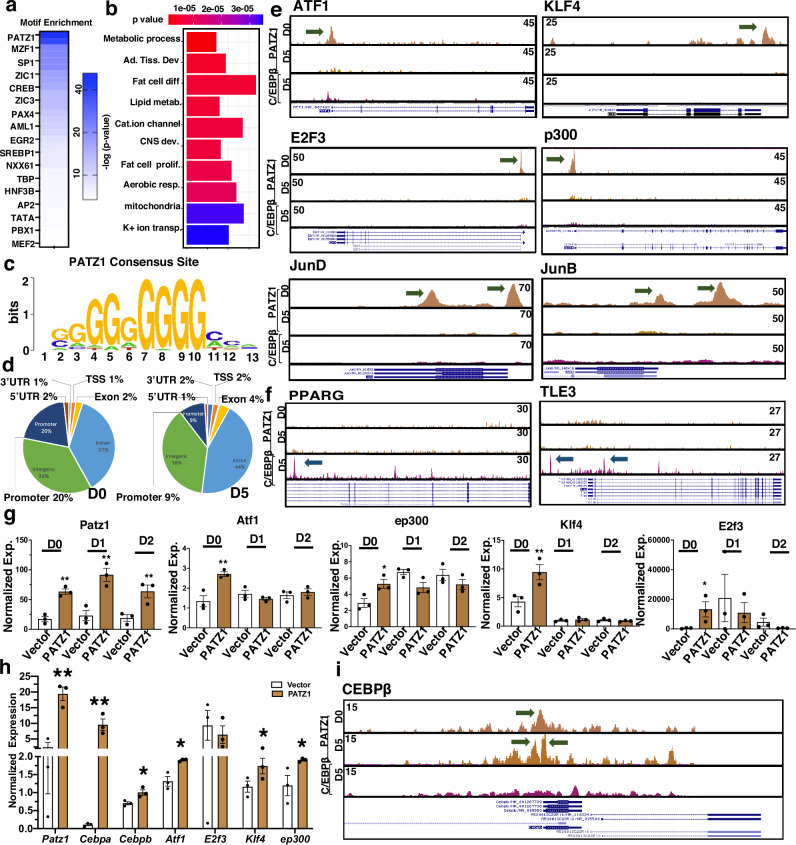
White adipose tissue (WAT) is essential for lipid storage and systemic energy homeostasis. Understanding adipocyte formation and stability is key to developing therapies for obesity and metabolic disorders. Through a high-throughput cDNA screen, we identified PATZ1, a POZ/BTB and AT-Hook Containing Zinc Finger 1 protein, as an important adipogenic transcription factor. PATZ1 is expressed in human and mouse adipocyte precursor cells (APCs) and adipocytes. In cellular models, PATZ1 promotes adipogenesis via protein-protein interactions and DNA binding. PATZ1 ablation in mouse adipocytes and APCs leads to a reduced APC pool, decreased fat mass, and hypertrophied adipocytes. ChIP-Seq and RNA-seq analyses show that PATZ1 supports adipogenesis by interacting with transcriptional machinery at the promoter regions of key early adipogenic factors. Mass-spec results show that PATZ1 associates with GTF2I, with GTF2I modulating PATZ1's function during differentiation. These findings underscore PATZ1's regulatory role in adipocyte differentiation and adiposity, offering insights into adipose tissue development.


Conflict of interest statement

The authors declare no competing interests.

Figures

Fig. 1
Fig. 1. Identification of PATZ1 as an adipogenic factor.
a Diagram of the cDNA library screen, the plot of relative fluorescence unit (RFU), and top hits of cDNA, including PATZ1, NFXL1, and NCOA5. Oil-red-O staining of D6 differentiated 10T1/2 cells expressing Vector, PATZ1, NFXL1, and NCOA5. b Real-time qPCR analysis of Patz1 in mice fed a normal chow diet (NCD) (n = 10) and HFD for 12 weeks (n = 10), WT (n = 10) and 10- week-old db/db (n = 16), 4 weeks (n = 5)- or 12-week-old (n = 5) ob/ob mice, or mice fed NCD (n = 7) mice fed western diet (WD) (n = 7) for 10 weeks. c Correlation of human WAT PATZ1 levels with indicated traits from the METSIM study. Correlations were assessed from the midweight bicorrelation coefficient and corrected p value using the R package WGCNA. d Western blot showing PATZ1 levels in SVF and adipocyte fraction from iWATs of 10-week-old chow-fed mice. Tubulin, Actin, and ponceau stain were used as loading controls. Blots from three biological replicates. e Western blot showing PATZ1 protein levels in mouse iWAT, gWAT, and BAT. Actin was used as a loading control. Blots from three biological replicates. f Western blot showing PATZ1 levels in differentiated 10T1/2 cells for indicated times. HMGB1 was used as a loading control. Representative blot from two independent experiments. g qPCR showing PATZ1 levels in differentiated 10T1/2 cells for indicated times without rosiglitazone. n = 3 per timepoint. h, i Real-time qPCR showing PATZ1 levels in 24 h glucose (H) or insulin (I) treated 10T1/2 cells. n = 3 per glucose or insulin concentration. j, k qPCR showing PATZ1 levels in gWAT ( J) or iWAT (K) SVF or adipocytes (Ad) from HFD or NCD fed 10-week-old mice. n = 3 per condition. gk Results are from three independent experiments. b, gk, Unpaired Student’s t-test. Data were mean ± s.e.m. *p < 0.05; **p < 0.01, n.s. not significant. b comparing HFD to NCD, db/db to WT, 12 weeks ob/ob to WT, WD to NCD. g comparing to D0. h Comparing to 0 mM. i Comparing to 0 ug/ml. j comparing Ad HFD to Ad NCD. df Loading controls were run on the same blot. Source data are provided as a Source Data file.
Fig. 2
Fig. 2. PATZ1 promotes adipocyte differentiation in vitro.
a Volcano plot of gene expression differences between PATZ1 and Vector cells. The log2FC of PATZ1/Vector was plotted as a function of −log10 (FDR) with selected genes indicated as upregulated in PATZ1 cells. b Heatmap showing upregulated, downregulated, and similarly expressed genes in Vector and PATZ1 cells (Left) and GO analysis of top genes upregulated and downregulated in PATZ1 cells (Right). Black arrows indicate “Fat cell differentiation”. c Heatmap showing top binned genes that are upregulated and downregulated in PATZ1 and Vector cells. d TF motif analysis 300 bp upstream of DEGs that are greater in PATZ1 cells. e Expression values of indicated genes represented as average FPKM values from PATZ1 or Vector cells. Vector: n = 3 and PATZ1: n = 3. f Oil-Red-O staining (Left) and qPCR analysis of indicated genes from control and PATZ1-overexpressing differentiated 3T3-L1 cells (Right). Vector: n = 4 and PATZ1: n = 4. Representative oil-Red-O staining from three independent experiments. g Bright-field microscopy (Left) and qPCR analysis (Right) of indicated genes from control and PATZ1 overexpressing human abdominal subcutaneous hADSCs differentiated for 12 days. Vector: n = 3 and PATZ1: n = 3. Representative microscopy images from three biological replicates. Scale bars, 100 μm. h (Right) Bright-field (top) and fluorescence at 509 nm (bottom) microscopy showing lipid droplets (top) and GFP fluorescence (bottom) in 7 days differentiated SVFs derived from PATZ1F/F mice infected with adenovirus (Adeno) expressing GFP or GFP-Cre and (Left) qPCR showing mRNA levels of indicated genes from PATZ1 F/F SVFs at D0 or D7 infected with Adeno GFP or Adeno GFP-Cre. GFP levels (bottom panel) show comparable viral infection. D0: n = 4, GFP: n = 4, and GFP-Cre: n = 4. Scale bars, 100 μm. i Domain structure of PATZ1 constructs with indicated deletion and qPCR showing indicated mRNA levels in D4 differentiated 3T3-L1 cells expressing indicated PATZ1 constructs. n = 4 per condition. e, g Results are from three independent experiments. e, g, h, i Unpaired Student’s t-test. Data were mean ± s.e.m. ***p < 0.001; **p < 0.01; *p < 0.05. e, g comparing PATZ1 to Vector; h comparing GFP-Cre to GFP; i all comparisons were made to PATZ1. Source data are provided as a Source Data file.
Fig. 3
Fig. 3. PATZ1 binding partner GTF2I regulates adipocyte differentiation.
a Immunoblot analysis of GTF2I protein during differentiation of 10T1/2. Actin was used as a loading control. Representative blot from three independent experiments. b Immunoblot analysis of GTF2I protein during differentiation of 10T1/2 expressing Vector, PATZ1, or PATZ1 transduced with GTF2I siRNA. Actin was used as a loading control. Representative blot from two independent experiments. c, d Model showing gRNA designed target Gtf2i exon 2 (c) and immunoblot analysis of GTF2I in WT (Gtf2i+/+) or GTF2I knockout (Gtf2i−/−) 10T1/2 cells (d). Representative blot from two independent experiments. e Realtime qPCR of indicated genes from D5 differentiated 10T1/2 vector or GTF2IKO cells. Vector: n = 3 and GTF2IKO: n = 3. f Realtime qPCR of indicated genes from D5 differentiated 10T1/2 vector or GTF2I overexpression (GTF2IOE) cells. The inset shows an immunoblot of GTF2I in Vector or GTF2IOE cells. Actin was used as a loading control. Representative blot from two independent experiments. Vector: n = 3 and GTF2IOE: n = 3. g Cartoon representation of the ChIP-reChIP sequencing experiment. h Functional annotation of peaks from D0 and D5 samples. DI distal intergenic, D downstream, OI other intron, FI first intron, OE other exon, FE first exon, UTR untranslated region, P promoter. i Heatmap showing annotated peaks regions on D0 and D5. j Bedgraph images of peaks on Input, D0, and D5 samples. Red arrows indicated significant “called” peaks. k Bar graphs showing consensus peak counts on the promoter and intronic regions of indicated gene locus on D0 and D5. n = 1 per timepoint. e, f Results are from three independent experiments. e, f Unpaired Student’s t-test. Data were mean ± s.e.m. ***p < 0.001; **p < 0.01; *p < 0.05. e, f Comparing to Vector. g Created in BioRender. Rajbhandari, P. (2020) BioRender.com/n87p485. Source data are provided as a Source Data file.
Fig. 4
Fig. 4. PATZ1 ablation in adipocytes protects mice from diet-induced obesity and reduced cold-induced beiging.
a (Left) External appearance of representative fPATZ1F/F and AdPATZ1KO mice after 16 weeks on HFD and (Right) gross appearance of tissues from PATZ1F/F and AdPATZ1KO mice after 16 weeks on HFD. b Body weight of fAdPATZ1KO and fPATZ1F/F female mice fed HFD for indicated weeks. fAdPATZ1KO: n = 7 and fPATZ1F/F: n = 5. c Body weight of mAdPATZ1KO and mPATZ1F/F male mice fed HFD for indicated weeks. mAdPATZ1KO: n = 5 and mPATZ1F/F: n = 5. d, e Body fat (D) and lean mass (E) in male PATZ1F/F and AdPATZ1KO mice after 18 weeks on HFD determined by EchoMRI. N = 5,5. f Average weight of individual white and brown adipose fat pads from male PATZ1F/F and AdPATZ1KO mice after 18 weeks on HFD. mAdPATZ1KO: n = 5 and mPATZ1F/F: n = 5. g, h GTT of male (g) and female (h) AdPATZ1KO and PATZ1F/F after 8 weeks of HFD. male AdPATZ1KO: n = 5, male PATZ1F/F: n = 5 and female AdPATZ1KO: n = 7, female PATZ1F/F: n = 5. i H&E staining of iWATs of 16 weeks HFD-fed AdPATZ1KO and PATZ1F/F mice. Scale bars, 100 μm. j, k GTT ( j) and ITT (k) of chow-fed 11-week-old AdPATZ1KO and PATZ1F/F mice. AdPATZ1KO: n = 9 and PATZ1F/F: n = 7. l, m Energy Expenditure (kcal/hr) (l) and Oxygen consumption (ml/hr) (m) of chow-fed 11-week-old AdPATZ1KO and PATZ1F/F mice were analyzed by Sable Promethion System metabolic chambers. Twelve-hour light/dark cycles, 114-h total duration; each light/gray bar represents 12-h duration. 0–114 h duration was at 22 °C (0–66 h) and at 4 °C (66–114 h). AdPATZ1KO: n = 9 and PATZ1F/F: n = 7. n Realtime qPCR of iWAT Ucp1 from cold-exposed mice mentioned in (l, m). AdPATZ1KO: n = 6 and PATZ1F/F: n = 6. o H&E and UCP1 immunofluorescence analysis of iWATs from cold-exposed mice mentioned in l and m. Scale bars, 100 μm. bf, n Unpaired Student’s t-test. Data were mean ± s.e.m. ***p < 0.001; **p < 0.01; *p < 0.05; n.s. not significant. bf, n, comparing to PATZ1F/F. Source data are provided as a Source Data file.
Fig. 5
Fig. 5. PATZ1 deletion in BAT precursor does not affect BAT activity.
a Oil-Red-O staining of immortalized brown preadipocyte (PREBAT) cells stably expressing Vector or PATZ1, brown-differentiated for indicated days. b, c Real-time qPCR of indicated genes from Vector or PATZ1 overexpressing PREBAT cells brown differentiated for indicated days. Vector: n = 4 and Patz1: n = 4. d Body fat, lean mass, and total mass in female PATZ1F/F and BAdPATZ1KO mice at 24 weeks of age determined by EchoMRI. PATZ1F/F: n = 8 and BAdPATZ1F/F: n = 7. e, f Oxygen consumption (ml/hr) (H) and energy expenditure (kcal/hr) (I) of mice in (D) were analyzed by Sable Promethion System metabolic chambers. Twelve-hour light/dark cycles, 60-h total duration; each light/gray bar represents 12-h duration. 0–60 h duration was at 22 °C and the last 6 h was at 4 °C. PATZ1F/F: n = 8 and BAdPATZ1F/F: n = 7. g, h Rectal temperature of males (g) and females (h) PATZ1F/F and BAdPATZ1KO mice exposed to 4 °C for 6 h. Female PATZ1F/F: n = 5 and BAdPATZ1F/F: n = 4; male PATZ1F/F: n = 8 and BAdPATZ1F/F: n = 8. i Realtime qPCR of indicated genes from BAT derived from cold-exposed PATZ1F/F and BAdPATZ1KO mice. PATZ1F/F: n = 8 and BAdPATZ1F/F: n = 8. Data were mean ± s.e.m. Source data are provided as a Source Data file.
Fig. 6
Fig. 6. PATZ1 binds to the promoter regions during early adipocyte differentiation.
a Motif enrichment analysis from PATZ1 ChIP-seq. b Gene ontology derived from top PATZ1 peaks. c, d ChIP-seq data derived consensus binding site of PATZ1 (c) and global occupancies of PATZ1 from PATZ1 ChIP-seq in 10T1/2 cells differentiated for D0 and D5 (d). e, f Bedgraph image peaks from PATZ1 and C/EBPß ChIP-seq data showing PATZ1 and C/EBPß peaks at the promoter regions of indicated genes on D0 and D5 differentiated 10T1/2 cells. Green arrows show PATZ1 peaks. g Real-time qPCR of indicated genes from D0-D2 differentiated 10T1/2 cells expressing PATZ1 or vector. Vector: n = 3 and PATZ1: n = 3. h Real-time qPCR of indicated genes from undifferentiated 10T1/2 cells expressing PATZ1 or vector. Vector: n = 3 and PATZ1: n = 3. i Bedgraph image peaks from PATZ1 and C/EBPß ChIP-seq data showing PATZ1 and C/EBPß peaks at the promoter regions of Cebpb on D0 and D5 differentiated 10T1/2 cells. g, h Results from three independent replicates. g, h Unpaired Student’s t-test. Data were mean ± s.e.m. **p < 0.01; *p < 0.05. g, h comparing to Vector. Source data are provided as a Source Data file.
Fig. 7
Fig. 7. PATZ1 ablation from APCs decreased fat mass and adiposity.
a Real time qPCR of Patz1 in iWATs of 10-week-old pAdPATZ1KO and PATZ1F/F mice. pAdPATZ1KO: n = 7 and PATZ1F/F: n−7. bf Body weight (b), fat mass (c), gross appearance of iWAT and gWAT (d), lean mass (e), and iWAT and gWAT weights (f ) of 10-week-old pAdPATZ1KO and PATZ1F/F mice. pAdPATZ1KO: n = 5 and PATZ1F/F: n = 7. g H&E-stained histological slide from iWAT of 10-week-old pAdPATZ1KO and PATZ1F/F mice. Scale bars, 200 μm. h FACS analysis showing percentages of PDGFRα + cells from iWAT of 10-week-old pAdPATZ1KO and PATZ1F/F mice. i Real time qPCR of Patz1 in iWAT APCs of 10-week-old pAdPATZ1KO and PATZ1F/F mice. pAdPATZ1KO: n = 3 and PATZ1F/F: n = 3. j, k Energy expenditure (kcal/hr) ( j) and respiratory quotient ratio (k) of 20-week-old chow-fed pAdPATZ1KO and PATZ1F/F mice were analyzed by Sable Promethion System metabolic chambers. Twelve-hour light/dark cycles, 72-h total duration; each light/gray bar represents 12-h duration. 0–72 h duration was at 22 °C. pAdPATZ1KO: n = 10 and PATZ1F/F: n = 6. l, m Body weight (l) ad fat mass and lean mass (m) of 9 weeks HFD-fed pAdPATZ1KO and PATZ1F/F mice. pAdPATZ1KO: n = 10 and PATZ1F/F: n = 6. n GTT was performed in 9 weeks HFD-fed pAdPATZ1KO and PATZ1F/F mice pAdPATZ1KO: n = 10 and PATZ1F/F: n = 6. o Gross appearance of iWATs, gWATs, BATs, and livers of 9 weeks HFD-fed pAdPATZ1KO and PATZ1F/F mice. p H&E-stained histological slide from iWAT of 9 weeks HFD-fed pAdPATZ1KO and PATZ1F/F mice. Scale bars, 100 μm. i Results from three independent experiments. ac, e, f, il Unpaired Student’s t-test. n Two-way ANOVA. j, k ANCOVA. Data were mean ± s.e.m. **p < 0.01; *p < 0.05. b, c, e, f, il, n comparing to PATZ1F/F. Source data are provided as a Source Data file.

References

    1. Rosen, E. D. & MacDougald, O. A. Adipocyte differentiation from the inside out. Nat. Rev. Mol. Cell Biol.7, 885–896 (2006). - PubMed
    1. Cristancho, A. G. & Lazar, M. A. Forming functional fat: a growing understanding of adipocyte differentiation. Nat. Rev. Mol. Cell Biol.12, 722–734 (2011). - PMC - PubMed
    1. Gupta, R. K. et al. Transcriptional control of preadipocyte determination by Zfp423. Nature464, 619–623 (2010). - PMC - PubMed
    1. Cristancho, A. G. et al. Repressor transcription factor 7-like 1 promotes adipogenic competency in precursor cells. Proc. Natl Acad. Sci. USA108, 16271–16276 (2011). - PMC - PubMed
    1. Birsoy, K., Chen, Z. & Friedman, J. Transcriptional regulation of adipogenesis by KLF4. Cell Metab.7, 339–347 (2008). - PMC - PubMed

Publication types

Associated data