. 2024 Oct 2;10(1):111.
doi: 10.1038/s41540-024-00428-3.

Inertial effect of cell state velocity on the quiescence-proliferation fate decision

Affiliations

Inertial effect of cell state velocity on the quiescence-proliferation fate decision

Harish Venkatachalapathy et al. NPJ Syst Biol Appl. .

Abstract

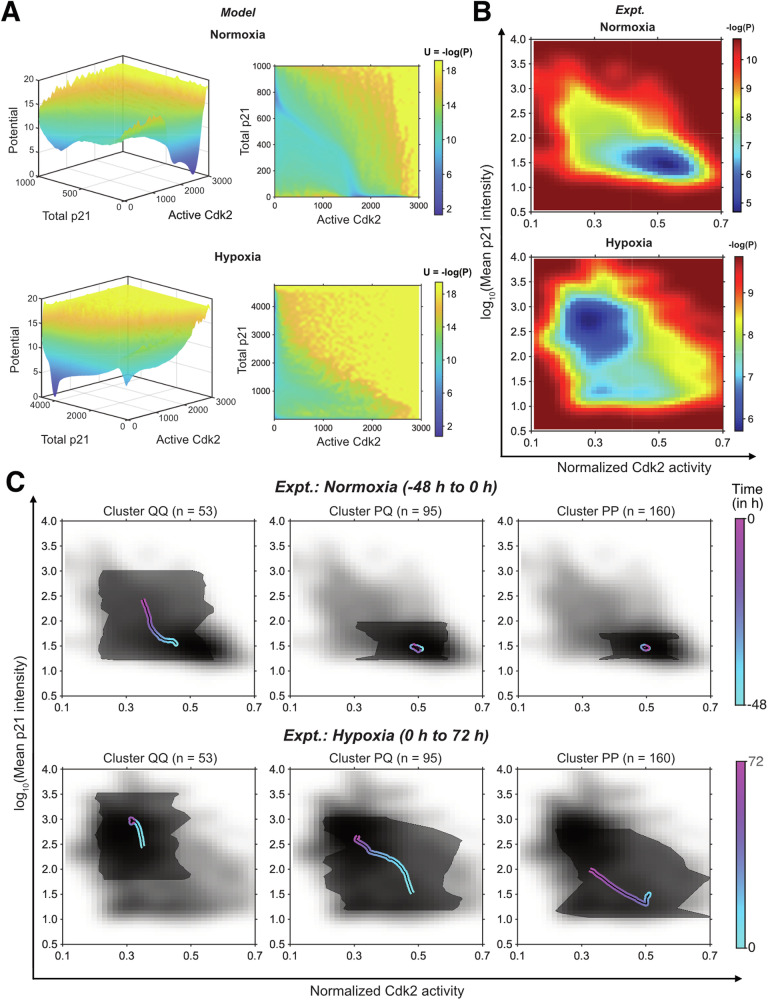
Energy landscapes can provide intuitive depictions of population heterogeneity and dynamics. However, it is unclear whether individual cell behavior, hypothesized to be determined by initial position and noise, is faithfully recapitulated. Using the p21-/Cdk2-dependent quiescence-proliferation decision in breast cancer dormancy as a testbed, we examined single-cell dynamics on the landscape when perturbed by hypoxia, a dormancy-inducing stress. Combining trajectory-based energy landscape generation with single-cell time-lapse microscopy, we found that a combination of initial position and velocity on a p21/Cdk2 landscape, but not position alone, was required to explain the observed cell fate heterogeneity under hypoxia. This is likely due to additional cell state information such as epigenetic features and/or other species encoded in velocity but missing in instantaneous position determined by p21 and Cdk2 levels alone. Here, velocity dependence manifested as inertia: cells with higher cell cycle velocities prior to hypoxia continued progressing along the cell cycle under hypoxia, resisting the change in landscape towards cell cycle exit. Such inertial effects may markedly influence cell fate trajectories in tumors and other dynamically changing microenvironments where cell state transitions are governed by coordination across several biochemical species.


Conflict of interest statement

The authors declare no competing interests.

Figures

Fig. 1
Fig. 1. Heterogeneity in quiescence-proliferation under hypoxia in MCF-7 cells is explained by a p21-Cdk2 toggle switch.
A Schematic of the p21-Cdk2 dependence of the quiescence-proliferation decision. As a population of cells experiences stress, individual cells switch from proliferation to quiescence at different thresholds. At low stress, most cells are proliferative and at high stress, most cells are quiescent. Using a bulk measurement such as western blotting would show a continuum in p21 and Cdk2 expression due to averaging of individual cell behavior. B Quantification of western blots of p21 (left) and Cdk2 (right) expression under cobalt chloride treatment in MCF-7 cells at different times. Bar graphs and error bars represent the mean and s.d. of three independent experiments. Measurements at different time points within an experiment are from different wells that were seeded at the same time with cells from the same passage. P values calculated by ANOVA followed by Dunn’s post hoc test with multiple comparison corrections (*P < 0.05, **P < 0.01, ***P < 0.001, ****P < 0.0001). Representative images of full blots are shown in Supplementary Fig. 13. C Immunostaining images of MCF-7 cells under hypoxia showing nuclei stained by DAPI (top left), Cdk2 (green, top right), p21 (red, bottom left), and merged (bottom right). The scale bar represents 200 µm. Image brightness and contrast adjusted for clarity. D Potential energy landscape of the p21-Cdk2 computational model as a function of total p21 and active Cdk2.
Fig. 2
Fig. 2. Energy landscapes under normoxia and hypoxia and observed cell fate heterogeneity.
A Computationally calculated energy landscapes under normoxia (E2F synthesis rate = 1.19 (i.e., 20.25) times the basal value) and hypoxia (E2F synthesis rate = 0.71 (i.e., 2-0.5) times the basal value and p53 degradation rate = 10−2 times the basal value). B Experimental density plots generated using single-cell tracking imaging data (n = 308 cells). C Subpopulations of behavior observed under normoxia followed by hypoxia: cells entering a quiescent state in normoxic conditions that remain quiescent under hypoxia (Cluster QQ, n = 53 cells), cells proliferative under normoxia but quiescent under hypoxia (Cluster PQ, n = 95 cells), and cells proliferative under normoxia that remain proliferative under hypoxia (Cluster PP, n = 160 cells). Line plot indicates mean path of the cluster on the landscape and the shaded region represents the 90th and 10th percentile bounds of the cluster. Color on the line indicates the time (in h) either in normoxia (top) or hypoxia (bottom).
Fig. 3
Fig. 3. The effects of initial position and intrinsic biomolecular noise on cell fate heterogeneity.
A Pictographic representation of the hypothesized dependence of cell fate on initial position. B Effect of initial p21 levels and Cdk2 activities on cell fate under hypoxia. Statistical comparison of mean ranks was carried out by Kruskal–Wallis test followed by multiple comparisons as the samples failed a Kolmogorov–Smirnov normality test. C Effect of initial cell cycle position on cell fate. Distributions were compared using the Kolmogorov–Smirnov test for discrete distributions, followed by Bonferroni correction for multiple comparisons. D Pictographic representation of the observed dependence of cell fate on initial position. E Schematic of sources of intrinsic noise captured in the model for the p21-Cdk2 switch. Box plots are intra-cell coefficients of variation in p21 expression calculated across n = 1000 simulated cells over a period of 24 h in 20-min intervals. The orange line indicates the overall coefficient of variation of p21 expression in all 1000 cells during this period. F Box plot of the intra-cell coefficient of variation in p21 expression in cells in cluster QQ between 48 h to 72 h (n = 53 cells). Orange line represents overall coefficient of variation in p21 expression across all cells in cluster QQ during this time period (**P < 0.01; ***P < 0.001; ****P < 0.0001).
Fig. 4
Fig. 4. System parameters drive the inertial effect of velocity.
A Effect of change in parameters on cell cycle velocity with parameters positively affecting cell cycle velocity in blue and those negatively affecting velocity in orange. Parameter identities are as follows: basal E2F synthesis rate (blue circle), E2F-dependent E2F synthesis rate (blue square), basal Cyclin E synthesis rate (blue diamond), Cyclin E-dependent Rb phosphorylation rate (blue x), Cyclin D-dependent Rb phosphorylation rate (blue plus), Cyclin D expression (blue star), basal E2F degradation rate (orange circle), total Rb (orange square), basal Rb dephosphorylation rate (orange diamond), and Cyclin-CDK activity threshold for initiation of DNA synthesis (orange x). B Distribution of cell cluster identity as a function of number of cell divisions prior to hypoxia. Division number distributions between different clusters were compared with a discrete version of the Kolmogorov–Smirnov test. C Box plots of the mother cell cycle times of cells that were born <3 h after hypoxia induction. Statistical significance determined by a Wilcoxon rank sum test as the samples failed a Kolmogorov–Smirnov normality test. D Schematic of a hypothetical system affected by extrinsic noise resulting in inter-cell variation in the steady-state value and the effect of rescaling from 0 to 1. Box plots of intra-cell coefficient of variation in p21 expression of cells in cluster QQ before and after rescaling (same data as used in Fig. 3F). E Probabilities of sister cells being in the same cluster or different clusters (n = 60 pairs). Statistical significance is calculated by 105 instances of probability calculation after randomization of cluster identities in sister cells. F Phase space diagram showing the dependence of cell fate on the deviation of p53 degradation rate and E2F synthesis rate from basal values. Green and blue regions represent quiescence and proliferation, respectively; yellow region represents a bistable region. The expected parameter ranges under hypoxia and normoxia are shown as hollow rectangles. Graph recolored and phase space boundaries drawn post plotting for clarity. G, H Bar plots showing the probability that a pair of sister cells are both quiescent (dark gray, nnormoxia = 3 pairs, nhypoxia = 18 pairs), have different cell fates (light gray, nnormoxia = 6 pairs, nhypoxia = 17 pairs), or are both proliferative (white, nnormoxia = 51 pairs, nhypoxia = 25 pairs) prior to hypoxia (G) as well as after hypoxia induction (H). Orange lines indicate the mean expected probabilities for each case if cell fate inheritance was random. Randomized mean and statistical significance were calculated by 105 instances of probability calculation after randomization of cluster identities. (#P = 0.06, *P < 0.05; **P < 0.01; ***P < 0.001; ****P < 0.0001).
Fig. 5
Fig. 5. Cell decision-making on the reduced p21-Cdk2 energy landscape under the position-only paradigm and the position + velocity paradigm.
Cells are typically proliferative under normal conditions. However, under stress, the landscape becomes biased towards quiescence. In the position-only paradigm, we would expect all cells in the indicated position to enter quiescence. However, we observe that fates are velocity-dependent, with high-velocity cells having sufficient inertia to overcome the change in landscape conditions and continue being proliferative.

Update of

Similar articles

Cited by

References

    1. Koopmans, L. & Youk, H. Predictive landscapes hidden beneath biological cellular automata. J. Biol. Phys.47, 355–369 (2021). - PMC - PubMed
    1. Ye, Z. & Sarkar, C. A. Towards a quantitative understanding of cell identity. Trends Cell Biol.28, 1030–1048 (2018). - PMC - PubMed
    1. Li, C. & Wang, J. Quantifying cell fate decisions for differentiation and reprogramming of a human stem cell network: landscape and biological paths. PLoS Comput. Biol.9, e1003165 (2013). - PMC - PubMed
    1. Mojtahedi, M. et al. Cell fate decision as high-dimensional critical state transition. PLoS Biol.14, 1–28 (2016). - PMC - PubMed
    1. Sáez, M. et al. Statistically derived geometrical landscapes capture principles of decision-making dynamics during cell fate transitions. Cell Syst.13, 12–28.e3 (2022). - PMC - PubMed

MeSH terms

Substances

LinkOut - more resources