

Analyses of whole-genome sequences from 185 North American Thoroughbred horses, spanning 5 generations
- PMID: 39358442
- PMCID: PMC11447028
- DOI: 10.1038/s41598-024-73645-9
Analyses of whole-genome sequences from 185 North American Thoroughbred horses, spanning 5 generations
Abstract
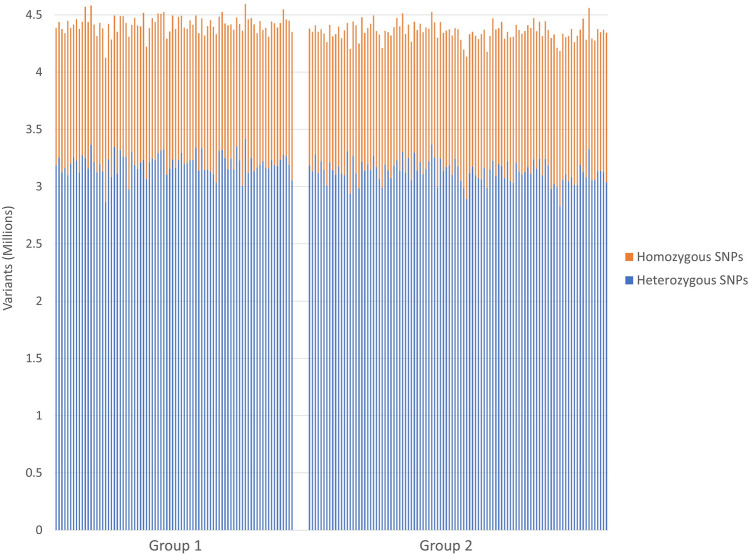
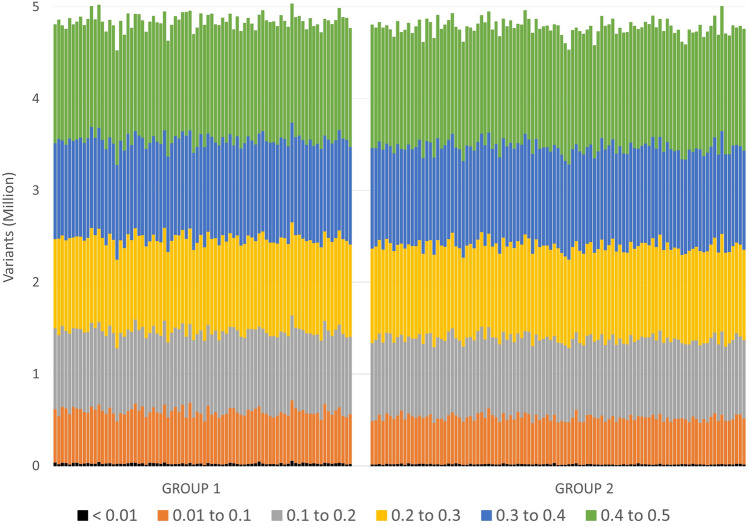
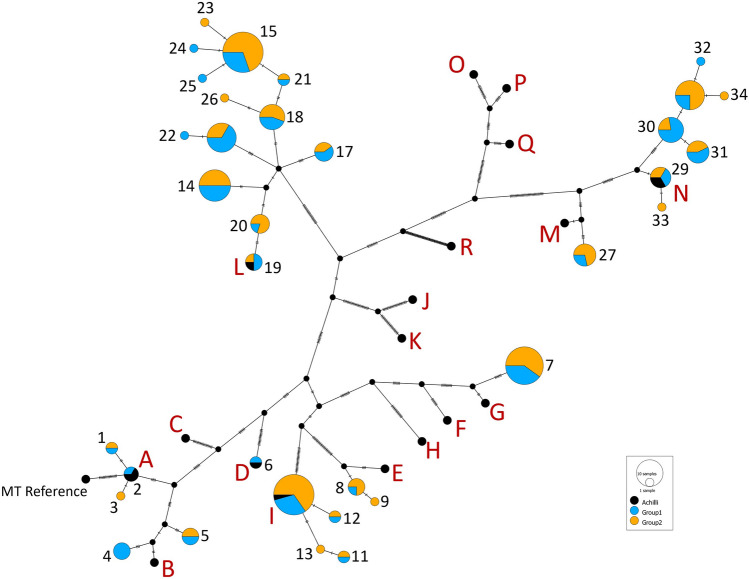
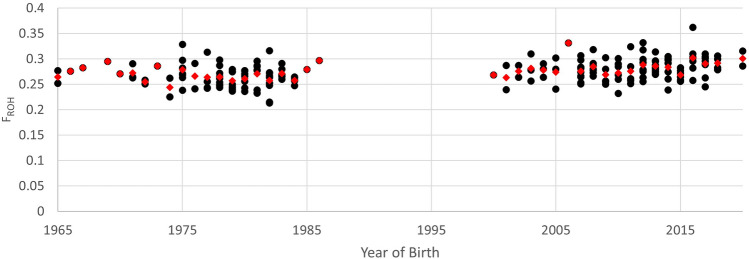
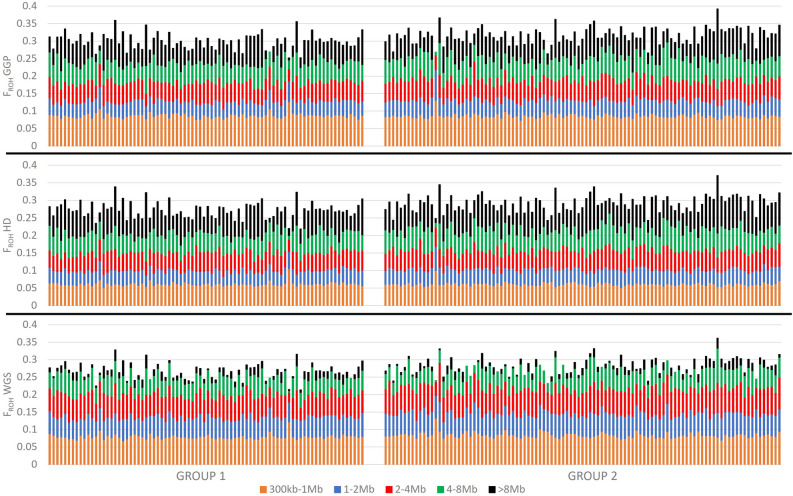
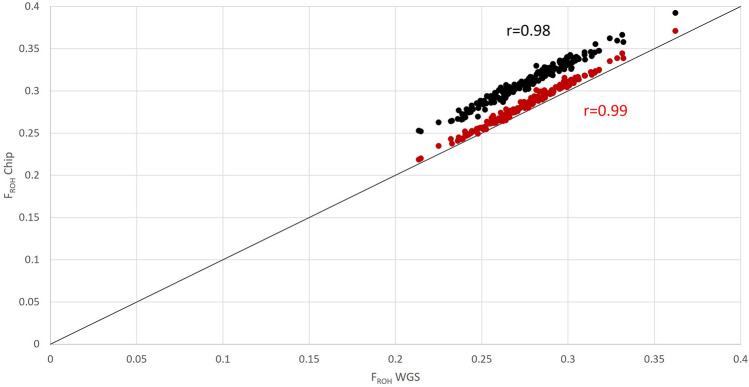
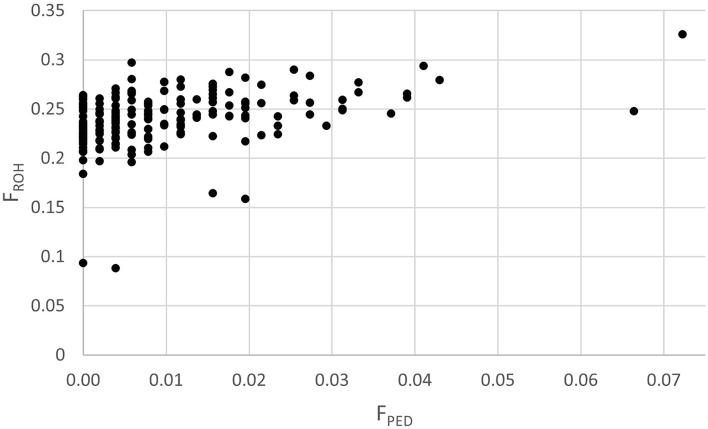
Whole genome sequences (WGS) of 185 North American Thoroughbred horses were compared to quantify the number and frequency of variants, diversity of mitotypes, and autosomal runs of homozygosity (ROH). Of the samples, 82 horses were born between 1965 and 1986 (Group 1); the remaining 103, selected to maximize pedigree diversity, were born between 2000 and 2020 (Group 2). Over 14.3 million autosomal variants were identified with 4.5-5.0 million found per horse. Mitochondrial sequences associated the North American Thoroughbreds with 9 of 17 clades previously identified among diverse breeds. Individual coefficients of inbreeding, estimated from ROH, averaged 0.266 (Group 1) and 0.283 (Group 2). When SNP arrays were simulated using subsets of WGS markers, the arrays over-estimated lengths of ROH. WGS-based estimates of inbreeding were highly correlated (r > 0.98) with SNP array-based estimates, but only moderately correlated (r = 0.40) with inbreeding based on 5-generation pedigrees. On average, Group 1 horses had more heterozygous variants (P < 0.001), more total variants (P < 0.001), and lower individual inbreeding (FROH; P < 0.001) than horses in Group 2. However, the distribution of numbers of variants, allele frequency, and extent of ROH overlapped among all horses such that it was not possible to identify the group of origin of any single horse using these measures. Consequently, the Thoroughbred population would be better monitored by investigating changes in specific variants, rather than relying on broad measures of diversity. The WGS for these 185 horses is publicly available for comparison to other populations and as a foundation for modeling changes in population structure, breeding practices, or the appearance of deleterious variants.
Keywords: Equus caballus; Genetic diversity; Inbreeding; Population genetics; Variant discovery; mtDNA.
© 2024. The Author(s).
Conflict of interest statement
The authors declare no competing interests.
Figures
References
-
- Willett, P. The Classic Racehorse (University Press of Kentucky, 1982).
-
- Bower, M. A. et al. The genetic origin and history of speed in the Thoroughbred racehorse. Nat. Commun. 3, 643 (2012). - PubMed
-
- Binns, M. M. & Morris, T. Thoroughbred Breeding: Pedigree Theories and the Science of Genetics (J.A. Allen, 2011).
-
- Cunningham, E. P., Dooley, J. J., Splan, R. K. & Bradley, D. G. Microsatellite diversity, pedigree relatedness and the contributions of founder lineages to thoroughbred horses. Anim. Genet. 32, 360–364 (2001). - PubMed
